
Abstract
Recommender Systems is a highly applicable subclass of information filtering systems, aiming to provide users with personalized item suggestions. These systems build on collaborative filtering and content-based methods to overcome the information overload issue. Hybrid recommender systems combine the abovementioned methods and are generally proved to be more efficient than the classical approaches. In this paper, we propose a novel approach for the development of a hybrid recommender system that is able to make recommendations under the limitation of processing small amounts of data with strong intercorrelation. The proposed hybrid solution integrates Machine Learning and Multi-Criteria Decision Analysis algorithms. The experimental evaluation of the proposed solution indicates that it performs better than widely used Machine Learning algorithms such as the
Introduction
Recommender Systems (RSs) have admittedly received increasing interest in the last two decades and have been applied in a plethora of business problems including e-marketing and e-commerce. This is mainly due to their ability to meaningfully filter data and provide users with personalized suggestions of items that correspond to their needs and preferences. This attribute, alongside with the high levels of efficiency and accuracy that RSs achieve, make them one of the most popular categories of Information Systems [15, 20, 14].
To effectively operate and provide useful recommendations, RSs need a wealth of data [18, 3]. The main weaknesses of these systems concern their underperformance in datasets that are suffering by sparsity or lack of data. This issue is broadly known in the literature as the “cold start” problem [8]. Additional problems emerge in contexts characterized by the absence of strong intercorrelated data, which is often associated with the problem of overfitting [29]. In this paper, we propose a novel solution that deals efficiently with the above issues. Specifically, the proposed approach builds on the integration of Machine Learning (ML) and Multi-Criteria Decision Analysis (MCDA) algorithms.
Generally speaking, the term ML refers to the automated detection of meaningful and often hidden patterns in data through the application of specific algorithms [28]. These algorithms build on mathematical and statistical models and theories. The selection of the appropriate algorithm depends on the mathematical models they use and the volume of the available data they are applied on [3]. On the other hand, MCDA algorithms mainly aim to support users effectively handle a decision-making process. To fulfil this aim, they categorize or rank the problem’s alternatives, taking into account specific criteria according to the dataset under consideration and the user’s utility function [12]. During the last years, several RSs utilize MCDA algorithms to provide recommendations.
According to the literature, there is a strong research interest towards integrating techniques from the abovementioned two fields (i.e. ML and MCDA) to solve a variety of problems. These integration approaches basically aim to expand the abilities of ML algorithms by exploiting the qualitative features obtained through the interpretations of MCDA results, and vice versa [7, 19]. However, to the best of our knowledge, there is no such system that simultaneously deals with the lack of data issue and the insufficiency of strong intercorrelated data.
The approach proposed in this paper addresses the above shortcomings by meaningfully integrating two ML algorithms, namely the
The remainder of this paper is organized as follows: Section 2 outlines the methods and algorithms integrated in our approach. Section 3 comments on research activities concerning the application of simple and hybrid MCDA methods in recommender systems, as well as on the application of hybrid MCDA methods in classical problems. Section 4 describes in detail the proposed approach and the algorithms implemented. Section 5 presents and comments on experimental evaluation results obtained from the utilization of a dataset concerning hotels and the associated users’ ratings on their specific attributes. Finally, Section 6 concludes by discussing the limitations of our work, while also suggesting future work directions.
Background issues
ML Algorithms
According to the literature, there are several types of ML algorithms, each having its own purpose and benefits. The selection of the ML algorithms to be used in the proposed approach was based on a detailed survey of how their underlying models fit to the peculiarities of the context under consideration. Specifically, we selected the
When applied to RSs, ML algorithms should specify a series of metrics. For example, when we apply the
Overfitting is the problem occurring when the model excessively takes into account the features of a training dataset and fails to produce forecasts for future data instances in a reliable way [33]. This impacts negatively the performance of a model, in particular when it is applied to new data entries, since the information extracted from the training data is too specific to be applied on different datasets [11].
k-NN
Summary of approaches in the literature
Summary of approaches in the literature
Decision trees (DTs) are also a very efficient supervised ML algorithm. They aim to forecast a specific dependent variable by correlating data of different categories and types (being they continuous or not). The main advantage of this algorithm is that it does not require huge amounts of data to train the function that makes the forecasts [24]. Thus, this algorithm fits even better than the
MCDA methods
MCDA methods aim to model users’ preferences to support them in decision making [16, 12]. They fit well with intercorrelated data, which is in line with the requirements of our approach.
AHP
The AHP method is considered as one of the most accurate methods to quantify the weights of criteria for problems of average difficulty [26]. Moreover, it is a user-friendly method that is based on the decomposition of the decision problem and pair-wise comparisons of the respective elements These particular characteristics justify the selection of the AHP method for the calculation of weights of the proposed model’s criteria. The required input of this method is the pairwise comparison matrix between the conflict criteria. The matrix illustrates the decision maker’s preference for the relative importance of‘ the criteria under consideration [25].
PROMETHEE
For the calculation of rankings between alternatives, one of the well-known and efficient methods is PROMETHEE [6]. The ability of this method to deal well with intercorrelated data is the main reason behind its selection and utilization in our approach. The required inputs of the PROMETHEE method are: (i) the identified alternatives, (ii) the type of the criteria, their thresholds and directions (i.e., minimize or maximize criterion), and (iii) the weights of the specific criteria. The outputs of the method are the positive (
Related work
Multi-criteria analysis in recommender systems
As it can be revealed from the literature, alternative combinations of MCDA methods have been already applied in recommender systems of diverse purpose and scope (a summary of such approaches is given in Table 1). For instance, a combination of the Analytic Hierarchy Processing (AHP) and Simple Additive Weighting (SAW) methods has been applied in the development of a hybrid multicriteria decision-making approach that aims to select the most suitable IoT application for users with different characteristics [21].
Another application of MCDA method deals with two of the most commonly encountered RS issues, namely the cold startproblem and the sparsity of data. There are several approaches that address these issues through the implementation of hybrid MCDA algorithms. A solution that deals with these limitations has been presented by Matsatsinis and Manarolis [22], which aims to alleviate the sparsity problem and the absence of the multidimensional correlation measures. The proposed hybrid algorithm derives from the combination of the MCDA methods, namely UTADIS, and adopts collaborative filtering techniques to produce advanced recommendation algorithms. To test the hybrid method, the Minimum Absolute Error (MAE) statistical metric was used and four systems (two hybrid ones, one based on collaborative filtering, and one based on UTADIS) were compared separately in datasets with sparse data. The comparison showed the dominance of the hybrid models.
In the same research line, Shambour and Lu [27] have designed a prototype hybrid RS, namely MC-SeCF, which aims to improve problematic issues of classic recommendation algorithms that are mainly due to the lack of data. Their hybrid system combines two different approaches, namely a content-based one that is implemented with MCDA methods and one based on semantic analysis. The reported experiments confirm the effectiveness of the MC-SeCF hybrid approach in improving sparse data and cold start problems by achieving better accuracy and more coverage in very sparse and new object datasets than the reference data-based collaborative filtering algorithms. The comparative assessment proves an obvious improvement in the efficiency curves.
Another hybrid RS has been developed for the management of devices that co-operate with multiple screens [31]. This system combines MCDA techniques to create the static and dynamic profiles of the devices with clustering techniques to classify users into clusters. Moreover, depending on their priorities, it associates the users of each cluster with the corresponding screens. The proposed method, when compared to those previously reported in the literature, demonstrates their hybrid model’s prevalence. The MAE and Precision metrics were used for the comparison of associated models.
Interesting applications of RSs that outperform the widely used algorithms in the domain have been also reported in the literature. For instance, a film recommendation application that is based on a mixed algorithm has been described in [17]. Their algorithm originated from an integration of MCDA techniques, specifically the UTA method, into various collaborative filtering algorithms. UTA is used to model user profiles by forecasting their utility function. In this way, the collaborative filtering algorithm may detect similarities based on the above functions. Several statistical metrics (MAE, RMSE, etc.) were used for evaluating purposes and the results showed that the suggested model was outperforming the standard RS algorithms.
On a similar direction, a prototype hybrid RS that incorporates Data Mining and Natural Language Processing (NLP) techniques is presented in [13]. This system aims to capture a hotel’s impact on social media by creating new variables (indicators) that are not provided in the dataset. Various statistical metrics were used for the system’s assessment (MAE, RMSE etc.). A comparison with other systems proved the hybrid model’s superiority in terms of accuracy (more than 20%). Moreover, the system was proved to enable the extraction of insights that can help a hotel’s management build more profitable strategies.
Other applications of multi-criteria analysis
Multi-criteria analysis methods have been applied in a big variety of domains, including supply chain, clinical trials and forest management. For instance, such an approach combining correlation diagrams with the AHP and fuzzy TOPSIS methods [4] has been suggested for supply chain management purposes. The purpose of the corresponding system is to manage city logistics in cases of insufficient datasets. The proposed system was proven to work quite satisfactorily; however, the choice of these criteria and weights is a matter of personal experience and should be determined by users who are already involved in similar systems.
Carvalho et al. [10] developed a hybrid MCDA system to support doctors in clinical decisions about breast cancer. The hybrid model was created by combining Bayes networks with the MACBETH MCDA method. Specifically, the values of the criteria in each alternative method were derived from the analysis of data through the Bayes algorithm. The proposed hybrid model performs efficiently, enabling the ability to extract patterns and additional knowledge; however, it is admitted that more medical datasets are demanded to increase the system’s accuracy.
Finally, an overview of hybrid and non-hybrid MCDA methods applied in forest management is given in [30]. In this work, authors list many applications with different combinations of hybridization. It is shown that hybrid MCDA methods can take into consideration the various factors involved in forest management and even quantify values through qualitative analysis. Moreover, these methods can measure and calculate the variability of solutions depending on the values of the associated parameters.
The proposed approach.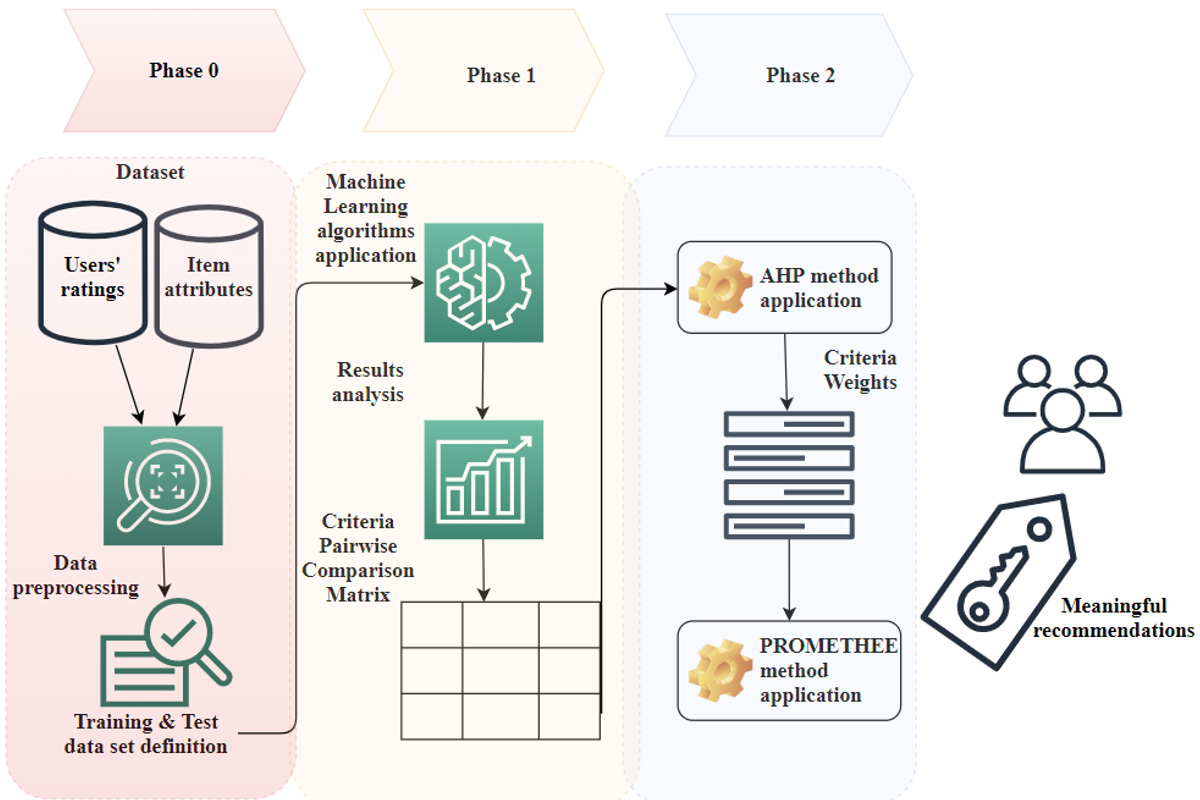
This paper proposes a novel approach to efficiently handle the cold start problem in RSs, which builds on a meaningful integration of ML and MCDA algorithms. The motivation behind the proposed integration can be justified by two main reasons. First, ML algorithms provide a customary way to learn a utility function that recommends items to a user, which is the main element in the implementation of a RS. Second, MCDA techniques offer a well-established methodology to analyze and model a user’s value system; thus, they may further contribute to the implementation of RSs.
To properly tackle the cold start problem in the development of RSs, we need to deal with the underperformance of ML algorithms under the limitation of processing small volumes of data. Appropriate treatments to overcome the intercorrelated data issue must be ensured as well. The combination of the aforementioned issues poses significant challenges in the implementation of the ML algorithms, especially affecting their training phase. In addition, we should take into account that the model’s ability to be generalized is reduced in the context under consideration, which in turn leads to the problem of model over-fitting.
To accurately provide suggestions in the context under consideration, it is essential to model the utility function of the user. The preferences of the users can be easily determined by utilizing MCDA techniques. We take advantage of the intercorrelations between the variables to interpret the associated utility function. The utilization of these techniques provides meaningful and interpretable results in each step of the algorithm, since it works progressively. Their features admittedly reduce the algorithm’s autonomy but enable the interpretability and the informed documentation of the results.
Aiming to build an overall ranking of the problem’s alternatives, the proposed algorithm comprises three phases (see Fig. 1), which are described in detail below.
Phase 0
In this pre-processing phase, we utilize statistical analysis tools to filter the data, aiming to eliminate the noise they may contain and identify the basic parameters for the implementation of ML algorithms that takes place in the next phase. Specifically, we define (i) the variables and alternatives of the problem under consideration, (ii) the number of variables’ entries, (iii) their type, and (iv) the target variable.
Additionally, quantitative information about the available data, such as the frequencies and the range of values a variable can take, is extracted by using descriptive statistics tools (i.e. contingency tables). This information aids the selection of appropriate metrics for the dataset in hand, as well as the specification of the training and test data sets.
Phase 1
Utilizing the output of Phase 0 (i.e. group of variables, training and test sets), in Phase 1 we apply the ML algorithms discussed above. For the implementation of the specific algorithms, the necessary inputs are the variation between the training and test datasets and the metrics identified. The algorithms we apply (
The aforementioned feedback is significant because it helps us (i) identify all the criteria that we will use in the MCDA models, and (ii) create the pairwise comparison matrix between criteria. Specifically, we consider a subset of the dataset’s variables that describes important features of items and users’ preferences, which will be then used by criteria functions of the MCDA model.
The importance of each variable is useful. If a variable has low level of importance, this means either that the specific variable affects insignificantly the final prediction, thus it should be discarded, or it is satisfied by the majority of the items of the dataset, thus it should be considered as a cut-off criterion. In this way, we reduce the number of variables-criteria of the final model and its associated complexity. Finally, the identification of criteria’s direction and thresholds is derived from the information given by the quantitative characteristics of the dataset (elaborated in Phase 0).
Phase 2
In the last phase, we apply the PROMETHEE method to derive the final ranking of the alternatives from the dataset. As noted in Section 2, the required inputs of this method are: (i) the identified alternatives, (ii) the type of the criteria, (iii) their thresholds, (iv) their direction (i.e. minimize or maximize criterion), and (v) the weights of the specific criteria. The first four input categories have been already calculated in the previous two phases, while the weights of the specific criteria are calculated through the AHP method. To this aim, the pairwise comparison matrix for the criteria under consideration is also needed, which was calculated in Phase 1.
Application and evaluation
This section reports on the experimental application and evaluation of the proposed approach through a specific dataset (namely the Las Vegas Strip Data Set, available at
The qualitative characteristics of the dataset are: (i) it contains a small volume of data (thus fitting to our aim to tackle the cold start problem), (ii) it has no missing values in its variables (thus it does not suffer from data sparsity), (iii) it includes a similar number of records for each hotel (i.e. alternative) and (iv) the distribution of values given to these variables is not uniform; for instance, for the variable Spa the ratio between the values “Yes” and “No” is 75-25.
It is noted here that the target variable, which is related to the recommendations to be generated by our approach, is the variable Score. This variable reflects the rating given by users for each hotel, which is in the range 1 (minimum rating) to 5 (maximum rating).
Data preprocessing
To better train the proposed model with the specific dataset, we convert the type of the target variable from numerical to nominal (taking the value “Yes” or “No”, implying that the preferences of a user are satisfied by the specifications of a hotel or not) The numerical values 1 and 2 are expectedly converted to “No”, while values 4 and 5 are converted to “Yes”. By noticing that the value 3 corresponded to a percentage of 13% of the target variable ratings, as well as that users who had rated hotels with score lower than 3 represented a very small percentage of the target variable ratings (approximately 10%), we converted the value 3 to “No” (by increasing the records corresponding to “No”, we aim at achieving a higher rate of successful predictions related to this value). Our preprocessing renders a percentage of 77% for the “Yes” value and a remaining 23% for the “No” value.
Application of ML algorithms
According to the proposed approach, we firstly apply the
To determine the value of
Variation of AUC indicator depending on the percentages of the training set and different values of 
Variation of the CA indicator depending on the percentage of the training dataset (for the 
Based on the above outcomes, we specify a percentage of 90% for the training dataset, since for this percentage the algorithm gets the highest accuracy. We then apply the
It is noted here that the specific ratio between the training and test datasets (i.e. 90-10) is not usual in ML algorithms. In our case, this ratio is selected to ensure a better learning curve of the
Using the abovementioned values and metric, the algorithm performs well; this is justified by its ability to forecast types I and II errors (29% and 35% respectively). The type I error corresponds to the percentage of values that are wrongly forecasted as “No”, while the type II error corresponds to the percentage of values that are wrongly forecasted as “Yes”.
As a next step in our approach, we apply the DT algorithm. To implement this algorithm, we must also specify the ratio between the training and the test datasets and the suitable metric that fits to our data. This metric will be actually used to determine the termination condition of the tree. As in the case of the
Variation of CA indicator depending on the training dataset percentage (for the DT algorithm).
In addition, to define the termination condition, we calculate the entropy of the Decision Tree; through such calculations, we can explore the errors that are caused by model overfitting and are related to the number of the DT nodes (see Fig. 5).
Relative error due to model over-fitting.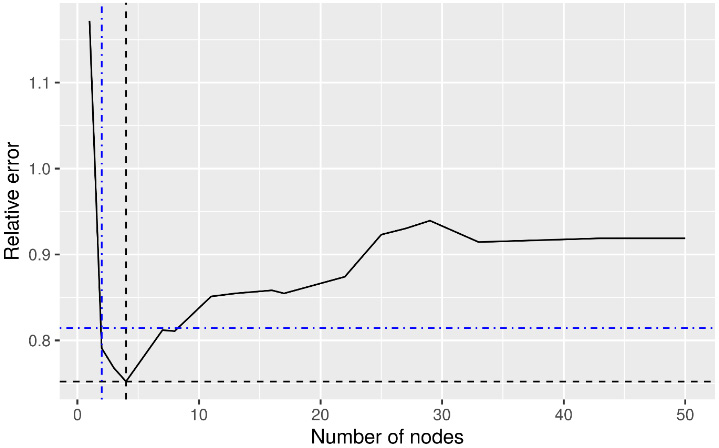
Variations of the Information Gain and AUC indicators according to the number of nodes of the DT.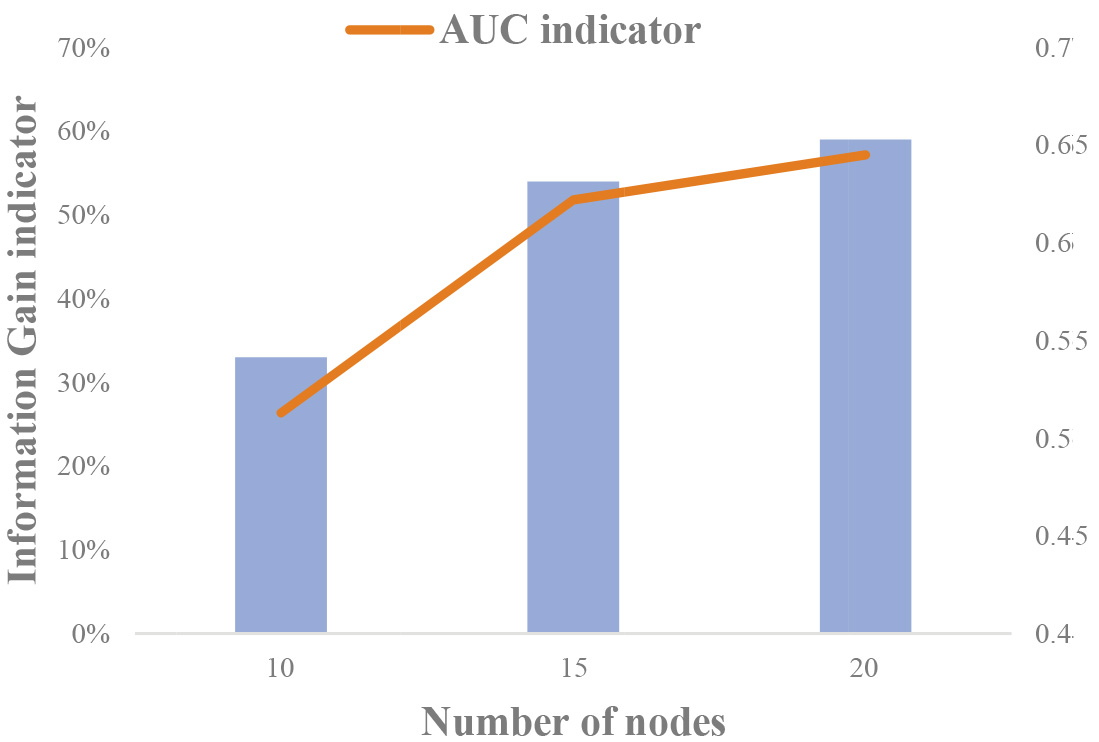
The minimum error due to model overfitting is achieved by using a 4-nodes tree (see Fig. 5). However, such a tree is not informative enough. Thus, we need to compromise between the acceptable level of error and the information that we gain.
We note that in the range of 10 to 20 nodes, the relative errors get low values (see Fig. 5). Additionally, DTs are getting more informative as the number of their nodes is increasing. Thus, we decide to implement 10 different trees, with their number of nodes ranging from 10 to 20. Lastly, we calculate the values of Information Gain (IG) and AUC indicators for each implemented tree. The IG indicator measures the information we gain from a DT according to the value of the entropy and the number of nodes [29, 32]. After this procedure, we conclude that the optimal choice is a 15nodes tree (see Fig. 6).
Range and distribution of variables’ values
Variable importance for ML algorithms forecasts.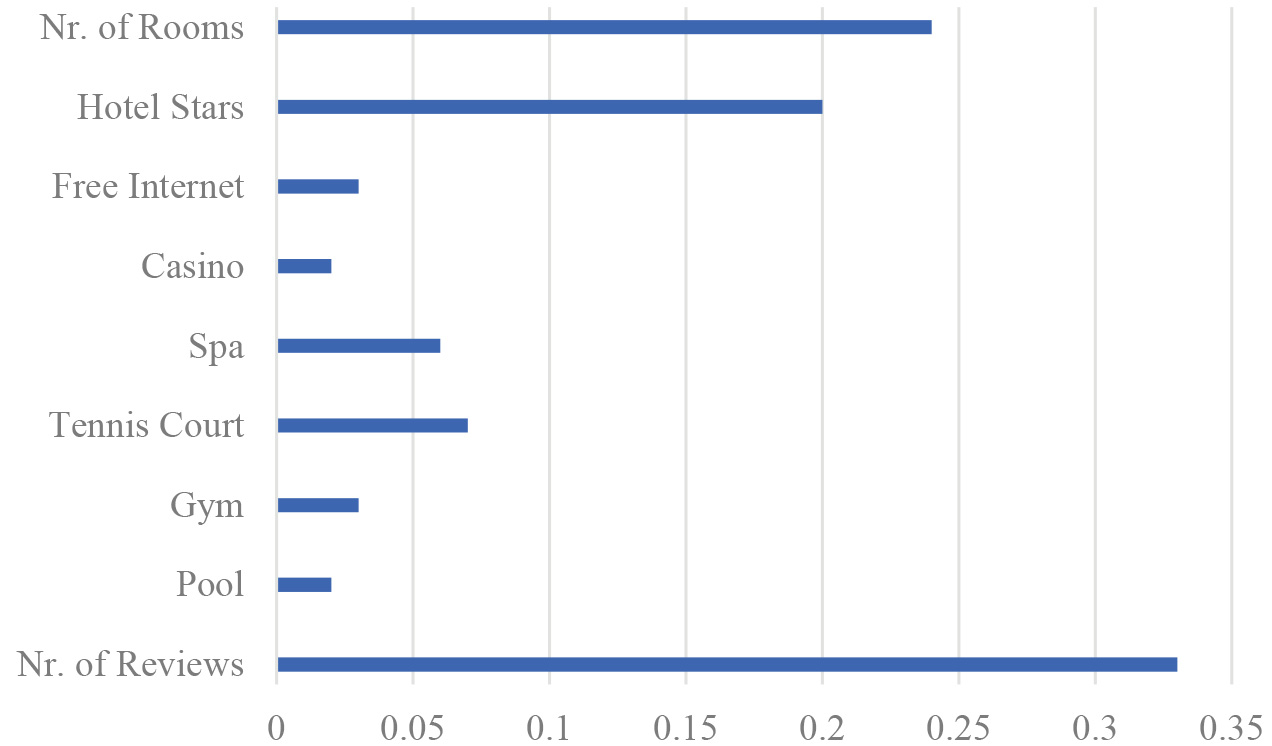
Using the abovementioned values and metric, the algorithm performs well; this is justified by its ability to forecast types I and II errors (35% and 43% respectively).
The main parameters to be specified in a multi-criteria model are the alternatives and the criteria along with their types (normal criteria, semi-criteria, or pseudo-criteria) direction (pursuit of minimization or maximization) and weights.
With respect to alternatives from the set of hotels appearing in our dataset we exclude those that do not satisfy the cutoff criteria requirements. With respect to criteria, we use ten variables from the dataset, namely: pool, gym, tennis court, spa, casino, free internet, hotel stars, number of rooms, number of hotel reviews and score. The selection of the above variables is justified by the following: (i) they are correlated; (ii) they describe the major features of the hotels and (iii) they reflect the user preferences. Such a. criteria selection meets the requirements of completeness and non-redundancy [9]. To model variables as criteria we need to specify their types and thresholds (i.e. preference or indifference threshold). Table 2 summarizes the range and distribution of values given to the selected variables.
Figure 7 presents results concerning the importance of these variables in the forecasting process, as obtained from the implementation of the ML algorithms. As shown in Table 2, the variables pool, gym, casino and free internet are matched with “Yes” values in the majority (
Criteria pairwise comparison matrix
Criteria pairwise comparison matrix
Hybrid and ML models comparison in specific metrics (Error Types I and II, Accuracy).
Weights of the criteria
As far as the variable hotel stars is concerned, it receives a high level of importance in the ML algorithms forecasts (Fig. 7), while 66% of the hotels have been rated as over 4 stars (Table 2). In addition, a statistical analysis of our dataset reveals that the customers’ positive (“Yes”) values for hotels increase linearly with the hotel stars variable. Thus, we model this variable as a linear criterion with an indifference threshold
The variable nr. of hotel rooms significantly affects the forecasts as well. From a statistical analysis, it derives that the majority of hotels have a quite large number of rooms (
As shown in Fig. 7, the variable nr. of hotel reviews receives the highest level of importance in terms of providing insights for the target variable. The values of this variable are divided in two parts (i.e. less or more than 50, see Table 2). In each part, we observe a linear correlation between the number of hotel reviews and the “Yes” values. In the first part the correlation ratio is 7.5% while in the second segment is 23%. The difference between these ratios leads us to model this variable as a linear criterion with a preference threshold equal to 50.
Comparison of the proposed solution against an alternative hybrid model.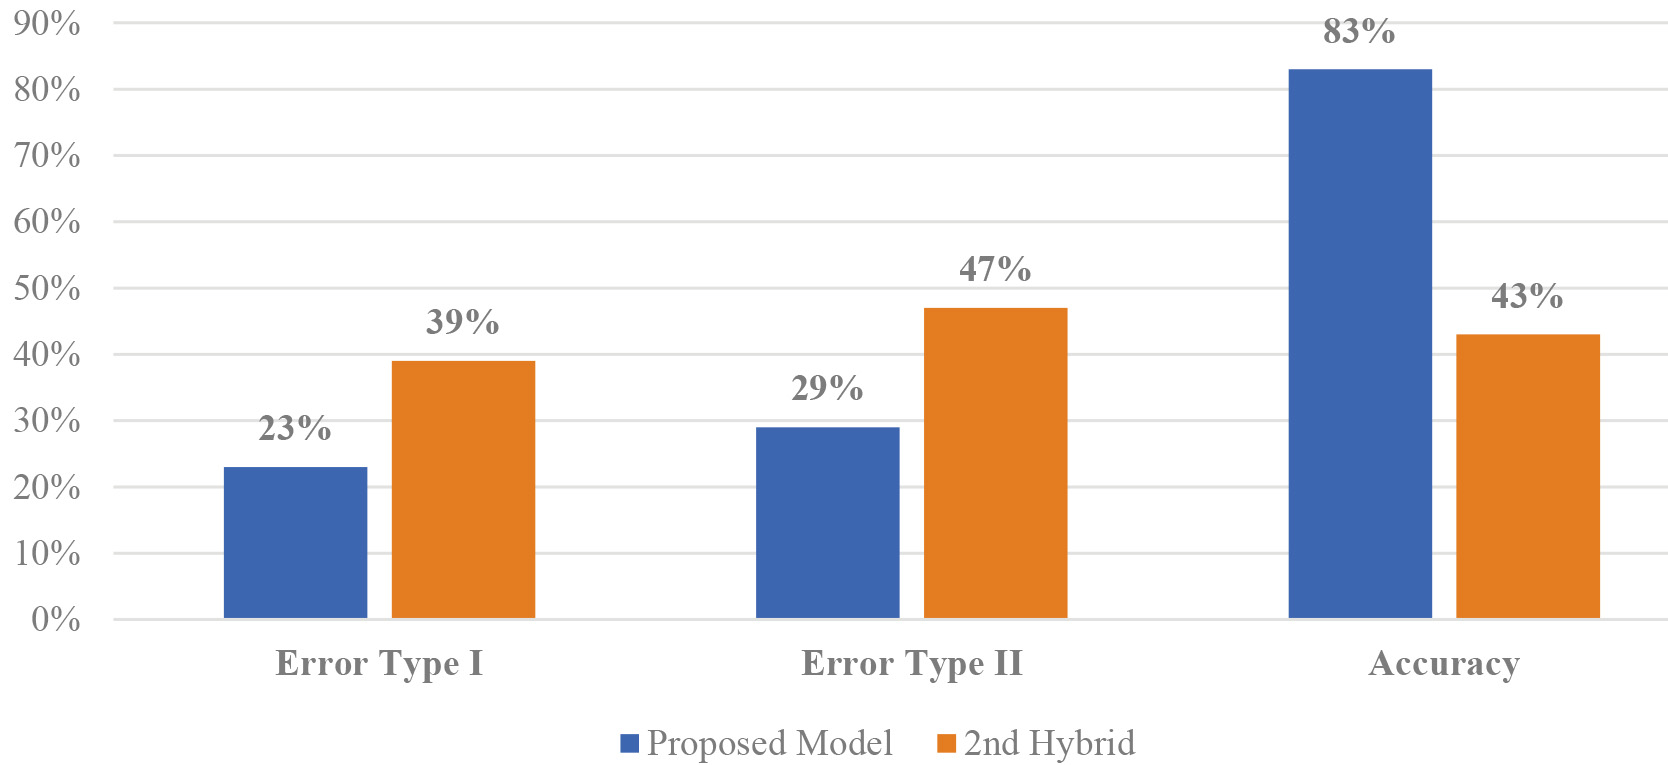
The preference zones of the proposed model.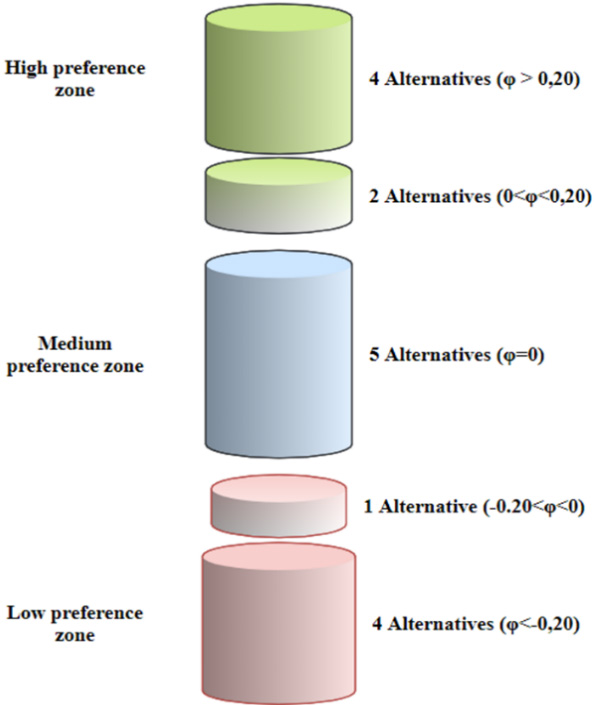
Lastly, we observe that the variables tennis court and spa are not continuous. Therefore, they cannot be described by any continuous function. We model these variables as regular criteria, with the “Yes” value to be always preferred.
The abovementioned elaboration of the problem’s variables is summarized as follows:
The pool, gym, casino and free internet variables are modeled as cut-off criteria. The variable hotel stars is modeled as a linear criterion with indifference threshold The variable nr. of hotel rooms is modeled as a pseudo-criterion with indifference threshold The variable nr. of hotel reviews is modeled as a linear criterion, with The variables tennis court and spa are modeled as normal criteria.
To calculate the weights of the MCDA model, we apply the AHP method. The required input of the AHP method is the criteria pairwise comparison matrix, which reflects the relative significance of the criteria. To capture the significance of the criteria, we adopt the Saaty’s scale on the importance given by the ML algorithms, and accordingly produce Table 3. The AHP method applies eigenvectors on the criteria pairwise comparison matrix to define the weights shown in Table 4.
To assess the acceptance of these weights, we calculate the Consistency Ratio (CR). This ratio is obtained by dividing the Consistency Index (CI) by the Random Consistency Index (RI), which varies upon the number of criteria. Utilizing the eigenvectors method, it is CI
The PROMETHEE produces the ranking of alternatives in descending order of significance. According to their ranking (
Sensitivity analysis for the hybrid system overall ranking.
Based on these rules, we calculate the errors that lead to accuracy definition for the proposed model. The errors types I and II have been calculated for the ML models (i.e.
To further evaluate the robustness of our solution, we have also compared it against another hybrid model (referred to as “2
As illustrated in Fig. 10, there are two alternatives from the high preference zone and one from the low preference zone that are marginally ranked (their
Obviously, the weights of the criteria play a significant role in the final ranking of the alternatives. To test their robustness, a sensitivity analysis is performed, where weights are converted into predefined sets of values and the changes in the final ranking are recorded. In the approach described in this paper we utilized the AHP method to determine the weights, since it has been proven effective in giving realistic results. However, we could use stricter or more flexible weight scenarios.
Finally, Fig. 11 illustrates the differences in the ranking of alternatives, considering three different scenarios (namely, strict, median and flexible scenario). For each ranking, we also note the weights of each criterion. What can be observed is that for small changes within the range defined by the realistic scenarios, the differences in the rankings are quite small for the high-preference and low-preference zones. On the contrary, there are remarkable changes for the middle preference zone. This result reflects the robustness of alternatives classified in the high and low preference zones, which is not the case for the alternatives of the middle preference zone.
Conclusions
The approach described in this paper builds on a meaningful integration of ML and MCDA techniques to address current shortcomings of recommender systems. The proposed approach outperforms well-known algorithms when addressing the “cold start” problem, especially in contexts characterized by the absence of strong intercorrelated data. The overall solution elaborated in this paper is generic, thus applicable to any recommendation context. However, the data preprocessing phase needs to be adjusted upon the particular context elaborated each time, so as to capture and reflect its peculiarities. Additional adjustments may be required to fine tune the MCDA phase with respect to the criteria to be taken into account.
Through a particular dataset, we demonstrated that the proposed approach provides interesting and valuable results for the analyst. In any case, alternative combinations of ML and MCDA techniques should be investigated to test and comparatively assess new forms of hybridization in the area of recommender systems. Another future research direction concerns the exploitation and subsequent integration of additional ML and MCDA algorithms, aiming to better address the diversity of classification and clustering requirements in the settings under consideration.