



Abstract
In this paper the hydrodynamic design procedure for Energy Saving Devices (ESDs) developed in the FP7 EU project GRIP is applied to full scale validation vessel – a newly built handymax Bulk carrier by Uljanik shipyard in Croatia. Three ESDs such as a Pre-Swirl Stator, a Pre Duct and a Rudder Bulb have been designed for this ship by three partner – HSVA, MARIN and VICUS respectively. From the three ESD designs that were submitted, the most promising alternative was selected via a thoroughly performed cross check by all participating partners. For the ESD selection, the hydrodynamic performance of the ESD is the most but not the only important factor; other aspects, such as cavitation risk, structural, manufacture and installation aspects have also been considered, but will not be covered in this paper. The finally selected ESD was HSVA’s Pre-Swirl Stator, which has been developed further and successfully tested during the trials of the full scale ship. In this paper only the conceptual design of PSS during the ESD hydrodynamic design phase and the results of the cross check which has been performed for the selection of ESDs will be presented.
Keywords
Introduction
The European 7th framework project GRIP (Green Retrofitting through Improved Propulsion) addresses the urgent need from industry for installing ESD solutions for existing ships. The high demand for retrofitting is driven largely by four factors: the reduction of CO2 emissions, the fluctuating high fuel prices, effective regulations and the lifetime extension of existing ships. However, it remains highly uncertain whether these devices actually improve the performance of the complete hull-propeller system, and if so why. Some devices showed great promise in model tests, but failed in full-scale validations. For other devices, manufacturers claim proof of large improvements on real-size ships, but these claims cannot be verified by independent observers. Therefore, there is an urgent need for independent studies on the potential energy saving of such devices. The work undertaken in GRIP is intended to tackle this problem. After accomplishing the numerical uncertainty study and ESD design procedure evaluation in the early stage of the project, an actual ESD design case for the GRIP validation ship has been conducted by three partners resulting in three different ESDs: a Pre-swirl stator (PSS) by HSVA, a pre-duct by MARIN and a rudder bulb by VICUS. The selected GRIP validation ship is a newly-built handymax bulk carrier by partner Uljanik shipyard. This paper will outline the work HSVA has performed on the PSS design for this validation ship and the cross check results by HSVA for these three ESDs. The PSS designed by HSVA was selected to be installed on the bulk carrier and validation trials have been conducted without and with ESD accordingly, see Hasselaar and Xing-Kaeding [5].
Computational methods
The baseline of computational methods applied for ESD final evaluation in this paper is the state-of-the-art RANS method. Though it is possible to model the propeller in RANS directly, the propeller effect has been simulated through body forces as source terms in the RANS method for a quick evaluation of different ESD designs. The body forces are obtained from a BEM method, which is coupled iteratively to the RANS method to enable numerical self-propulsion simulations. The PSS design has also been initiated from the BEM optimisation process, taking advantage of the quick response time and low cost of BEM methods. The details of these methods are explained below.
RANS code description
The code that is mainly used by HSVA, FreSCo+, is a finite volume fluid flow solver developed in cooperation with the Institute of Fluid Dynamics and Ship Theory (FDS) of the Hamburg University of Technology (TUHH) and the Hamburg Ship Model Basin (HSVA). Emphasis is thereby placed on an important element of maritime problems, namely the prediction of the free surface flow around ships. This emphasis is expressed in the name FreSCo – Free Surface Computation.
The computational method in FreSCo+ is based on a finite-volume method and allows both structured-grid and unstructured-grid discretisation. FreSCo+’s mathematical model is essentially the Reynolds-averaged Navier–Stokes (RANS) equations, supplemented with a series of turbulence models based on the eddy viscosity concept and a treatment of multi-phase flows using the volume-of-fluid approach. The FreSCo+ code solves the incompressible, unsteady Navier–Stokes-equations (RANSE). The transport equations are discretized with the cell-centered finite volume method. Using a face-based approach, the method is applied to fully unstructured grids using arbitrary polyhedral cells or hanging nodes.
The governing equations are solved in a segregated manner, utilizing a volume-specific pressure correction scheme to satisfy the continuity equation, see Ferziger, J.H. and Peric, M. [3]. To avoid an odd-even decoupling of pressure and velocity, a third-order pressure smoothing is employed along a route outlined by Rhie & Chow [11]. The solution is iterated to convergence using a SIMPLE-type pressure-correction scheme. The fully-implicit algorithm is second order accurate in space and time. The approximation of the integrals is based on the mid-point rule. Diffusion terms are approximated using second-order central differences, whereas advective fluxes are approximated based on blends between high-order upwind-biased schemes (e.g. QUICK), first order upwind and second order central differences schemes. The latter are applied in scalar form by means of a deferred-correction approach.
Various turbulence-closure models are available with respect to statistical (RANS), such as k–ε (Standard, RNG, Chen), k–w (Standard, BSL, SST), Menter’s One Equation model and the Spalart-Allmaras turbulence model.
Propeller vortex lattice method QCM
The method implemented in the “QCM” code is a vortex lattice method (VLM). The blades of the propeller are reduced to lifting surfaces which account for camber and angle of attack. The lifting surfaces are built up by section mean lines. The thickness effect is accounted for by prescribed source densities on the lifting surfaces.
To calculate the load distribution on a lifting surface, a system of rectilinear vortices is introduced. This system is further divided into ‘bound’ vortices in span wise direction and ‘shed’ vortices in chord wise direction. This procedure can be considered as a special type of Boundary Element Method. The solution technique follows the standard procedure of boundary element methods in hydrodynamics: The prescribed normal component of the inflow velocity has to be compensated by the downwash due to the vortex system. Demanding this kinematic condition for a set of control points one gets a system of linear equations. From this system the strength of every rectilinear bound vortex is calculated. The system of vortices of known strength is now sufficient to derive the pressure and the forces on the blade surfaces. The typical vortex structure in the propeller wake in QCM is illustrated in Fig. 1.
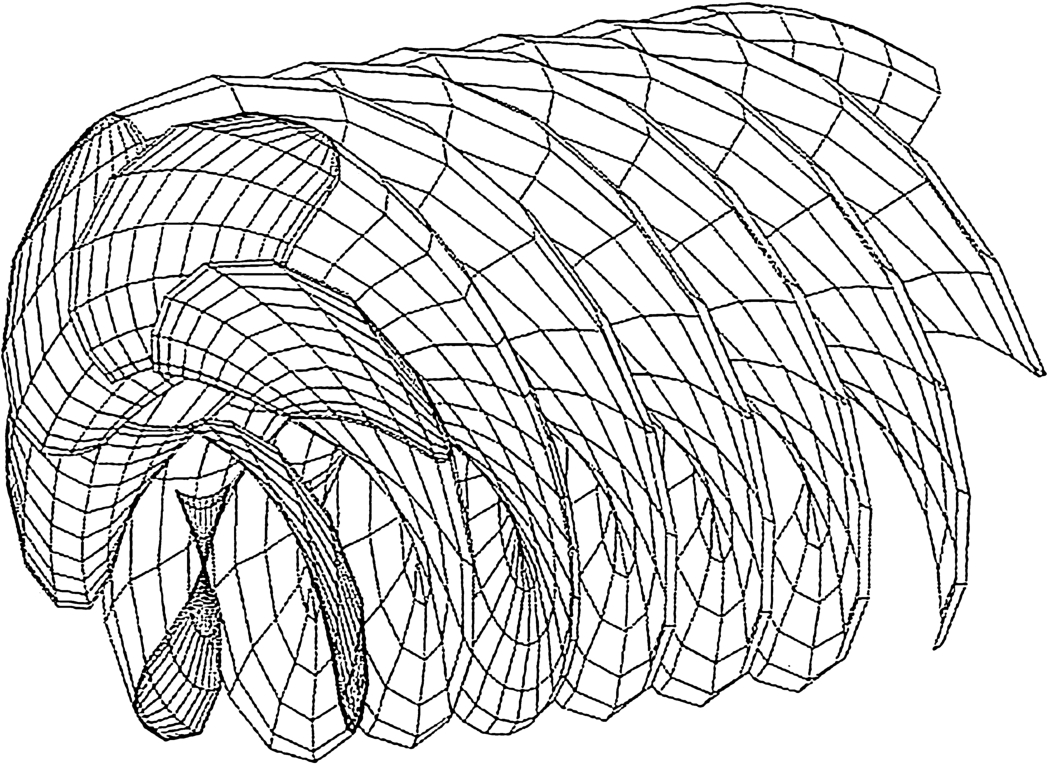
Vortex structure in the propeller wake in QCM for a typical propeller in a homogeneous inflow.
The current method is similar to the methods published by Kerwin and Lee [7], Greeley and Kerwin [4] and Nakamura [9]. The chord wise arrangement of corner-points of the vortex–lattice is set up by the ‘Cosine-Spacing’ as originally recommended by Lan [8]. The results for the loading distribution become identical with the exact solutions of the continuous theory for 2-dimensional thin profiles. Due to this property the method has been named ‘Quasy-Continuous Method’ (QCM). By using QCM, Nakamura [9] calculated open water characteristics of various propellers that were in good agreement with experimental results, and established a method for estimating open-water characteristics of unconventional propellers, e.g. contra-rotating, controllable pitch and tandem propellers. Chao and Streckwall [2] have compared the calculations with other theoretical methods and measurements, also showing a good agreement.
QCM can be used to compute the propeller flow under both steady and unsteady inflow condition. There is however no interaction between the inflow and the propeller forces computed in QCM. The inflow used as input for the QCM calculations remains therefore the nominal wake. The drawback of the method is that the flow is considered as potential flow and the modelling of the propeller hub is critical. Viscous effects on the drag of the propeller blades are treated in QCM via empirical corrections based on the 2D profile viscous resistance. Good results can be obtained at the propeller design point. In case of large oblique inflow angles to the propeller however, larger errors are expected since the free vortex transport direction in the propeller wake is aligned with the propeller shaft without consideration of the actual inflow direction.
The ESD design work by HSVA presented in this paper has been performed using a double body (DB) RANS-QCM coupling approach to simulate a numerical propulsion test. Since it is assumed that the effect of the free surface deformation on ESD performance is negligible, the double body assumption has been applied together with an additional force (explained later again) which represents the missing wave resistance to get the appropriate propeller working condition. To this end the code FreSCo+ is coupled with QCM for propeller analysis in an iterative fashion as outlined in Fig. 2.
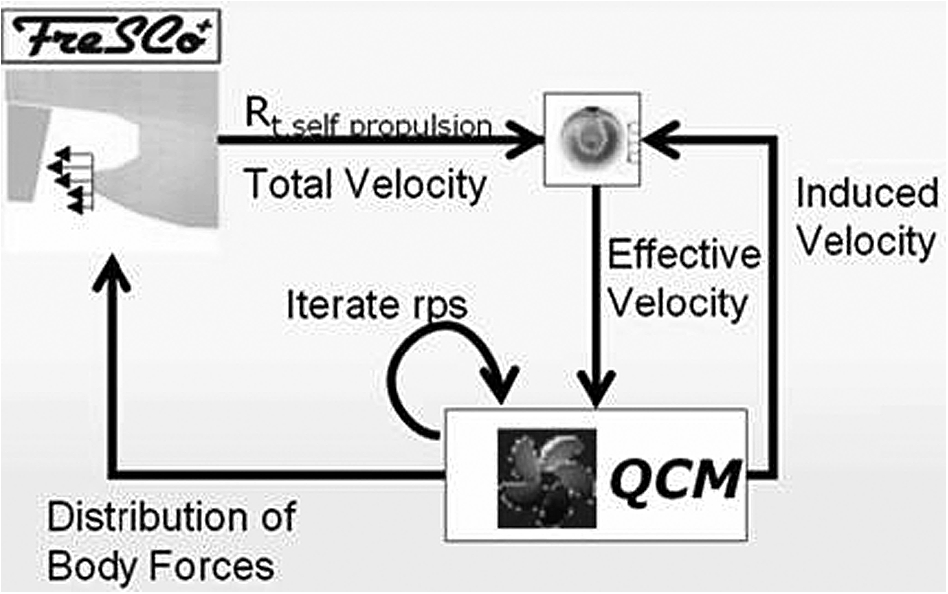
Numerical propulsion test scheme.
At the start of the simulation, a nominal wake distribution is extracted from the converged RANS solution without the propeller effect. This velocity distribution and an estimated turning rate are used as an input for the QCM code to compute the propeller thrust and torque. The turning rate is adjusted until the propeller thrust required to overcome the ship resistance (in propulsion mode) is obtained. The hydro-dynamic forces of the propeller are converted in the form of 3D body forces (source term) assigned to cells which are representing the propeller disk.
The resulting distribution of the body forces is used as an input to a next RANS calculation loop. The RANS computation is continued in the next iteration cycle and a new total velocity field is created. The propeller induced velocities of the previous cycle, which are an output of the QCM code, are subtracted from the total velocity field. The resulting effective wake distribution is used as input in the subsequent QCM calculation. The iteration is repeated until the equilibrium between the resistance of the ship under self-propulsion condition and the propeller thrust is reached.
The PSS design has been started using a BEM method. This method represents a conversion of the propeller analysis program ‘PPB’. The conversion work profited from the similarity of stator fins and propeller blades. The potential based BEM propeller code PPB is described in [12]. It reflects the true outer surface of the blades using surface panels for discretization. In general the potential based approach is a suitable interpretation of Greens’ identity. Applying this identity one obtains an equation for the flow potential disturbance
ESD hydrodynamic design and optimisation procedure
The design procedure of the Pre-Swirl Stator by HSVA is made of four main steps, as illustrated in Fig. 3:
RANS computation to obtain the wake field at the pre-selected PSS positions. BEM optimisation to obtain the optimal twist and camber of the PSS. Creation of parametric models for ESD. RANS Self-Propulsion computations/optimisations to evaluate the PSS design.
In the following, each step will be explained in detail.
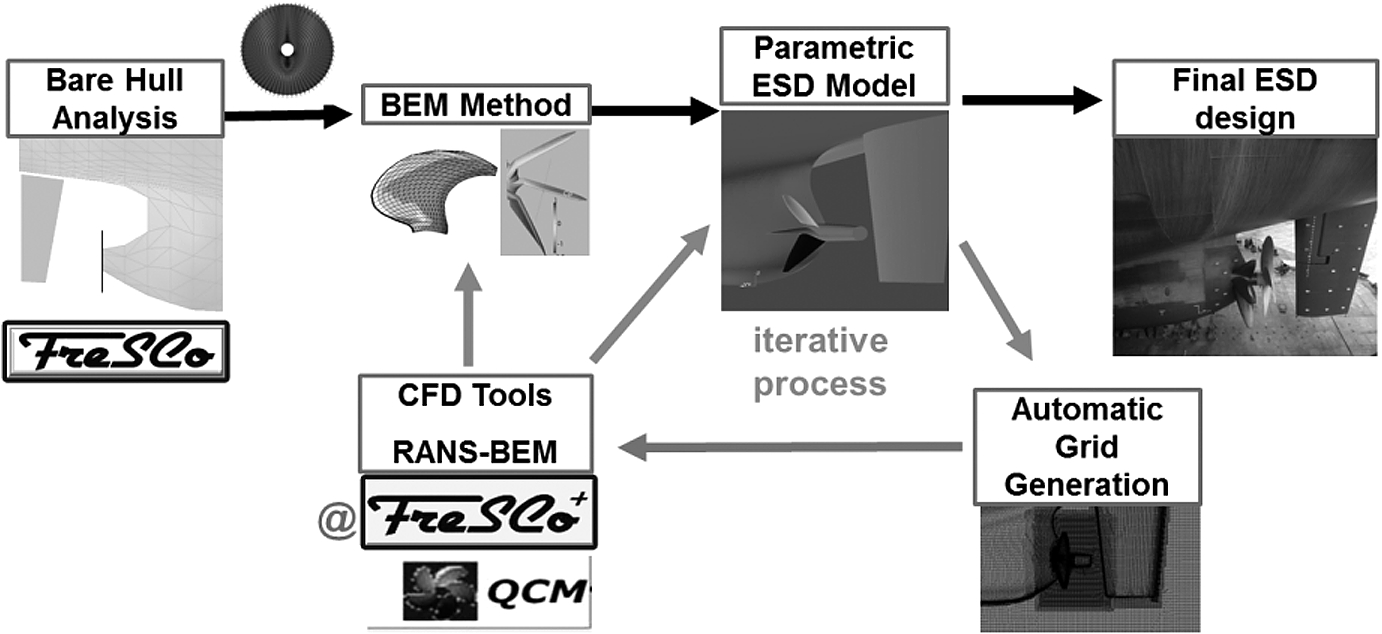
ESD design and optimisation procedure at HSVA.
The double body resistance computation without propeller effect is computed first for the case without ESD. The result of this simulation gives a first estimation on the possible effect of adding a pre-swirl device onto the hull.
It is well known that for a right-hand single-screw ship the propeller rotates in the same direction on the port side as the inward directed tangential component of the inflow; This wake velocity reduces the effective tangential inflow velocity on the blade section resulting in a so-called propeller slip loss (effectively a reduction of rotation rate) that leads to lower thrust on the port side and increases the overall inhomogeneity for the accelerated flow behind the propeller. The tangential velocity component in the wake on the port side is especially dominant for high block coefficient ships such as tankers or bulkers; by reducing this tangential velocity or even changing its direction from positive to negative through installation of a pre-swirl device, a positive effect in propeller performance could be expected. Such an example is shown in Fig. 4.
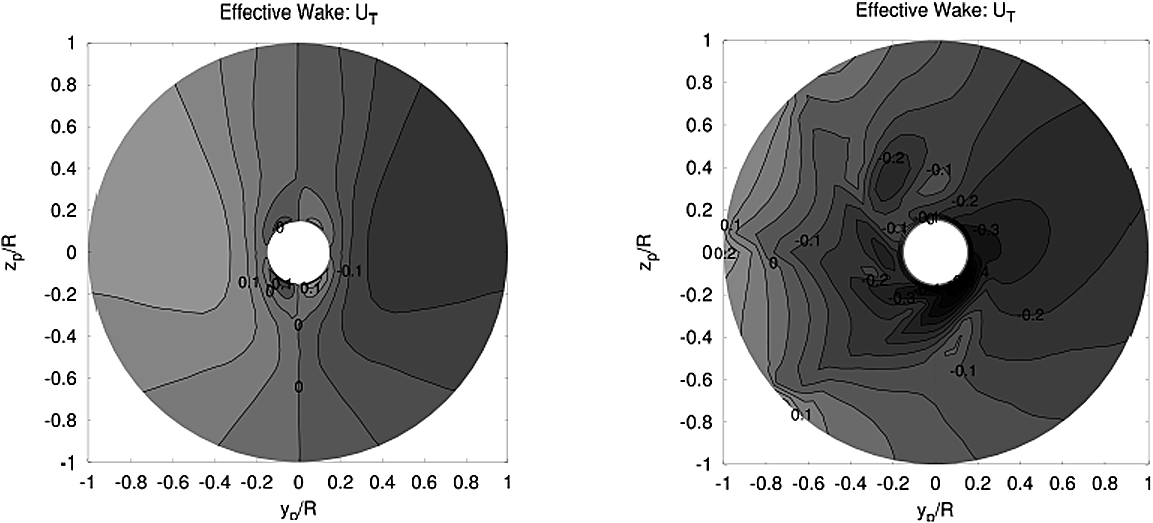
The nominal tangential wake of a bulk carrier: without ESD (left) and with a PSS (right).
After the resistance computation converges, the so-called numerical propulsion computation can be run either in self-propulsion mode or with a given thrust or rpm of the propeller at an appropriate propeller working point. The requested wake fields for further optimisation of PSS in BEM can then be obtained at different pre-defined positions.
The BEM optimisation of a PSS starts with a BEM-analysis of the propeller. In this case the in-house propeller analysis program ‘PPB’ has been used. This method represents a ‘real’ boundary element approach for the blades. In this respect it is consistent with the approach applied next for the stator fins.
The propeller analysis is done for the full scale wake calculated earlier within a RANS resistance computation without ESD. The circumferential averaged propeller blade circulation is the main target of these propeller calculations. From this blade circulation we derive a shape function which is to be met later by the fins’ circulation.
The BEM approach applied to the upstream fins needs an input flow field which may be called the ‘total’ wake as it includes the propeller induced flow. It also includes the displacements from the stern bulb or any other environment present at the fins’ plane. Accordingly the panel system introduced adjacent to the fins reflects just an idealized hub area where the roots of the fins are mounted. The inflow information is taken from the bare hull propulsion simulations described in previous section.
The fins’ prescribed geometrical data are usually outline, thickness and section type. Other data like camber and angle of attack are modified parameters. Ideally the fins’ circulations individually have to meet the above mentioned shape function derived from the propeller analysis. It has however to be kept in mind that the flow around the fins should be ‘sound’ which is checked via the BEM results for the fins’ surface pressure. A flat suction side pressure distribution is envisaged.
Such derived fins should provide the most reasonable changes to the tangential flow at the propeller as illustrated in Fig. 4, so that rotational losses at the propeller and load variations of the propeller blade are best compensated. However, a sound evaluation of the PSS designs is not possible within BEM method, the further confirmation computations in RANS are necessary for the final adjustment of the improvements due to the PSS designs.
Parametric model of ESD
The parametric models of ESDs applied in this work are generated using the CAD and optimisation software FRIENDSHIP-Framework. The ESD parametric models were built up using typical geometrical parameters, such as section profile, angle of attack, extrusion path and scaling of chord etc. Each of these parameters can be selected as design variable, as explained below.
Section profile
A NACA 4 digit cambered profile, as shown in Fig. 5, has been pre-defined for the PSS design presented in this paper to keep the number of parameters low. The profile should, however, be closed at the trailing edge so that the final model of the ESD forms a water-tight solid for meshing in CFD. In principle, the profile type can also be changed during the optimization process. Nevertheless, the profile type needs to comply with the structural requirements.

NACA 4-digit as example cambered profile curve.
The extrusion path can be a straight line, a curve, a B-spline, etc. The tangent of the extrusion path is used to define the normal plane for the corresponding section, see Fig. 6.
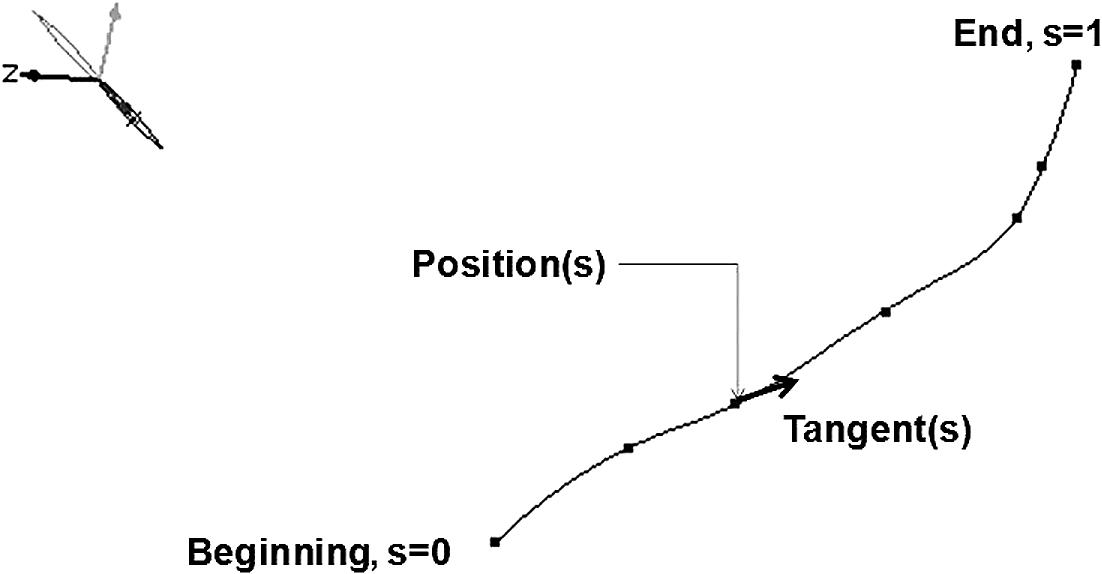
An example of the extruding path.
Together with an available local flow vector, the section of PSS can be adjusted according to the local flow direction so that a certain nominal angle of attack can be locally compensated. Figure 7 shows an example of the local flow vector along the extrusion path. The velocity input is made up of three separate curves, one for each of the global directions, u-, v- and w- components for the local flow. These separate curves can be directly obtained at the desired positions from the RANS computational results, e.g. on positions where the leading edge of the PSS should be. These are used along with the tangent vector to the extrusion path to derive the plane for rotating and translating the section profile, see Fig. 8 for an illustration of the transformation matrix. Figure 9 shows the resulted sections along the extrusion path by varying angle of attack.
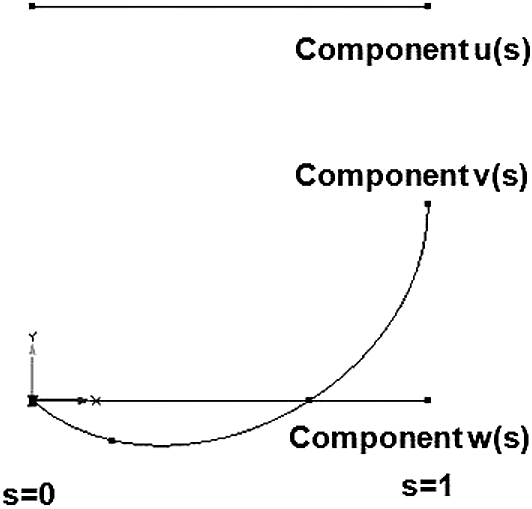
An example of the velocity profile.
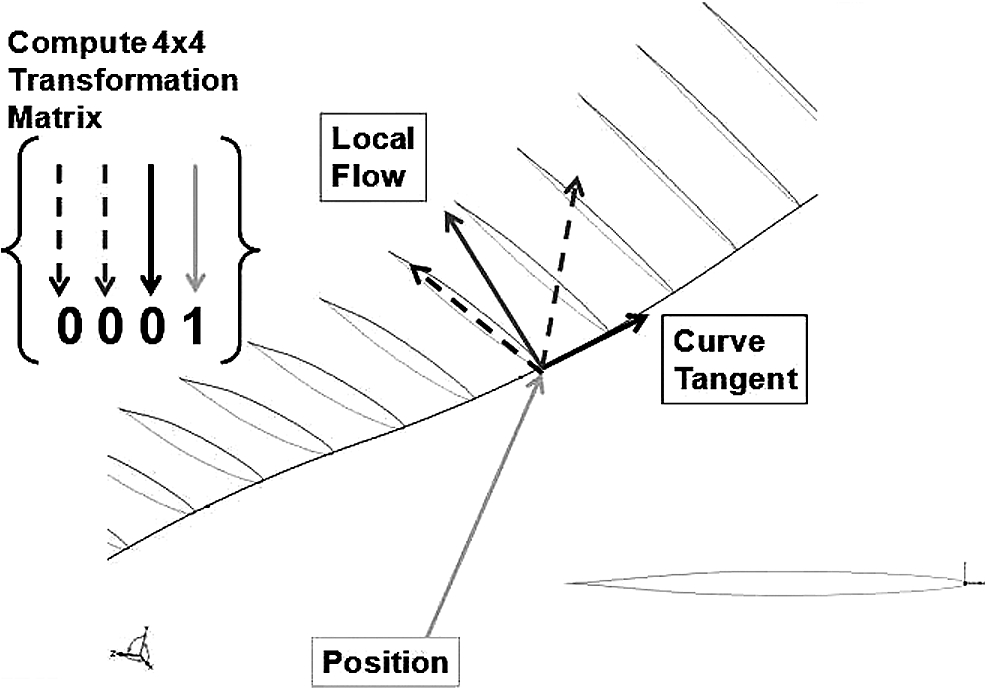
Transformation matrix at each section.

Varying angle of attack for successive sections.
Each section of ESD can be scaled with one further parameter, called scaling curve along extrusion path. Figure 10 shows the resulting ESD forms using different scaling curves: uniform/constant scale on the left, tip-scaling with the leading edge unchanged in the middle and tip-scaling with the mid-chord line unchanged on the right.
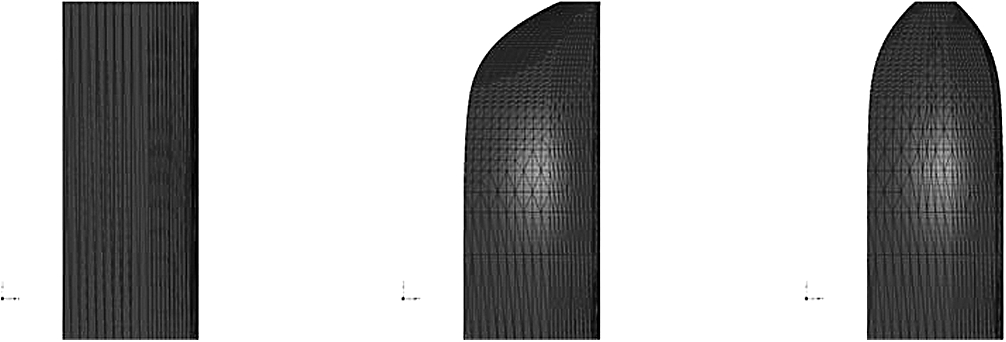
Uniform, constant scale (left), Tip-Scaling: profile nose as basis (middle), mid-chord as basis (right).
The output from the afore-mentioned features is a watertight, triangulated solid geometry. Figure 11 shows such an example using all parameters described above. This geometry may then be combined with a ship and the general computational boundaries, usually a rectangular box, to create the final description of the entire computational domain. This domain is then exported for the subsequent mesh generation stage.
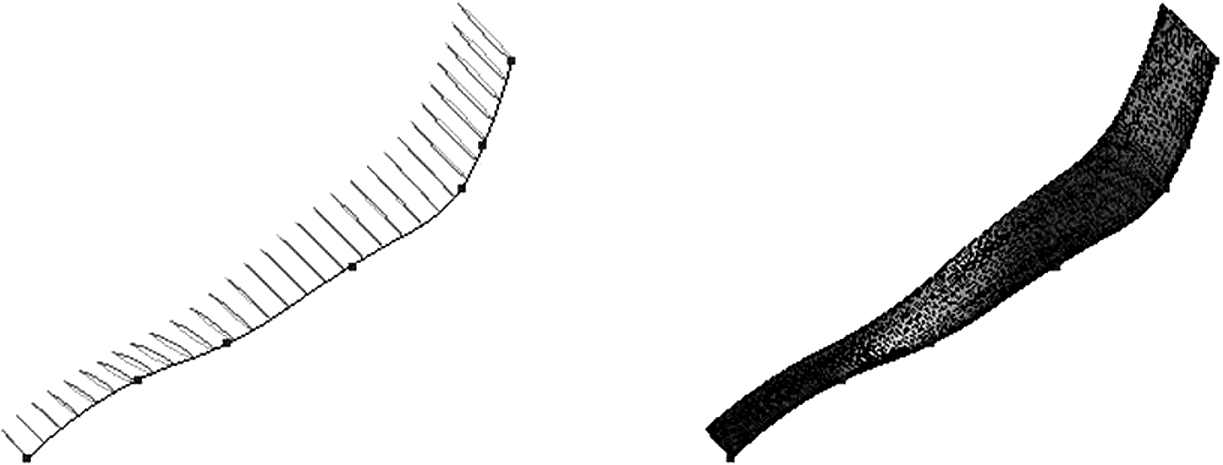
Many sections along extrusion path (left), lofted surface (right).
Generally, an algorithm is needed to evaluate different ESD designs and compare them with the bare hull case without an ESD. The most direct way to do this is to compare the predicted delivered power at the self-propulsion conditions for ship without and with one or more ESDs installed. Since most of the computations are performed by HSVA in self-propulsion conditions, this direct way has mainly been employed to evaluate the performance of different designs. The less direct ways of judging different designs are to compare flow quantities/variables, such as changes in resistance on the hull, resistance/thrust on the ESD, propeller performance/efficiency, rotational/total energy behind the ship etc. The indirect way has certain risks that some of the effects brought by the ESD could possibly be overweighed against other effects, so that the comparison might not be fair for all the designs.
Power analyses procedures
Since double body computations have been performed, we need to apply a certain force on the hull to correctly evaluate the ESD performance. This force balances the system and the propeller working under a proper/reasonable loading corresponding to the most likely operational condition of the propeller. If the computations are performed in full scale, this force would represent the wave resistance, the air resistance and resistance due to hull roughness. When the computations are performed in model scale, the additional force would furthermore include the frictional force due to scale effect.
As stated before, this additional force is only necessary to obtain a proper/reasonable propeller loading in the coupled analysis. It is also expected that the performance of the ESD should not vary significantly when the propeller loading changes slightly.
There are different ways of estimating this force. One of them is introduced below: If the propeller design rpm is known previously, it can be taken to perform a propulsion computation using the fixed rpm for the base case without an ESD. Then this force can be derived from this expression:
Then the same force can be applied to all the following self-propulsion computations with ESDs. In this way, the ESD designs can be compared to each other and also to the case without an ESD. If some power gain can be observed at the propeller, it means that the ESD design would indeed save some energy. Normally, the higher the power gain ratio observed; the better the designs are.
Performance analyses procedures
We could consider each pre-stream device (pre-duct or pre-swirl stator) which is attached to the hull as a wake improvement device. The effect of the ESD would be similar as getting an optimal aft-hull in this sense. The wake behind the ship can basically be improved in two ways: to accelerate the axial flow where it is too slow or to transform the tangential flow where it is unfavourable making the propeller work more optimally and homogeneously. The objective of a pre-swirl stator would be the latter, producing the pre-swirl where it is needed to make the propeller loading more homogeneous and to minimize the rotational losses in the slipstream while keeping the axial wake largely unchanged. Further details about the working principle of the PSS can be found in Streckwall and Xing-Kaeding [13].
To achieve an overall gain, the propeller performance efficiency behind the ship must be increased with a mounted ESD, which can be calculated using
The increase of
This equation can well explain the difficulty in designing an effective ESD to the hull: an ESD should in principle increase the overall hydrodynamic efficiency with
Flow analyses procedures
When adding the propeller effect, the flow behind the propeller can be analysed. Propulsion losses can be read from the slipstream behind the propeller, in terms of the kinetic energy losses. The kinetic energy of the fluid within a cylinder volume of unit length in the propeller slipstream (behind the propeller) may be expressed as:
Alternatively to the overall kinetic energy, one can also concentrate on the rotational energy loss if the ESD is designed mainly with the intention of reducing the rotational energy losses. The rotational energy due to the tangential flow can be simply computed using the following formula:
The design goal of an ESD, which is intended to reduce the rotational energy in the propeller slipstream, can now be defined by minimizing the rotational energy in a defined volume behind the propeller. This can be written as:
This flow quantity can be either used to analyse the computed CFD results with different ESD variations or further developed as an objective function for the optimisation process.
In general, the power analysis procedure should be treated as top level criteria for selecting the best ESD design. The performance analysis helps, however, to understand why the ESD has saved the energy. The flow analysis follows the energy conservation principle and gives much more insight in the changes in the flow regime itself and can also be used as a direct object function when the optimisation employing the adjoint flow solver is intended. The different analysis approaches, however, should basically give the same trend in energy savings of the investigated ESDs.
Bulk carrier design case
As explained in the introduction, a bulk carrier designed and built by Uljanik shipyard has been selected for full scale validation. This offers a unique opportunity for the project’s CFD partners to not only be involved in the competitive design process but also experience the actual installation and full scale testing process.
Three CFD partners – MARIN, VICUS and HSVA – decided to participate in this design competition to design an ESD for the ship. At the beginning of the design process, each partner selected one ESD type, for which experience could already be gathered in the earlier period of the project; accordingly the selected ESD types by partner HSVA, MARIN and VICUS are PSS, pre-duct and rudder bulb, respectively.
Since the schedule for this validation ship was very tight (determined by the trial plan) the actual hydrodynamic design period was less than 6 weeks, which corresponds to a realistic retrofit project. Once the deadline was reached, the designs were submitted by all the partners. Next, the designs made by different partners were evaluated through cross-checks performed by all partners to minimize the influence of different computations and codes on the ranking of the ESDs.
The finally selected ESD was the PSS designed by HSVA, which showed the best performance at improved cavitation behaviour and passed also the structural and final assembly checks successfully, see Antonissen and Goorden [1], Paboeuf and Cassez [10] and Huebler et al. [6] respectively; it was therefore selected by the GRIP Consortium as the ESD for the full scale validation trails. In this paper, the concept design of the finally selected PSS is introduced below together with the cross check results performed for other ESD designs.
The ship and design condition
The selected full scale validation ship is the ship named “VALOVINE”, a newly built Bulk Carrier by project partner Uljanik shipyard. Figure 12 shows a photograph of this ship. Its main dimensions are listed in Table 1. The engine data is given in Table 2. The particulars and characteristics of the FP propeller are given in Table 3. The main design condition of this ship has been defined at the design speed of 15 knots at the design draught by the Uljanik yard with the propeller revolution of 123 rpm. The dynamic trim and sinkage has been computed using a potential code RAPID for this case, which is given Table 4.
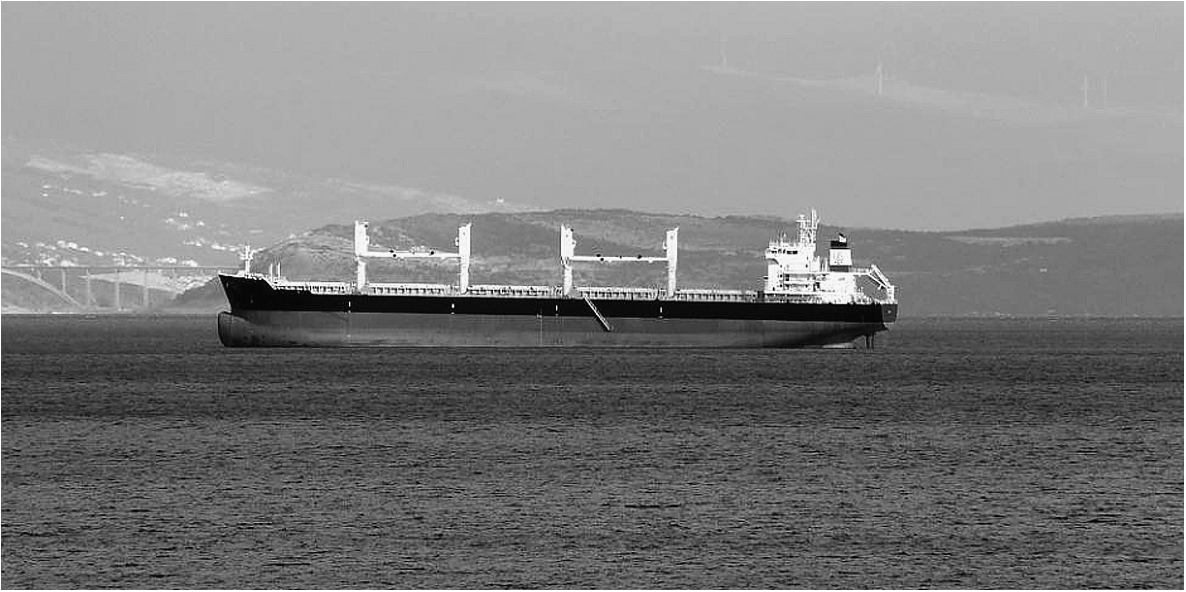
Picture of the bulk carrier “VALOVINE”.
Ship main dimension and coefficients of Uljanik Bulk Carrier
The engine data of the Uljanik Bulk Carrier
The propeller particulars and characteristics
Dynamic trim and sinkage for design condition
Following the design procedure described earlier, HSVA has carried out the pre-swirl stator design and optimisation for the GRIP validation bulk carrier. In the following, the computational aspects, PSS designs and their evaluations during the concept design phase will be discussed.
Numerical settings
The double body numerical grids for the cases without and with PSS have about 7.6 M cells and 10.8 M cells, respectively. For cases without and with ESD, the same refinement has been applied to minimize the effects of the grid resolution on the evaluation of an ESD. The numerical grid with PSS is shown in Fig. 13. The boundary conditions and domain sizes are illustrated in Fig. 14. The k–w SST turbulence model has been used and wall functions have been applied to the hull, rudder and ESD in the simulations.
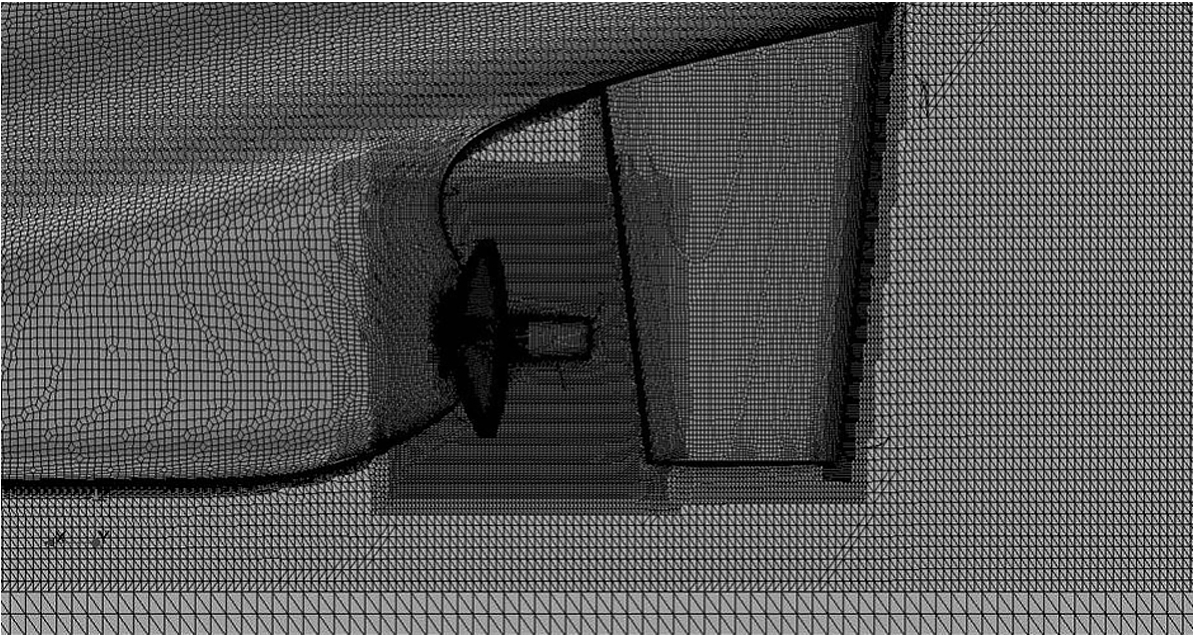
Numerical grids for Uljanik Bulker with PSS (c.a. 10.8 Mil. cells).
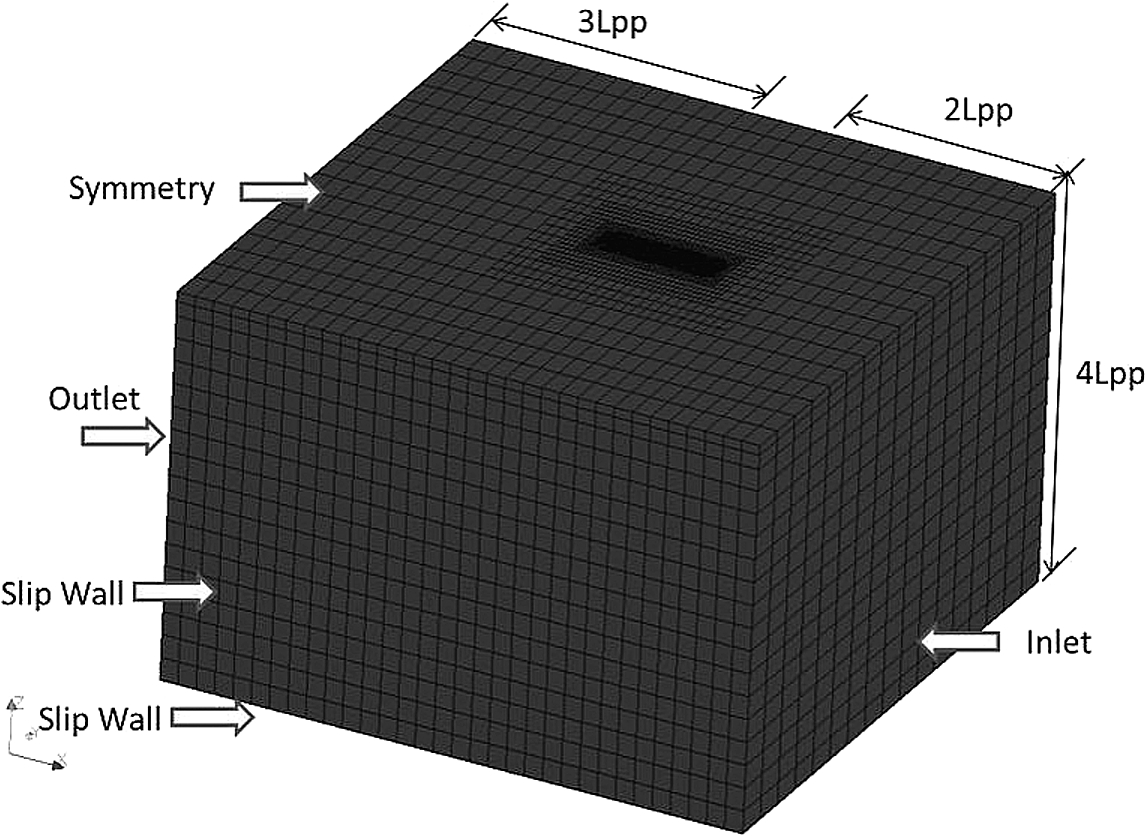
Boundary conditions for the DB simulations of Uljanik Bulker with and without an ESD.
As the first step, BEM analysis for the propeller alone has been performed to obtain the circumferential averaged propeller blade circulation. Since it is not clear how many stator fins would actually be optimal to produce enough pre-swirl for the propeller while simultaneously not largely increasing the required thrust (this would probably diminish the gain in propeller performance), two versions were considered: three stators on the port side with (V01) and without (V02) starboard stator blade.
The example of resulting normalized circulation of the fins over span can be seen in Fig. 15 for PSS V01 in comparison with time average circulation at one propeller blade. Figure 16 shows the geometry of PSS V01 with three port stators and one starboard stator, whereas the PSS V02 with three port stators only is shown in Fig. 17. The only difference between these two versions is the number of stator blades. The subsequent RANS evaluations showed that the PSS V02 performs better in this case. After observing a relatively large tip vortex on the stator fins in the RANS computations, the tips have been rounded off, which resulted in PSS V03, shown in Fig. 18. This version has also been distributed among partners for cross-checks.
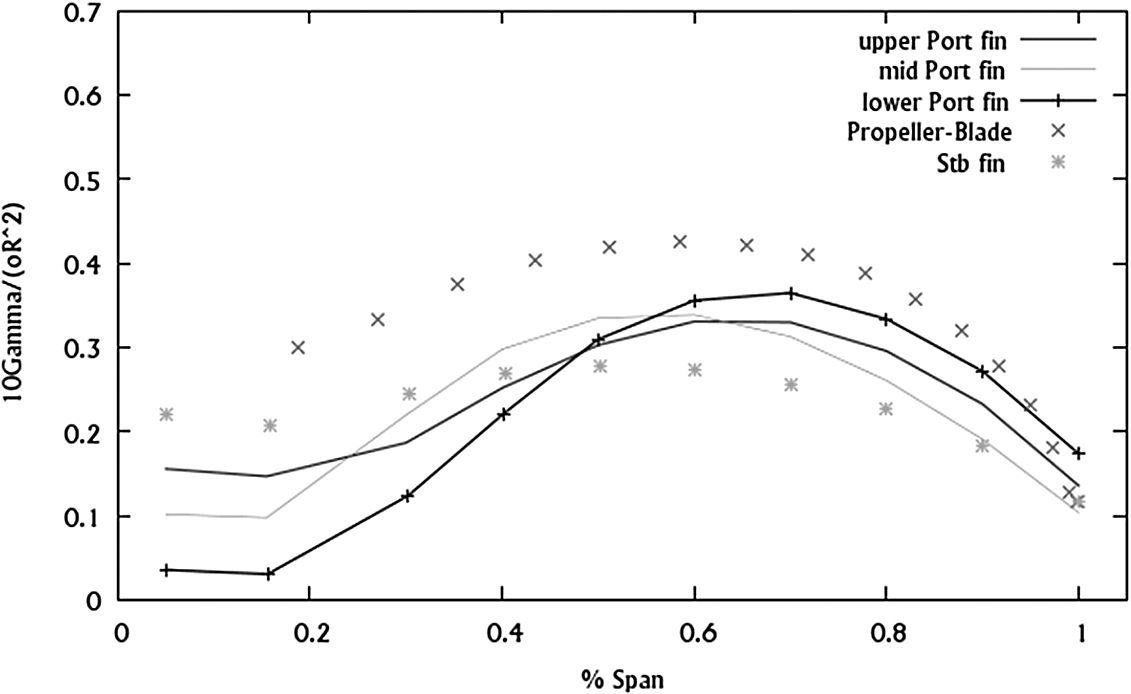
Normalized circulation at stator fins (V01) plotted over span in comparison with time mean circulation at one propeller blade (plotted over radius).
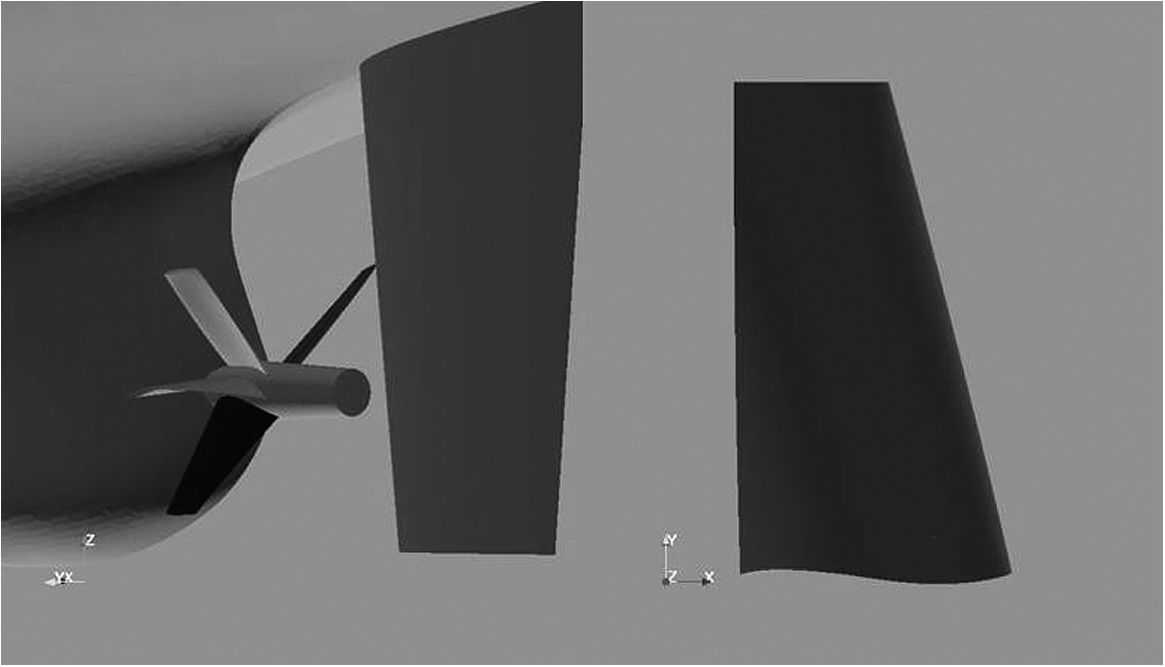
PSS V01 with three port fins and one starboard fin (left) and side view of the fin (right).
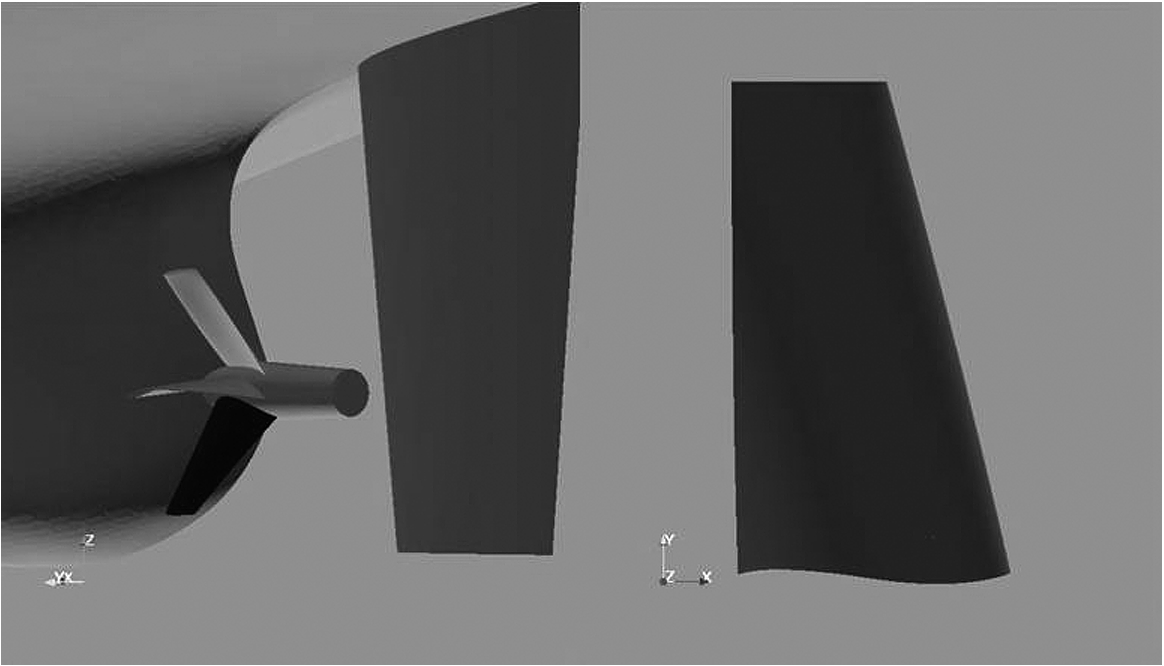
PSS V02 with three port fins only (left) and side view of the fin (right).
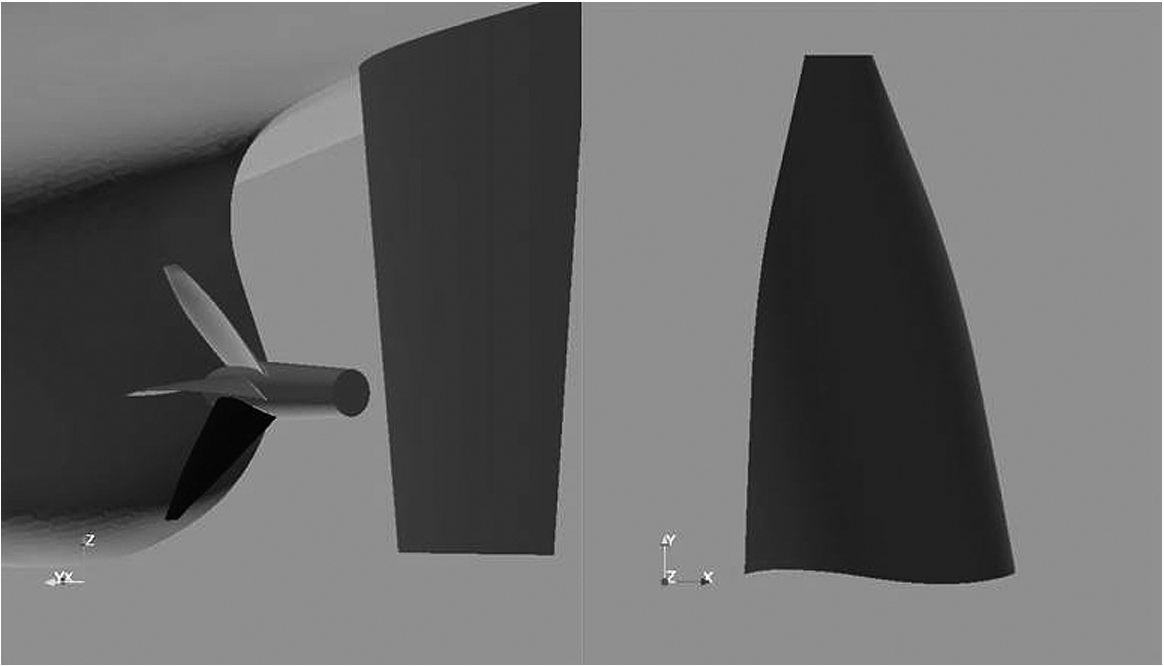
PSS V03 with three port fins only and rounded fin tips (distributed around partners) (left) and side view of the fin (right).
During the construction design phase of PSS, it was required to move the root sections of the PSS about 30 cm forward due to structural reasons. There was little time left before the PSS should be actually built so that it was not possible to induce a new PSS design process. This problem has been solved by introducing some rake to the stator fins so that the sections at higher radii are still experiencing the similar flow field as before. Thanks to the parametric model of the PSS, this change can be easily implemented and evaluated in RANS. This paper will only concentrate on the design aspects and results up to the concept design phase; whereas the validation results related to full scale prediction of PSS final design can be found in Hasselaar and Xing-Kaeding [5].
Before the propulsion computations have been performed, the DB resistance computations have been conducted first for the base case without ESD, which has been compared among partners to ensure that no large errors have been induced at this stage. Upon converged resistance computations, propulsion computations have been further conducted using the RANS-QCM coupling method. The first propulsion computation for the bare hull without ESD has been performed using a constant propeller design rpm, from which the unbalanced force (incl. wave resistance etc.) has been derived. This force has been applied to all the following computations with mounted ESD to make a fair comparison of the energy saving ratios of the different ESD versions.
The self-propulsion computations reflect the change in power requirement due to each ESD directly, which is the top level criterion for the selection of the ESD designs. Figure 19 shows the history of predicted power requirements of PSS design variants in comparison with the bare hull case without ESD. As can be seen, the power requirement has been reduced step by step and the last version is the best design in this case.
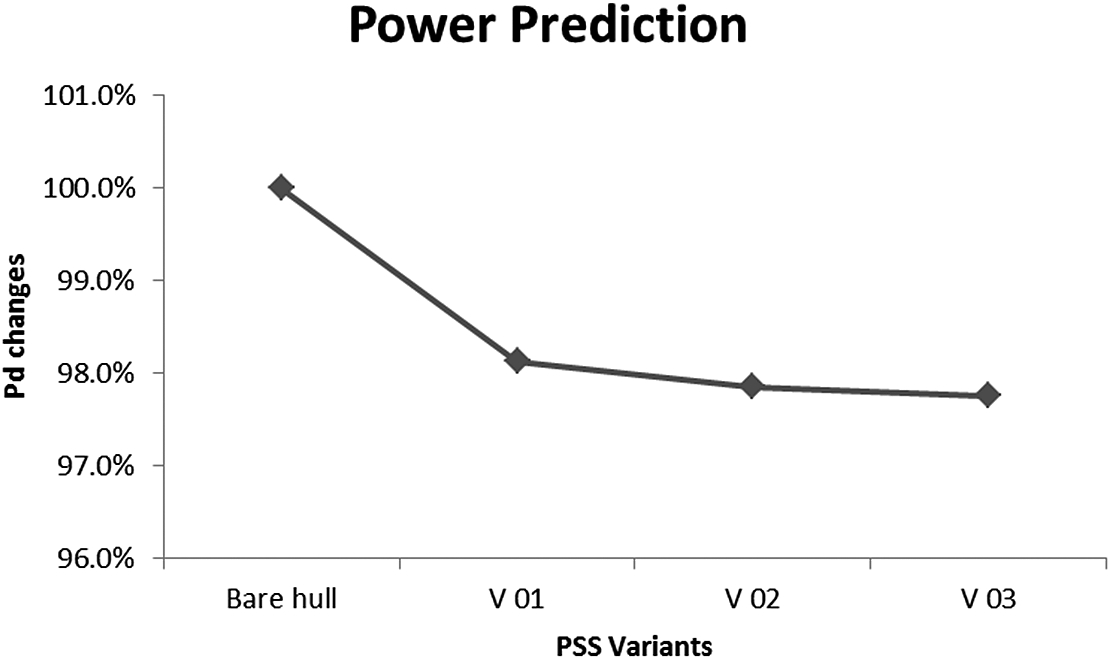
Power gain predictions of the PSS variants.
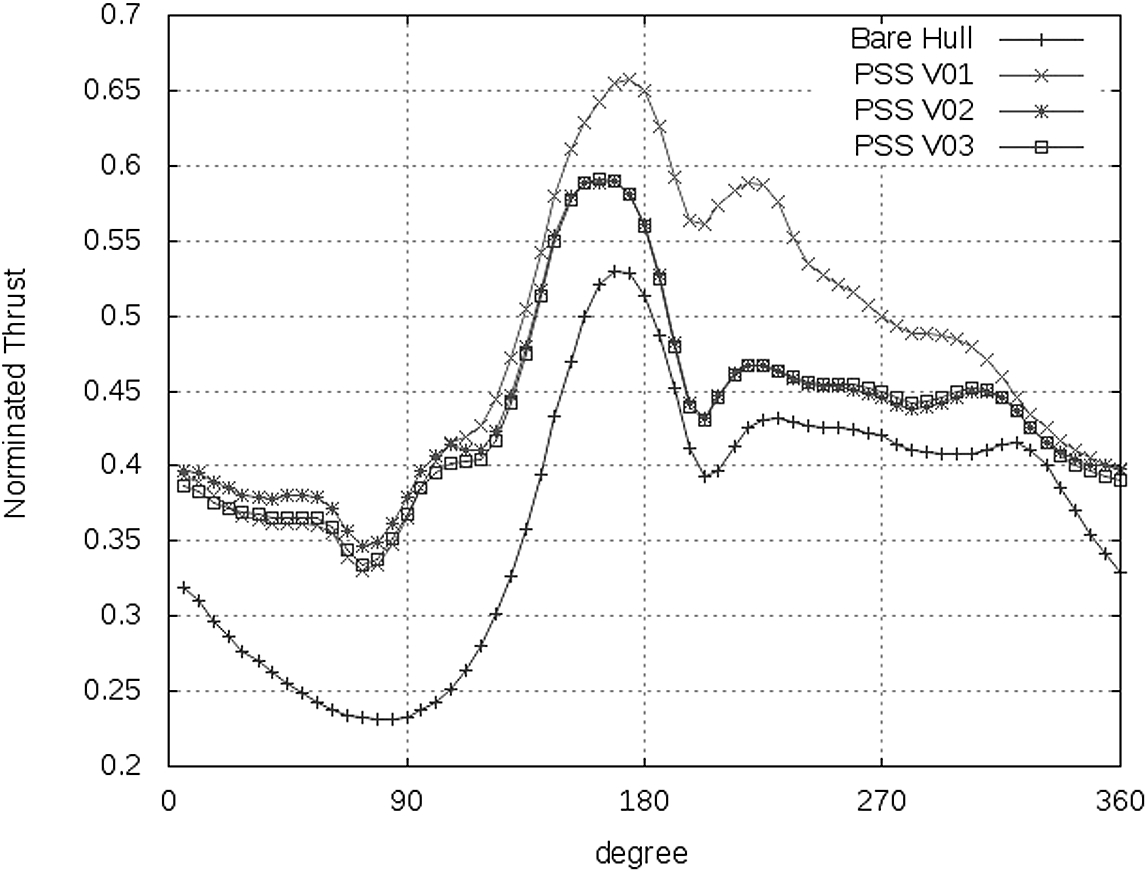
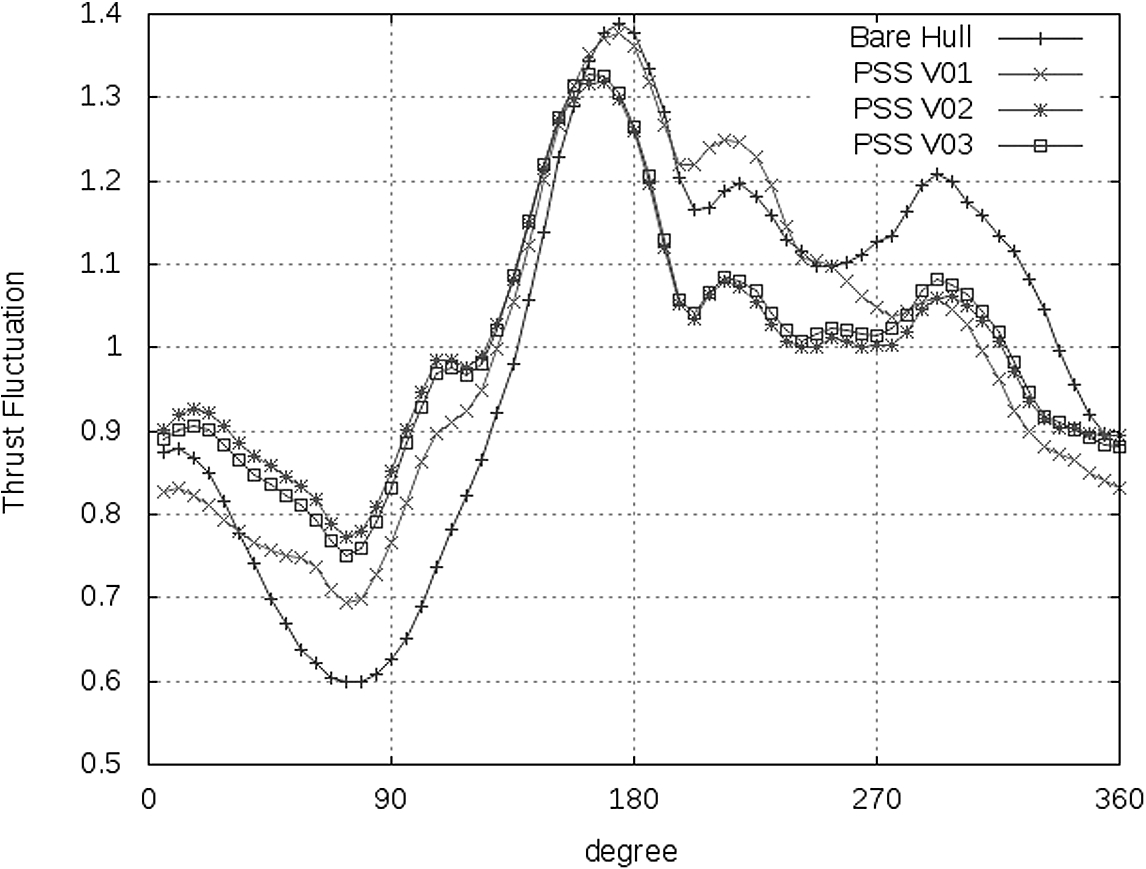
To understand why the PSS has actually saved power, a detailed look into flow quantities is necessary. In Fig. 20, the computed effective wakes, resulting from the RANS-QCM coupling, are compared between the cases without ESD and with the PSS. The corresponding propeller thrust loading distributions are given in Fig. 21. An interesting observation can be made from the relative tangential velocity, which has been computed taking into account the propeller blade rotation. One can see that these distributions give some indications about where the propeller is actually encountering a positive tangential velocity, which would mean the flow is running with the blades. In these regions also the light loading of the propeller can be observed as can be seen in the thrust loading distribution. Also it can be seen from changes in tangential flow due to PSS (Fig. 22) that the PSS has not only improved the propeller inflow on the port side, but also the starboard side experiences an increased tangential flow which resulted in a higher propeller loading. The comparison of blade thrust in circumferential direction (Fig. 23) between cases without ESD and with PSS variants confirms this conclusion and the comparison on thrust fluctuation along circumferential direction (Fig. 24) indicates a more homogeneously loaded propeller when the PSS (especially the PSS V02 or V03) is installed.
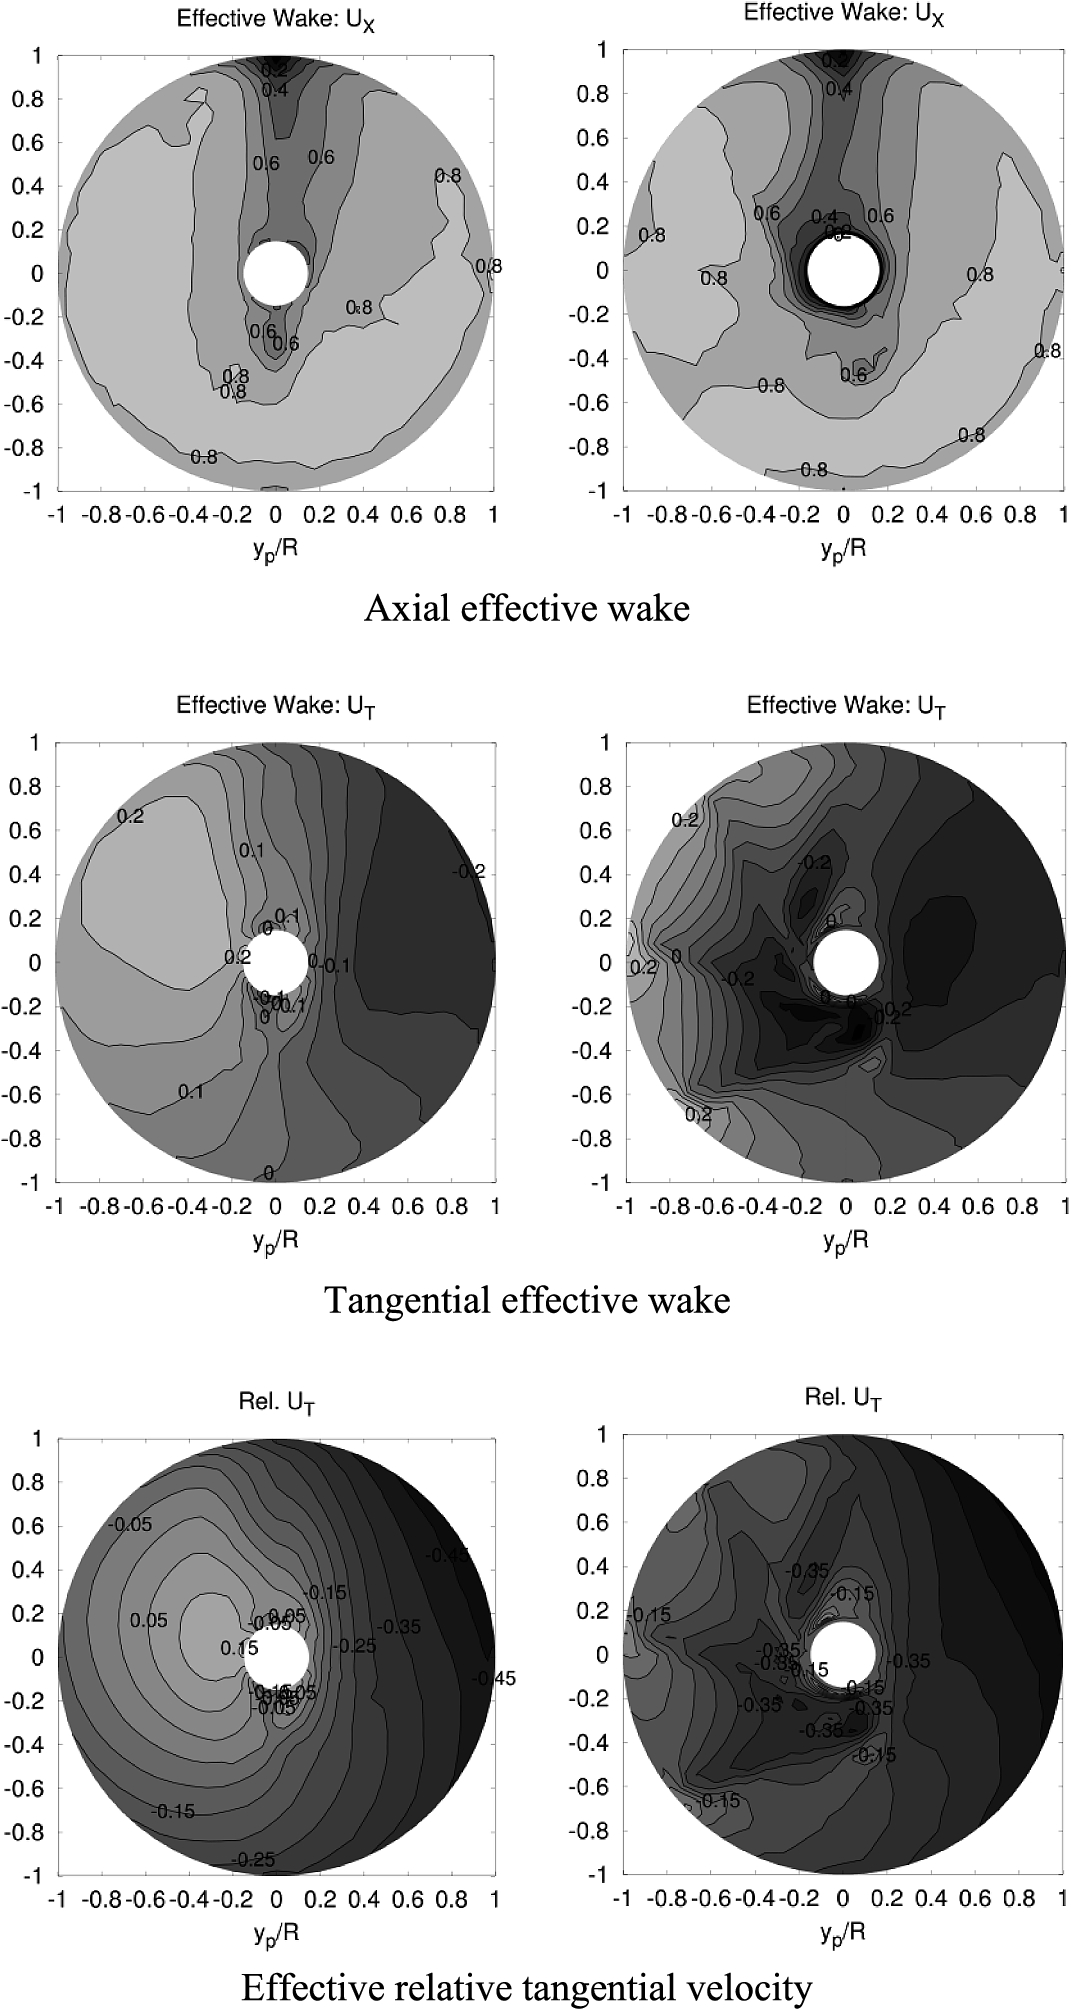
Comparison between bare hull without ESD (left) and PSS V03 (right) (from top to bottom): effective axial wake, effective tangential wake, effective relative tangential velocity.
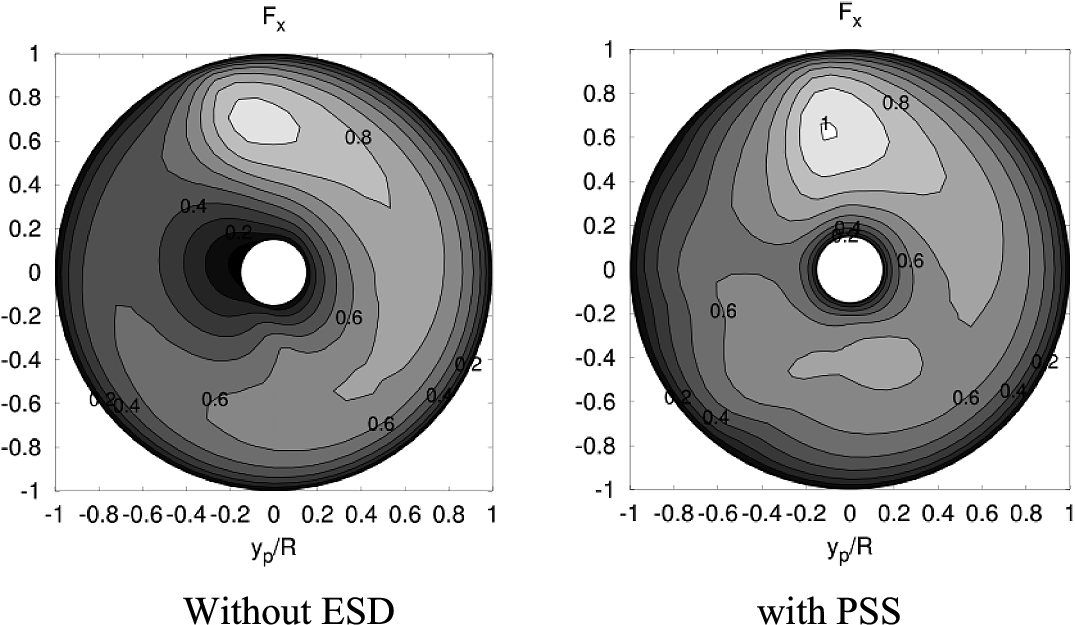
Comparison of propeller thrust loading distribution.
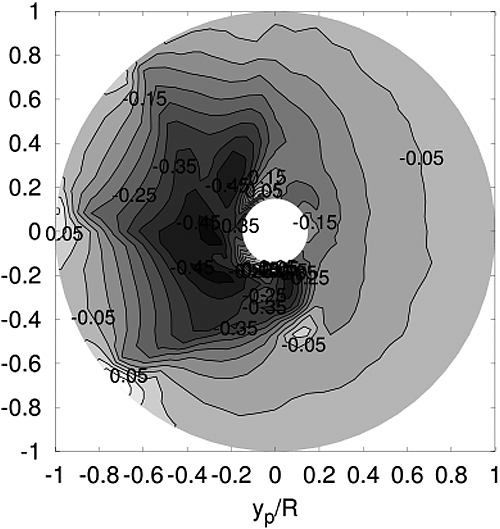
The changes of the tangential wake due to PSS.
Comparison of propeller blade thrust in circumferential direction.
Comparison of propeller thrust fluctuation in circumferential direction.
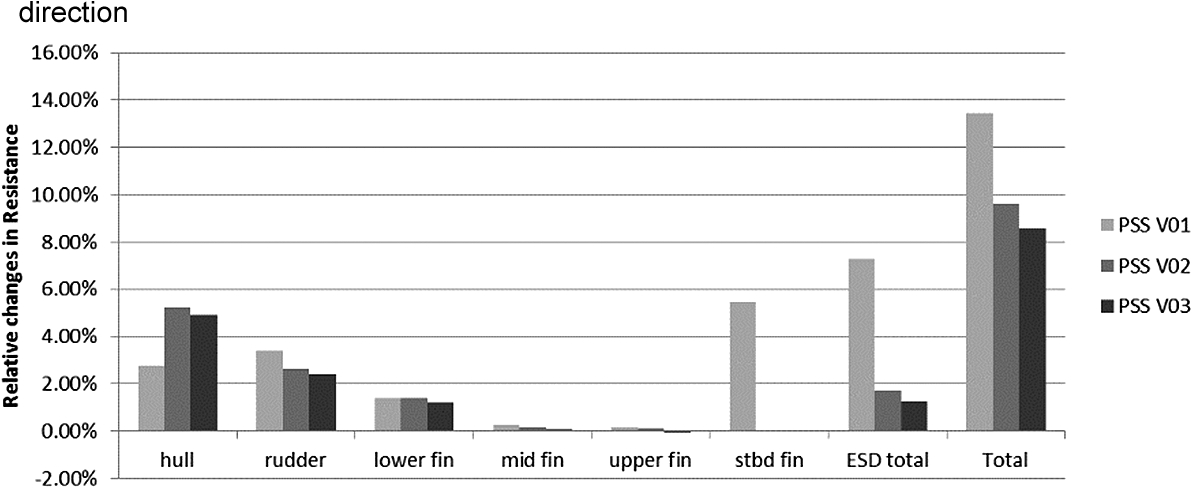
The more detailed force analysis (Fig. 25) gives some clue why the PSS V01 does not perform very well. Though the smallest resistance on the hull can be observed among the PSS designs for PSS V01, the rudder resistance has been increased due to a too high degree of pre-swirl induced, which resulted in attenuating the post-swirl effect of the rudder. Also the starboard fin itself experiences a higher resistance, therefore in the later design phase the starboard fin blade has been omitted. Only the upper fin of V03 is actually producing a small thrust, but all PSS variants in total are producing additional resistance, which means they increase the thrust requirement.
Relative changes in Resistance of PSS designs comparing to the bare hull.
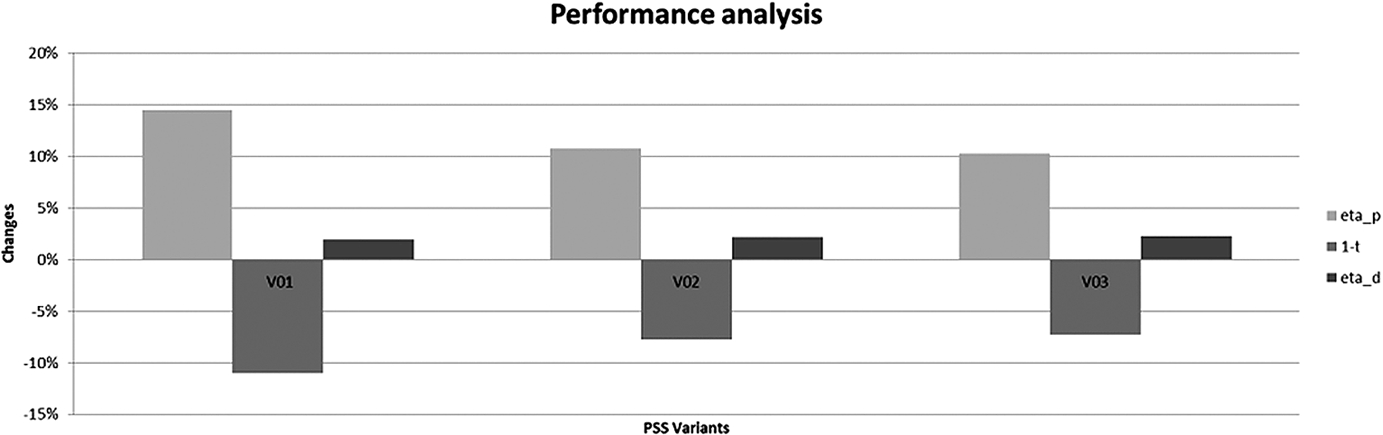
The ESD performance analysis (Fig. 26) leads to a clear conclusion: the PSS V01 with four stator blades has actually increased the propeller performance efficiency the most (14.5%), but it is not the best design because the thrust deduction has also been increased by a large amount (11.0%), so that the overall efficiency increase (1.9%) is lowest among the PSS variants. Following this consideration, the design guideline for the PSS design can be stated: A good PSS design would characterize itself in mainly two aspects: to produce as much pre-swirl as possible to increase the propeller efficiency
Performance analysis of the PSS variants.
The previous section showed that the propeller loading has become higher and more homogeneous due to PSS, which means that the propeller would need a much lower rpm to produce the same thrust. Figure 27 shows the changes in
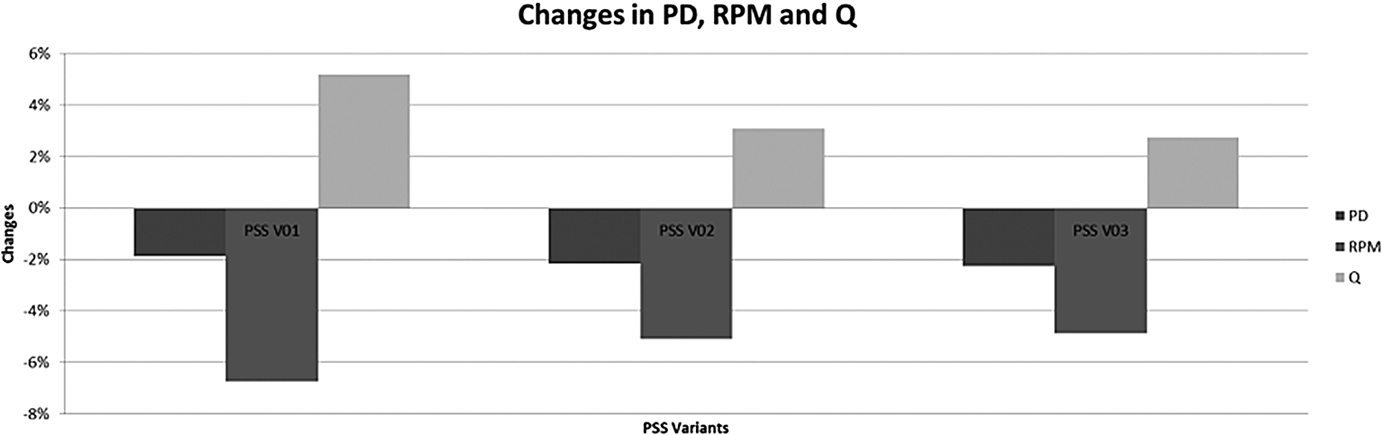
Changes in propeller PD, RPM and Torque due to PSS variants.
Another effect observed from the PSS is the hub vortex reduction. Figure 28 shows the streamlines passing through the propeller hub region indicating a less strong hub vortex due to PSS. A more detailed look at pressure distribution on the stern and hub, see Fig. 29, confirms that the pressure drop on the hub, which is normally caused by the presence of the hub vortex, has changed its sign from a negative resistance (less desirable) to a positive thrust (more favourable). When adding the PSS, more pre-swirl has been added to propeller inflow, not only in the high radius region but also in the root region of the propeller, and the slipstream is expected to contain less swirl now (even with higher propeller loading), which results in the positive effect of reducing the strength of hub vortex in this case.
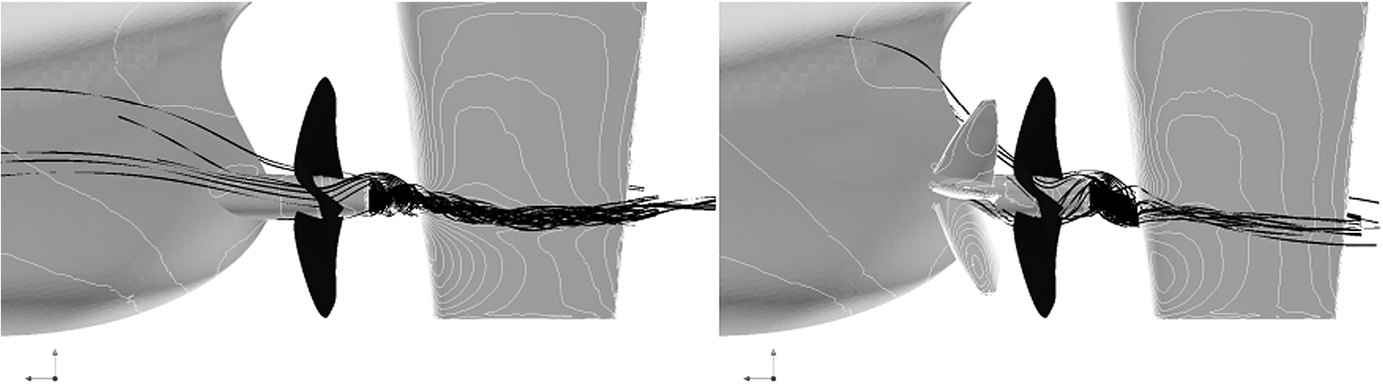
Streamline passing behind the propeller hub together with pressure distribution on surfaces: without ESD (left) and with PSS (right).
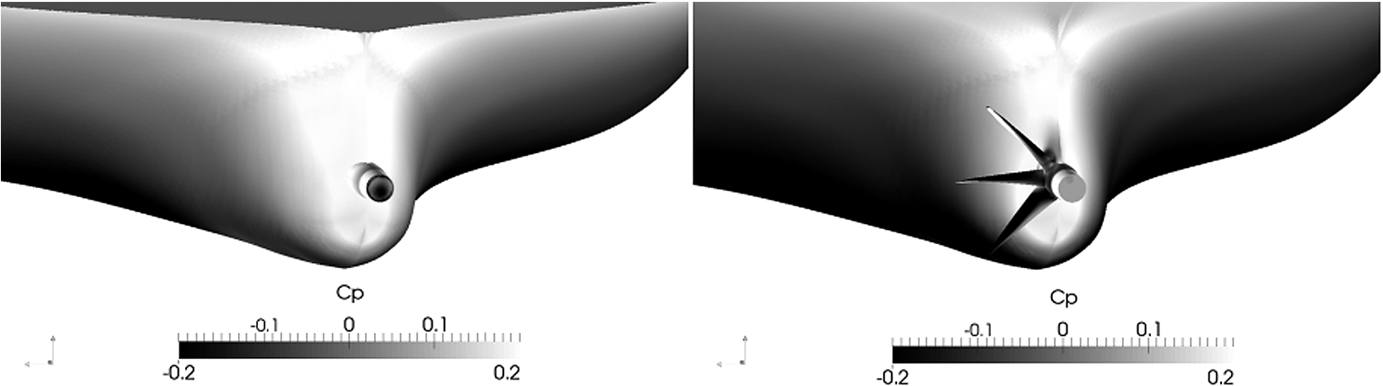
Cp Distribution on the ship stern and the hub: without ESD (left) and with PSS (right).
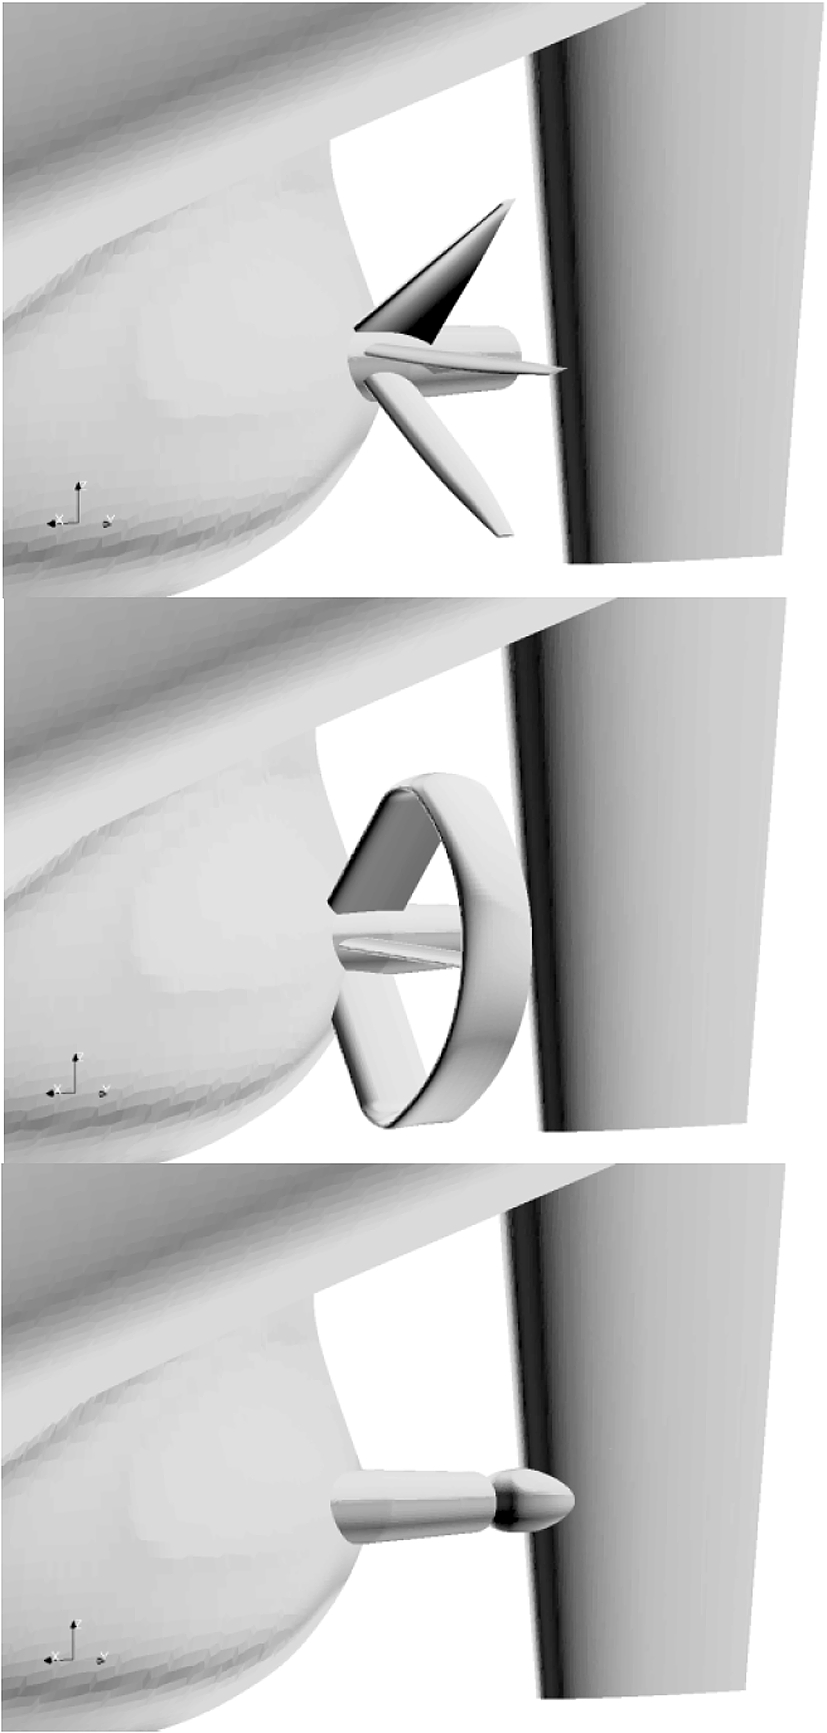
Geometry of the three ESDs designed for the Uljanik Bulker: HSVA PSS (top), MARIN Pre-Duct (middle) and VICUS Bulb (bottom).
As stated earlier, due to the fact that each partner has applied its own tools and numerical grids for the ESD design and evaluation, the only way to compare the performance of the resulting ESDs fairly is to perform a cross-check by all participating partners. This means that each partner has received the geometry of the ESDs designed by other partners and started the performance analysis of this ESD in the same way as the self-designed ESD. In this way, the different ESD designs can be compared assuming that the applied numerical methods are able to give the correct ranking of ESDs, since the only factor which now influences the ranking of the ESD is the geometry of the ESD design itself. This paper will only present the cross-check results obtained by HSVA using the analysis procedure introduced before. However, it needs to be mentioned here that the cross-check results from other partners have given the same ranking of ESDs as far as the hydrodynamic performance is concerned.
After receiving the geometries of other ESDs (shown in Fig. 30), the full scale DB numerical grids are generated for all variations of ESDs to ensure similar grid resolution for the whole computational domain. The resulting grids have slightly different total numbers of cells for ESD variations due to the different surface feature of ESDs. The total numbers of cells for meshes containing the MARIN Duct, the HSVA PSS and the VICUS Bulb are 13.0 M, 10.8 M and 9.8 M, respectively.
Figure 31 shows the changes of delivered power, propeller rpm and torque due to different ESDs. The predicted power gain is 2.2%, 0.2% and −1.4% for the HSVA PSS, the MARIN Pre-Duct and by the VICUS Bulb, respectively. The changes in rpm and torque are in the same direction for the HSVA PSS and the MARIN Pre-Duct, indicating possibly a similar working principle of these two devices. Since the MARIN Pre-Duct is so designed that it contains three fins inside the duct, which has also the functionality to produce pre-swirl to the propeller, this is not really a surprise. The computed energy saving effect is, however, smaller for the MARIN Pre-Duct, which is noted by a smaller reduction of rpm and higher increase of propeller torque in this case. The non-optimal design of the VICUS Bulb has caused the increases of both propeller rpm and torque, which lead to a higher power demand in this case.
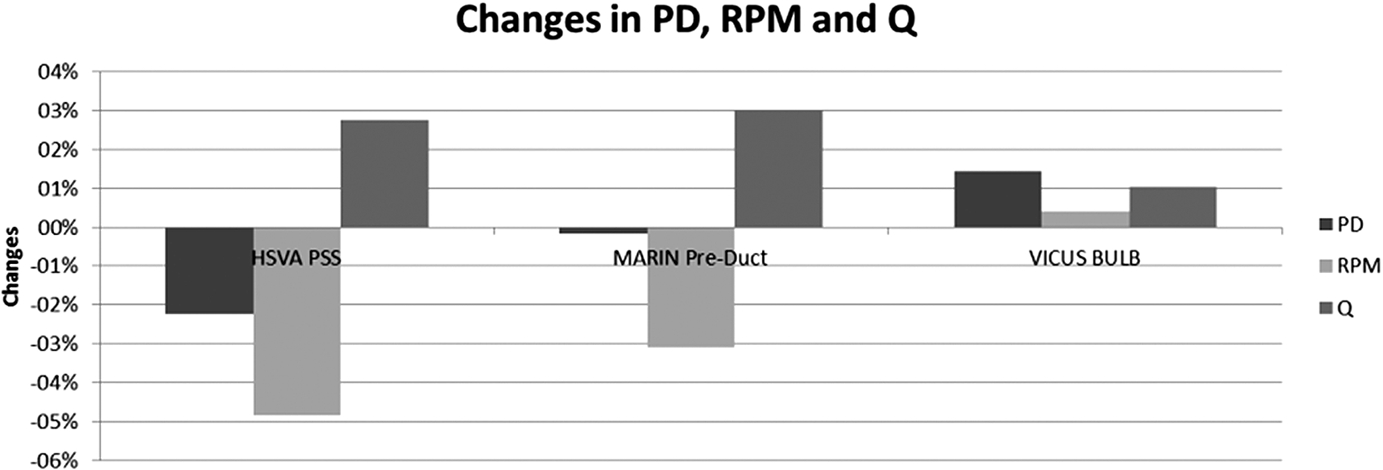
Changes in PD, RPM and torque due to ESDs.
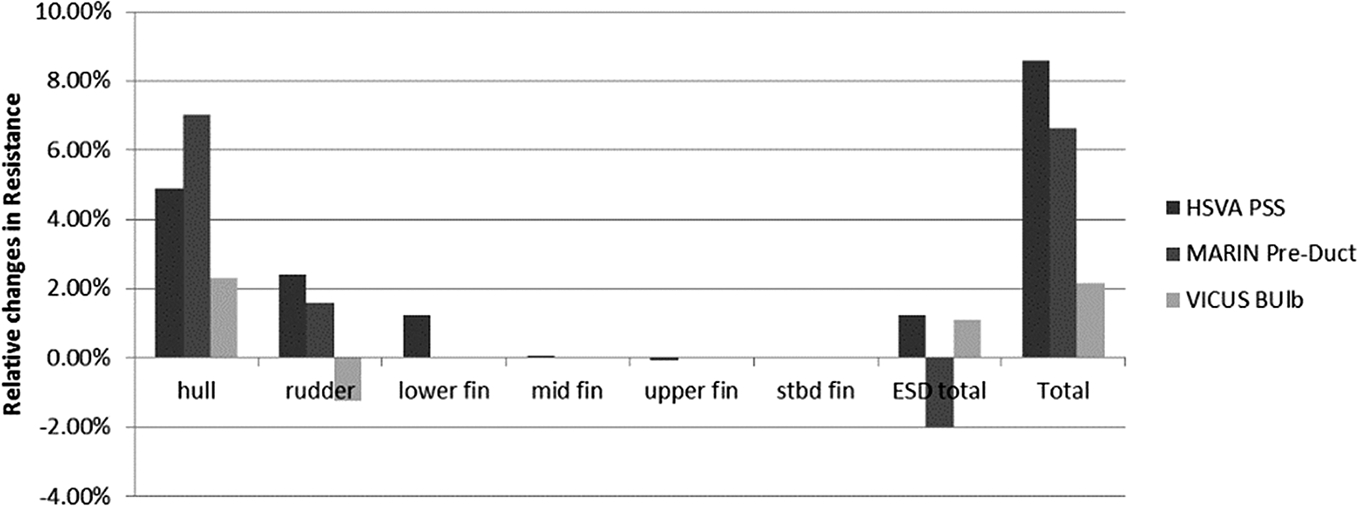
Relative changes in Resistance forces under propulsion condition.
The total thrust requirement becomes higher for all variants of ESD compared to the case without ESD, see Fig. 32. The comparison between the MARIN Pre-Duct and the HSVA PSS on the resistance components under propulsion condition shows that though the MARIN Pre-Duct is producing promising thrust (about 2%), this has been penalized by the increased resistance (about 7%) on the hull due to the small distance between the hull and the ESD so that the total resistance has been increased by 6.6% in case of the MARIN Pre-Duct. The total resistance increase in case of the HSVA PSS is more than 8%, which is higher than for the case of the MARIN Pre-Duct. Also the VICUS Bulb is making an additional resistance for the hull, which is likely to be caused by the higher suction effect of the propeller.
As can be seen, the HSVA PSS has the highest thrust demand in comparison to other ESDs; whereas it has achieved also the highest predicted power gain ratio. So what makes the HSVA PSS perform hydrodynamically better than the other ESDs in this study can only come from the increase in propeller performance. This can be confirmed in the performance analysis of these three ESDs, see Fig. 33. As can be seen, the propeller performance efficiency has been increased by the HSVA PSS by about 10.3%, which is much higher than the 6.2% achieved by the MARIN Duct and 0.5% by the VICUS Bulb. This seems to more than compensate the negative effect of the increased thrust deduction factor by the HSVA PSS in this case.
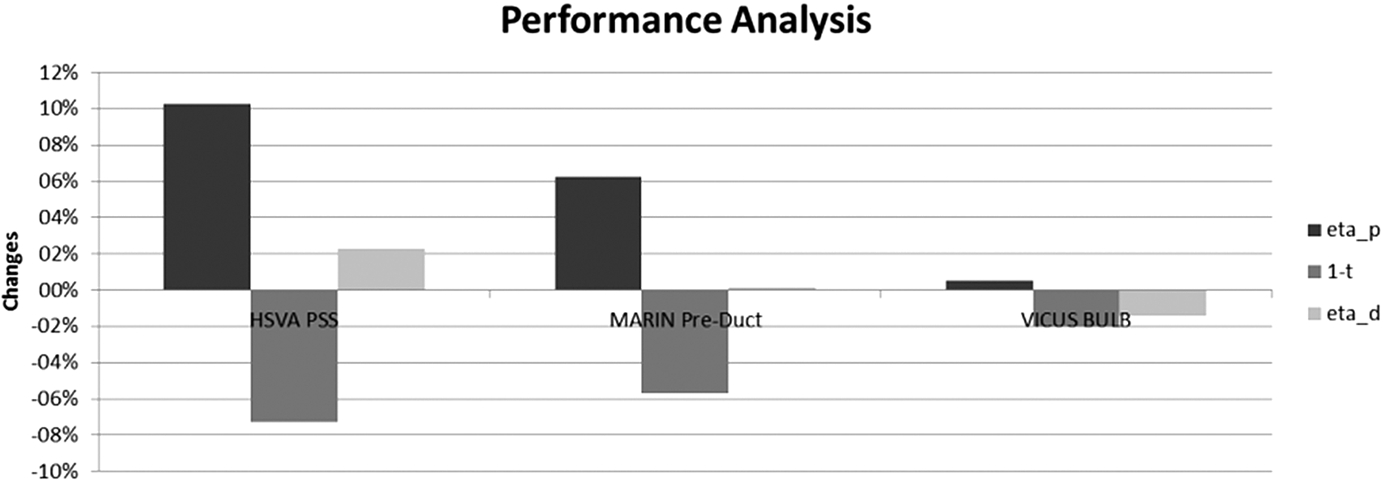
Performance Analysis on different ESDs.
The comparison of the propeller blade thrust during one revolution, shown in Fig. 34, proves again that the propeller behind both the HSVA PSS and the MARIN Duct performs better; whereas the unloaded region has been reduced by the HSVA PSS more effectively. Figure 35 shows the thrust fluctuation in circumferential direction, which confirms again that the propeller behind the HSVA PSS works most homogeneously; keeping in mind that this effect can also positively influence the propeller induced vibration to some extent. As expected, the VICUS Bulb has hardly any influence on the thrust distribution in a circumferential direction. The reason why the propeller behind the HSVA PSS works more efficiently and homogeneously becomes visible in Fig. 36, where the changes in tangential effective wake have been plotted behind these three ESDs. As can be seen, the largest changes can be observed behind the HSVA PSS, followed by the MARIN Pre-Duct, while the changes for the VICUS Bulb are negligible.

Comparison of the propeller blade thrust in circumferential direction due to different ESDs.
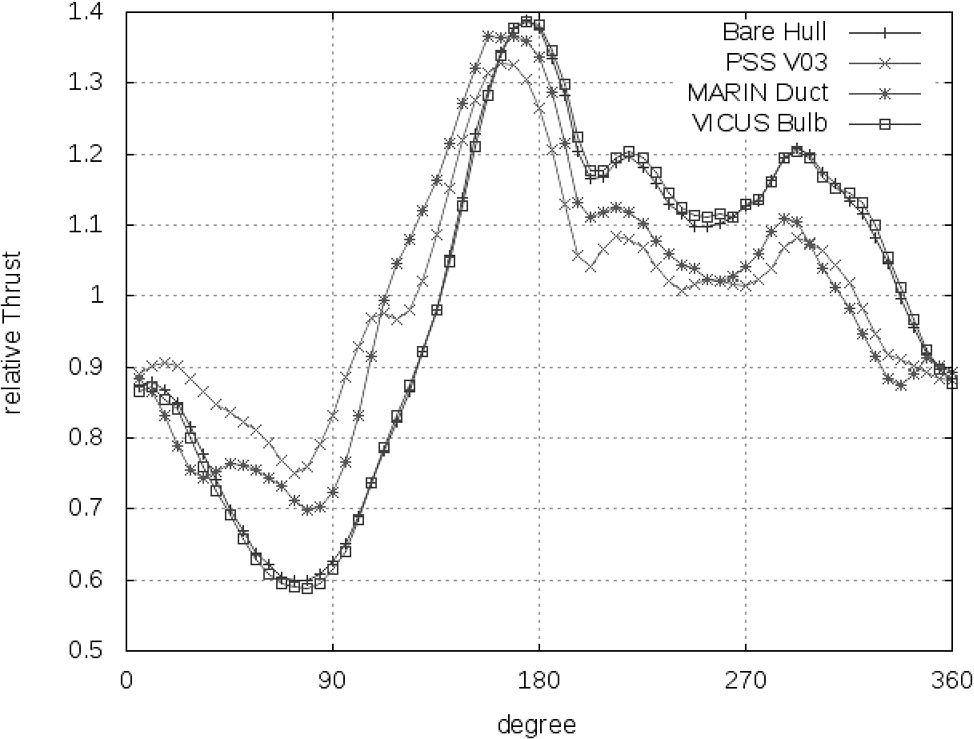
Comparison of the propeller thrust fluctuation in circumferential direction due to different ESDs.
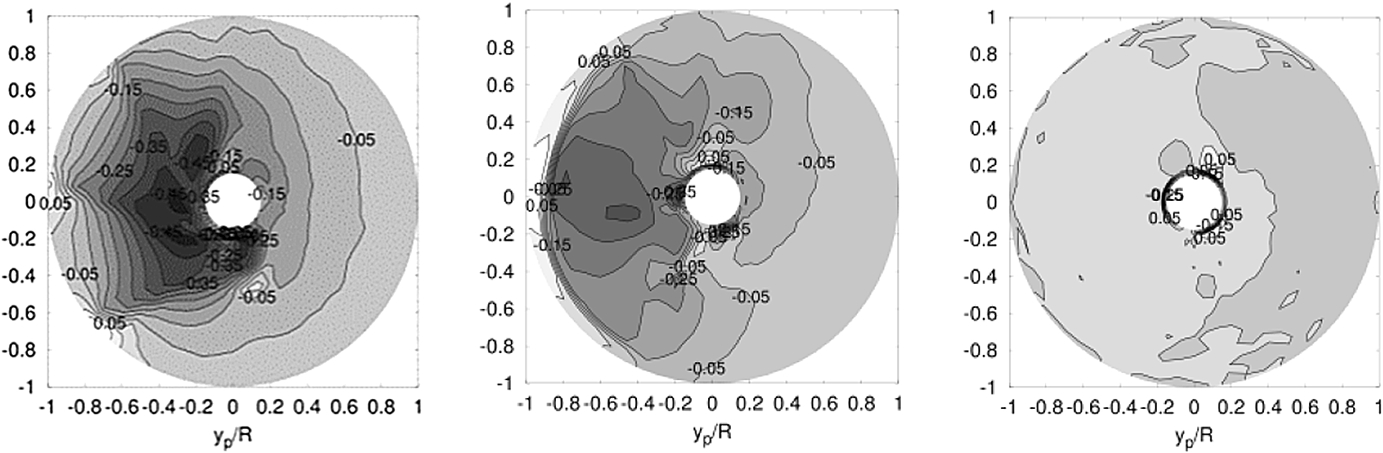
The changes of the tangential wake due to HSVA PSS (left), MARIN Pre-Duct (middle) and VICUS Bulb (right).
From the flow analysis procedure introduced before, we learned that the total energy contained in the fluid behind the ship and propeller should become smaller when an effective ESD is installed since the purpose of the ESD is to reduce the inevitable propulsion energy losses. To prove this, we have defined two vertical planes positioned behind the propeller and the ship/rudder, respectively, see Fig. 37. The tangential rotational energy has been integrated on both planes from the RANS propulsion computations. Figure 38 shows the changes in tangential rotational energy due to ESDs in comparison to the baseline case without ESD. As can be seen, the HSVA PSS can indeed reduce the rotational energy at both planes at most; whereas the VICUS Bulb has increased the rotational energy in the flow, which reflects again the increase in power demand.
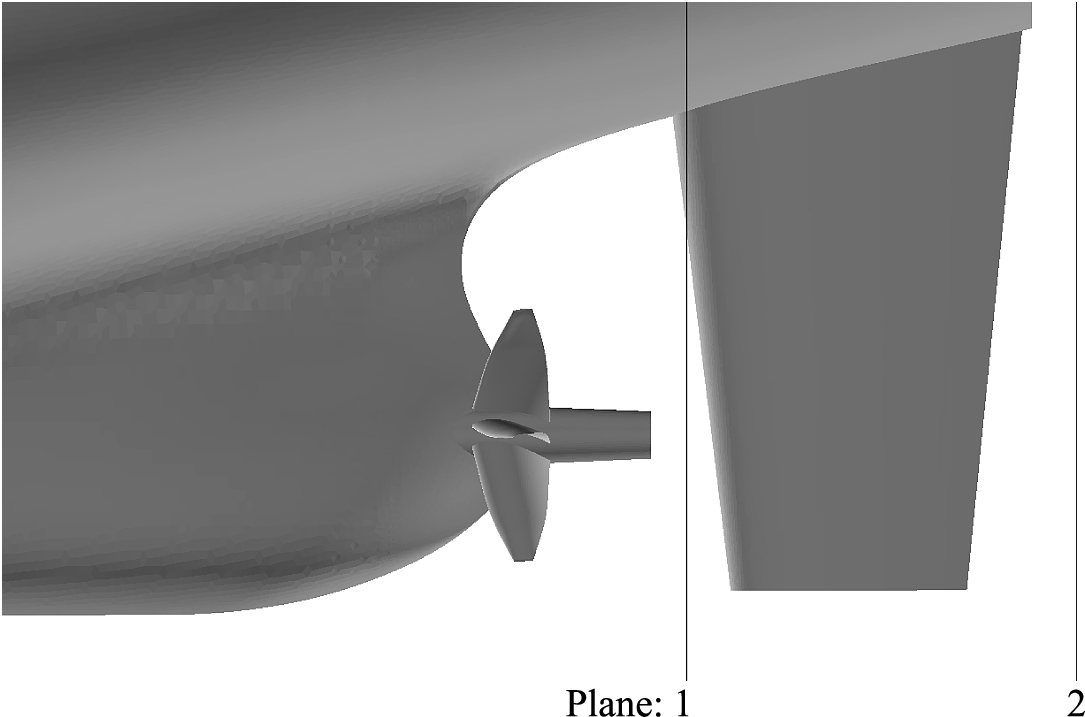
Definition of vertical planes: plane 1 (
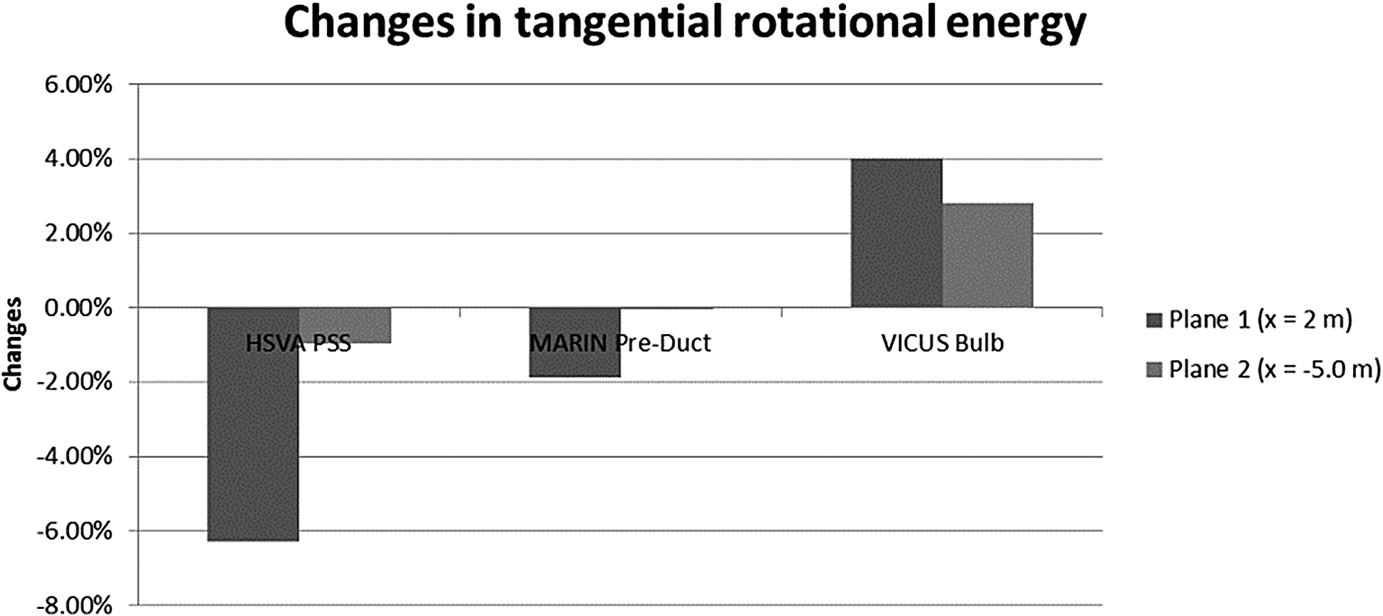
Changes in tangential rotational energy on two vertical planes.
The hydrodynamic design procedure for Energy Saving Devices (ESDs) developed in the EU FP7 project GRIP has been successfully applied to a newly built 52,000 DWT Bulk carrier by Uljanik shipyard in Croatia. The Pre-Swirl Stator designed by HSVA was selected to be installed on the validation ship after thorough cross-checks performed by the partners and this ESD has been developed further and successfully tested during the trials of the full scale ship, which gives a power gain ratio of up to 6.8%.
The cross-check results using the RANS-QCM coupling method from HSVA show that the predicted power gain is 2.2% and 0.2% due to the PSS and the Pre-Duct, respectively. A power increase of 1.4% has been predicted for the rudder bulb. The figures for all ESDs are affected by the limited computational power resources and lead time that were available and are hence expected to be more complete when more time is provided.
The mechanism that leads to a successful power reduction due to a PSS installation was shown to be the generation of pre-swirl and its submission into the propeller plane. This pre-swirl both redirects the resulting force vector on the propeller blades to a higher effective angle of attack such that the thrust/torque ratio of the blade is improved, and reduces the propeller rotation rate needed to deliver the demanded thrust. Both the reduced rotation rate and the improved thrust/torque ratio lead to a reduced power requirement. In the Uljanik case, the PSS leads to a decrease in propeller rotation rate of some 5% in self-propulsion condition.
The ESD design and evaluation using the RANS-QCM coupling method seems to be an efficient method for the ESD evaluation and optimisation process due to its relatively low cost and the quick response time. Simultaneously the method seems to be sensitive enough to reflect the flow changes due to ESDs.
Footnotes
Acknowledgements
This research is partly funded by the European Union under the 7th Framework Programme (FP7) under Grant Agreement 284905.