



Abstract
Energy saving devices (ESD)s designed to improve the propulsive efficiency of a ship are often designed and validated using CFD tools and model tests. Evaluation at full scale is however still required to understand extrapolation methods and scale effects. This paper describes the evaluation of an ESD by means of dedicated speed/power trials just prior and directly after the installation of the device in dry dock. The energy saving device is in the form of three stator fins located at the port side just ahead of the propeller creating a pre-swirl in the flow into the propeller which reduces rotational losses of the propulsion. The stator was build and retrofitted by Uljanik shipyard in Croatia on a new build 52,000 DWT bulk carrier. Trials were done prior and after retrofitting of the ESD in almost ideal weather conditions. Comparison of the trial results revealed a fuel saving effect of 6.8% in power. Cavitation observations of the stator and propeller showed a removal of the cavitating hub vortex of the propeller after the installation of the fins. This can be detected and confirmed in the CFD computations as well. Full scale CFD investigation employing the RANS-BEM coupling method to simulate the propeller effect gives a power saving of more than 5%, which is in good agreement with the trial results. The geometry used in the CFD simulation is based on the 3D in-situ geometry measured via laser scan technique after the retrofitting of the fins.
Keywords
Nomenclature
Boundary Element Method Beaufort wind scale Computational Fluid Dynamics Differential Global Positioning System Energy Saving Device Performance Indicator Pre-Swirl Stator Reynolds-averaged Navier-Stokes Ship speed Over Ground Sea State (Douglas scale) Uncertainty
Background
As part of the EU FP7 project GRIP (Green Retrofitting through Improved Propulsion) an energy saving device has been designed, manufactured and retrofitted on an operational ship. Energy saving devices for ships generally concentrate on the reduction of propulsion losses (which still remain in the order of 40% of the total delivered power). Within GRIP, three different energy saving devices were evaluated for a 52,000 DWT bulk carrier: a rudder bulb, Pre-Swirl Stator fins (PSS) and a pre-duct. All ESD options have been evaluated and cross-validated by participating partners of the GRIP consortium. The HSVA design of pre-swirl stator fins was predicted by all partners to give the highest energy saving potentials. This ESD was build and retrofitted by Uljanik shipyard in Croatia on a new build handymax 52,000 DWT bulk carrier. Sea trials were performed just prior to the installation of the ESD and directly after the fitting of the ESD in dry dock. This paper discusses the speed trials done and evaluates the benefits of the tested ESD in terms of fuel saving and propeller cavitation. Finally a comparison is made to the full scale CFD investigations based on an in-situ geometry which is measured via laser scan technique in dry dock directly after the PSS installation.
Design of the ESD
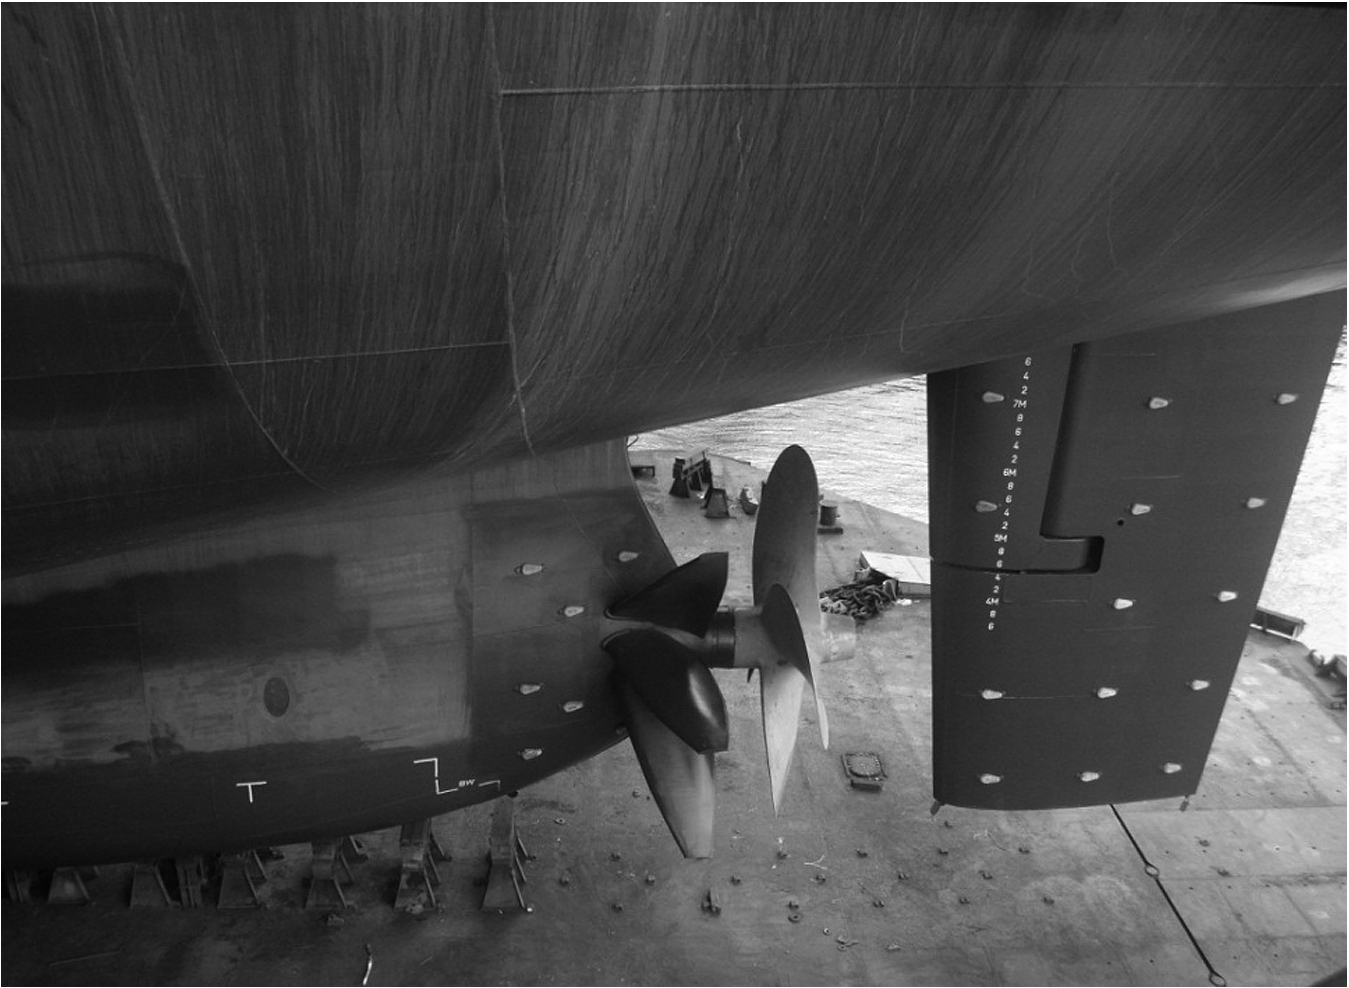
The evaluated energy saving device is a pre-swirl stator in the form of three fins on port side just ahead of the propeller. The objective of the fins is to create a pre-swirl into the propeller plane that results in a reduction of the rotational losses of the propeller. Furthermore the fins result in a reduction of the uniformity losses due to the inhomogeneous operation of the propeller (caused by its rotation direction and the ship wake). Figure 1 shows a picture of the stator fins, propeller and rudder and the pressure distribution on the surfaces.
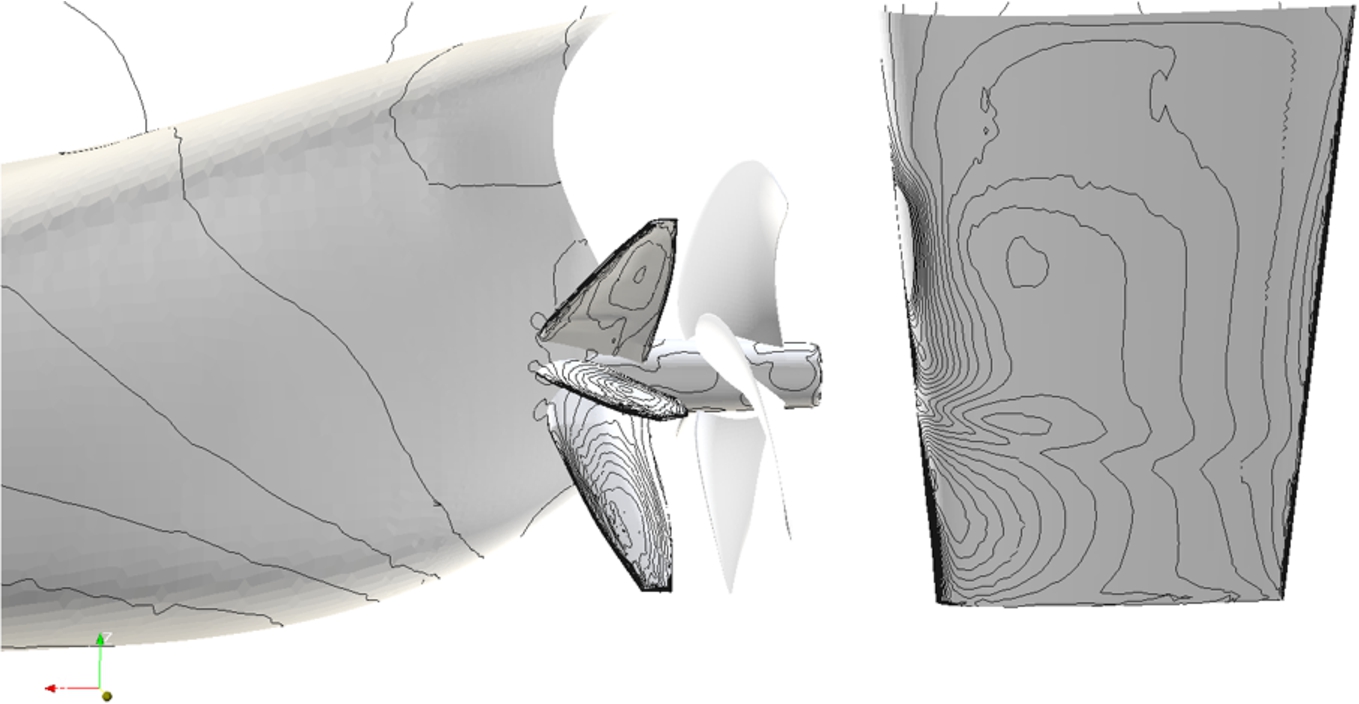
The Bulk Carrier with the PSS; Pressure distribution on the surfaces of hull, rudder and PSS.
The ship has a four bladed right handed fixed pitch propeller with a diameter of 5.8 m. The stators envelop a diameter of 6.4 m and are therefore slightly larger than the propeller blades to avoid the tip vortex of the fins going into the propeller plane. The HSVA design of the PSS was based on the parametric model developed in the project. This is directly coupled to the boundary element method (BEM) and RANS optimisation tools. BEM-based optimisation has been performed at an early stage to find the optimum twist and camber of the fins due to its quick calculation time. Consecutively, several designs have been thoroughly evaluated using RANS method. The HSVA in-house RANS code
Ship just prior to the trials with the PSS installed.
In order to evaluate the fuel saving properties of the ESD speed/power trials were planned following ITTC guidelines [5,6]. However, it is not clear whether such trials could give the required accuracy for ESD evaluation, whose power saving effect is sometimes below 2%. By means of a sensitivity study, instrumentation requirements and restrictions regarding environmental conditions during the trails can be determined. From the sensitivity analysis it also follows whether trials must be done on the same vessel, or the performance of sister ships can be used to evaluate the ESD performance gains.
The speed power performance assessment of a ship by means of trials is affected by the following uncertainties:
Uncertainty in the measurement of speed and power
Uncertainty in the correction methods for environmental conditions
Uncertainty in the measurement of environmental conditions and loading conditions
Furthermore, when two trials are compared the following additional uncertainties appear:
In case of sister ship comparisons: yard uncertainties due to building tolerances, human actions, coating application, marine bio-fouling etc.
Uncertainty due to differences in hull conditions (e.g. fouling or hull cleaning in dry dock etc.) and propeller roughness
In an early assessment [3] it was found that the comparison of sister ships for the evaluation of an ESD would give large uncertainties due to the large spread in performance between sister ships. It was concluded that trials could only be done on the same vessel to avoid large uncertainties.
To determine the uncertainty in the correction methods for environmental conditions, systematic tests would be required at full scale in different weather conditions. The execution of such trials is time consuming and costly, and examples are scarcely available in public literature. Even if they would be available, they would only refer to the specific ship in question and may not be applicable to other vessels. It is therefore not possible to state the uncertainty due to the inaccuracy of correction methods in general. However, some examples on added wave resistance methods based on model tests are available in [14]. This shows that there exist large differences between methods, and that careful selection is important. The uncertainty in correction methods that follow from measurements errors can be determined by means of a sample based sensitivity analysis, by systematically varying the input to correction methods and observing the effect on a performance indicator. The performance indicator ‘PI’ is the relative power deviation from a reference speed/power condition at similar ship speed. The reference speed/power condition is here taken as the hypothetical ‘true’ condition without measurement errors. The following sections describe the uncertainty of the speed and power expressed in PI and the uncertainty that follows from measurement errors in the applied corrections for wind, wave and displacement.
Ship speed uncertainty
Ship speed is estimated by taking the arithmetic mean of the speed over ground of 2 reciprocal runs. The speed over ground is hereby determined using a differential GPS system by measuring the time taken to travel from point A to point B in a straight line. The typical positional bias error limit for a DGPS measurement with 95% coverage is about 3 meters [11]. The uncertainty in time measurement is negligible. For speed runs with a duration of 10 min (600 sec) the expanded 95% confidence interval is approximately Vs ± 0.016 kn [4]. The propagation of ship speed errors from a single run into PI is however not straight forward. Following the ITTC procedure [6], the performance of a vessel is determined by correcting the power of each leg of a double run for environmental conditions and taking the mean of both legs. When all speed settings have been calculated, the relative offset of the measured and corrected points with the model test results are determined. The model test results are then ‘calibrated’ using the offset found. This last step is introduced to preserve the shape of the speed-power curve from model tests, as this can be defined with much higher accuracy (more speed/power points) compared to full scale trials. Hence the measurement uncertainty of a single leg does not propagate linearly. Using a case study for a bulk carrier between 14 and 16 kn it was found that a SOG uncertainty of Vs ± 0.016 kn corresponds to an uncertainty of PI ± 0.4%. If only some of the runs are measured with an error, this uncertainty reduces further.
Shaft power uncertainty
Shaft torque is measured by means of a torsional deflection measurement on the propeller shaft. The ITTC discussed the uncertainty in torque measurement using a strain gauge in [4]. The largest uncertainty in the estimation of shaft power is the shear modulus (G-value), which relates the elastic deformation of the shaft in relation to the applied torque. It cannot be measured directly. Ledbetter investigated the variation in G-modulus on 20 random samples of steel 304 and concluded a 1% variation in G-modulus [9,10]. Another large uncertainty is the k-factor of a strain gauge, which relates strain to resistance increase (0.5%). The ITTC predicts an uncertainty in power measurement with a confidence range of 95% of
When sister ships are compared the uncertainty becomes
When comparison trials are done on the same vessel and the same strain gauge can be used. The uncertainty in G-modulus, mis-alignment and k-factor is then equal for both trials and out of the equation. In this case the uncertainty becomes significantly less with an estimated 95% confidence interval of
Uncertainty in wind, wave and displacement corrections
The uncertainty in PI that is introduced from errors in the measurement of environmental conditions (wind, wave) and displacement (draft) depends on the environmental conditions during trials, ship type and power setting. At high speeds and high power settings the relative contribution of added wind and wave resistance is for example less than at low speeds. Moreover a 20% over estimation in wave height of 1 m contributes less than a 20% in 3 m waves. To get an indication of the propagation of uncertainties, case studies are made for a range of typical environmental conditions (BF3-5) and power settings (75–100% MCR). They are listed Table 1. Table 2 lists the expected uncertainties in the measured parameters of wind, wave and draft. They represent over- or underestimations of the actual environmental conditions and draft and are based on experience in trial execution.
Conditions used sensitivity analysis case studies
Conditions used sensitivity analysis case studies
Uncertainty ranges used in sensitivity analysis
Error propagation of wind measurement errors.
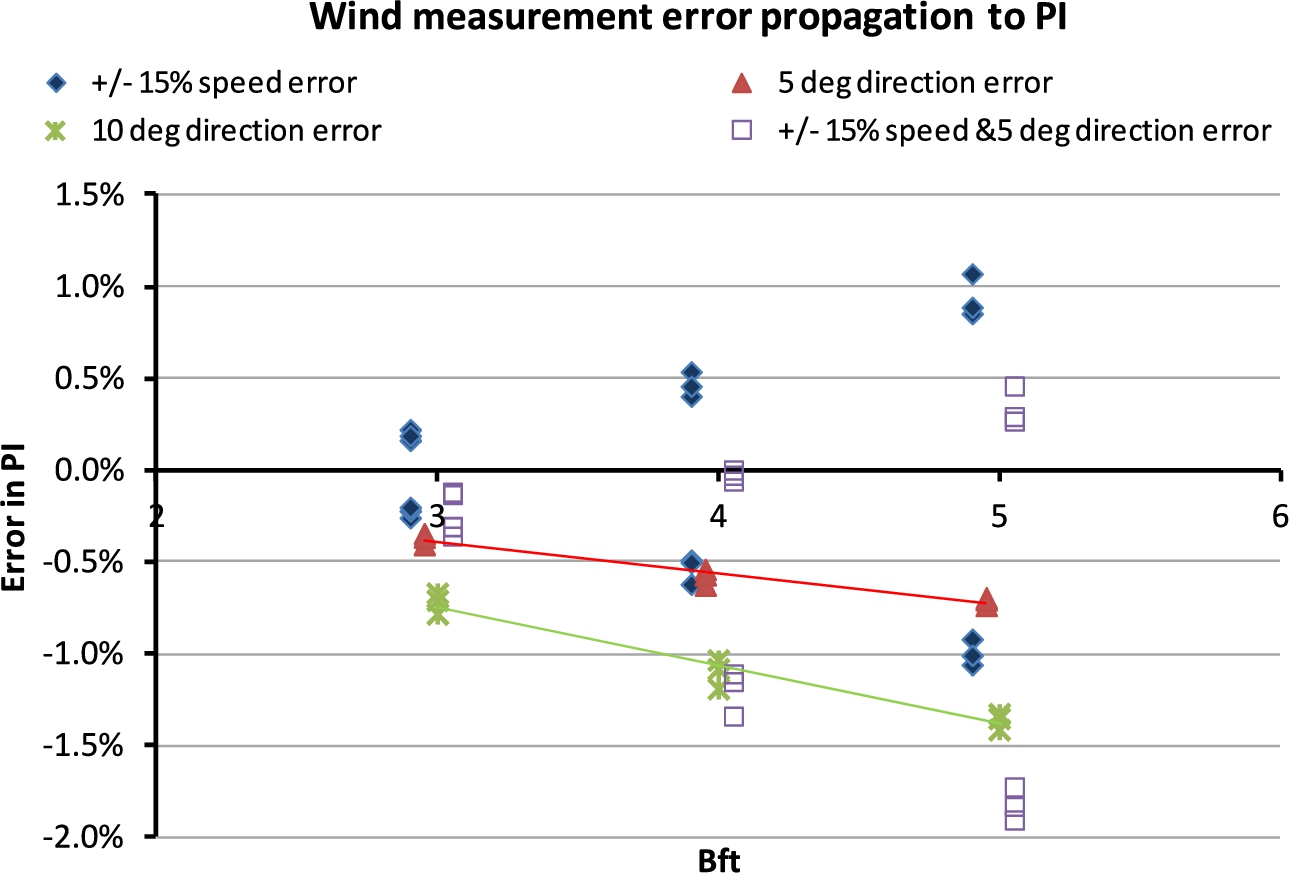
Wind speed and direction measurements are affected by wind distortion at the location of the anemometer. Figure 3 shows the error propagation of wind speed and direction errors for different power settings. A 15% underestimation of the apparent wind speed in Beaufort 3 conditions (8.5 kn true wind speed) results in an overestimation of the PI of approx. 0.2%. At BF5 this increases to about 1%. In practice wind distortion of the vessel’s superstructure will affect both wind speed and direction measurements. At BF4 a 15% overestimation of the wind speed in combination with a 5 degree angle error in direction will result in a 1.2% underestimation of the PI (performance predicted too positive). The impact at low wind speeds is much less, e.g. on the return run, when the vessel runs in the same direction as the wind. In this situation the wind resistance is practically zero, and the error in PI also low. Errors in wind speed measurements are difficult to avoid in practice due to the limited locations where anemometers can be safely positioned. To limit the uncertainty in comparison trials, trials should be done during conditions lower than BF3 (or 8.5 kn).
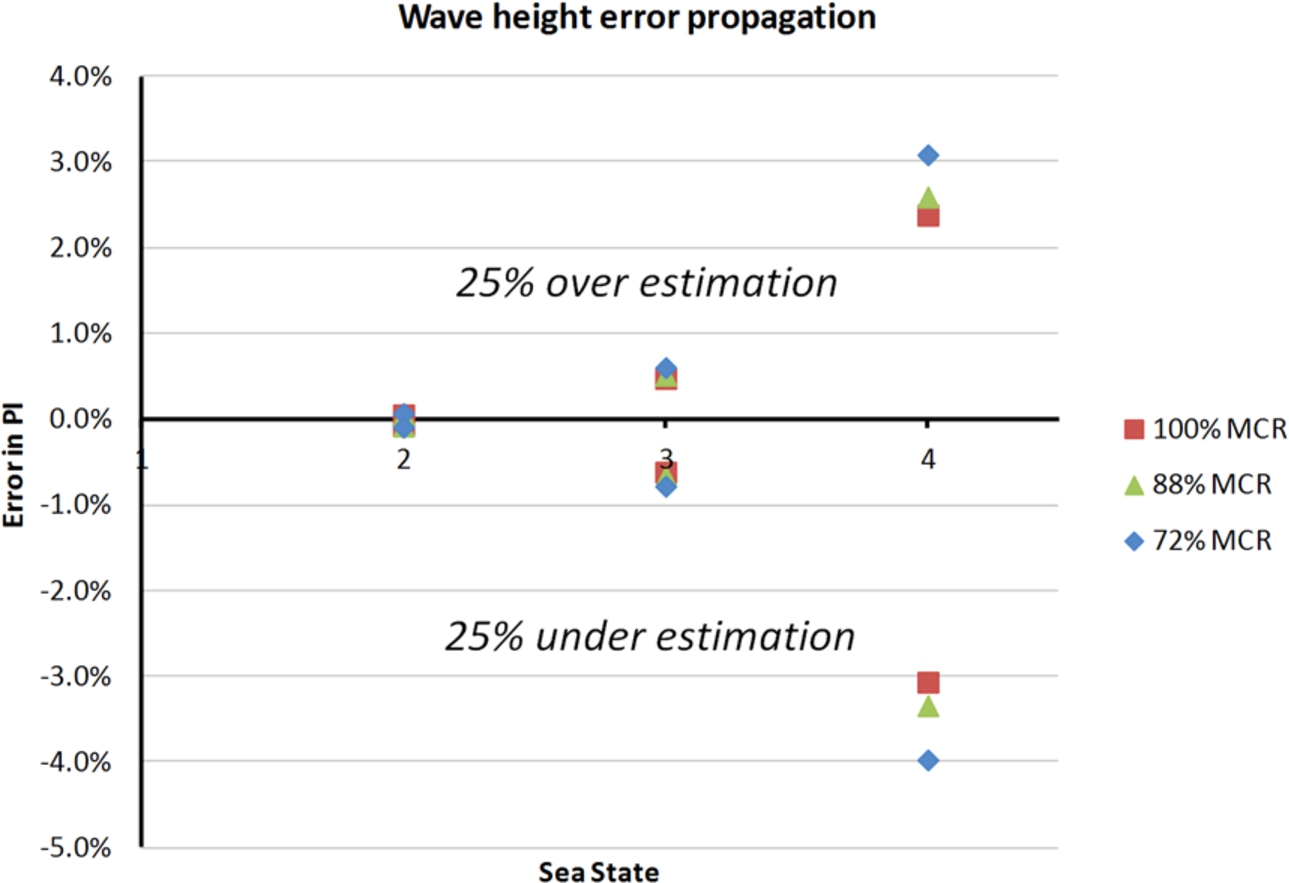
Wave height observations are made difficult due to the typically large height of the observation from the water surface, resulting often in underestimations of the wave height. Figure 4 shows the error propagation of a 25% over and underestimation of the wave height. It shows that the error in PI rapidly grows at higher sea states. To avoid large uncertainties, trials should be done either in SS2 (wave height a few decimetres) or a wave buoy should be deployed during the trials to get a lower uncertainty of the wave height measurement. The uncertainty of a typical wave buoy is low (in the order of 1 cm [2]) and can be considered irrelevant in terms of measurement uncertainties.
Error propagation of wave height errors.
Draft readings are made difficult when draft markings are read in waves, resulting in measurement errors. Figure 5 shows the effects that deviations in draft have on the calm water performance for the ship in the case study. The large sensitivity shows the importance of accurate draft readings and the importance of corrections for displacement variations.
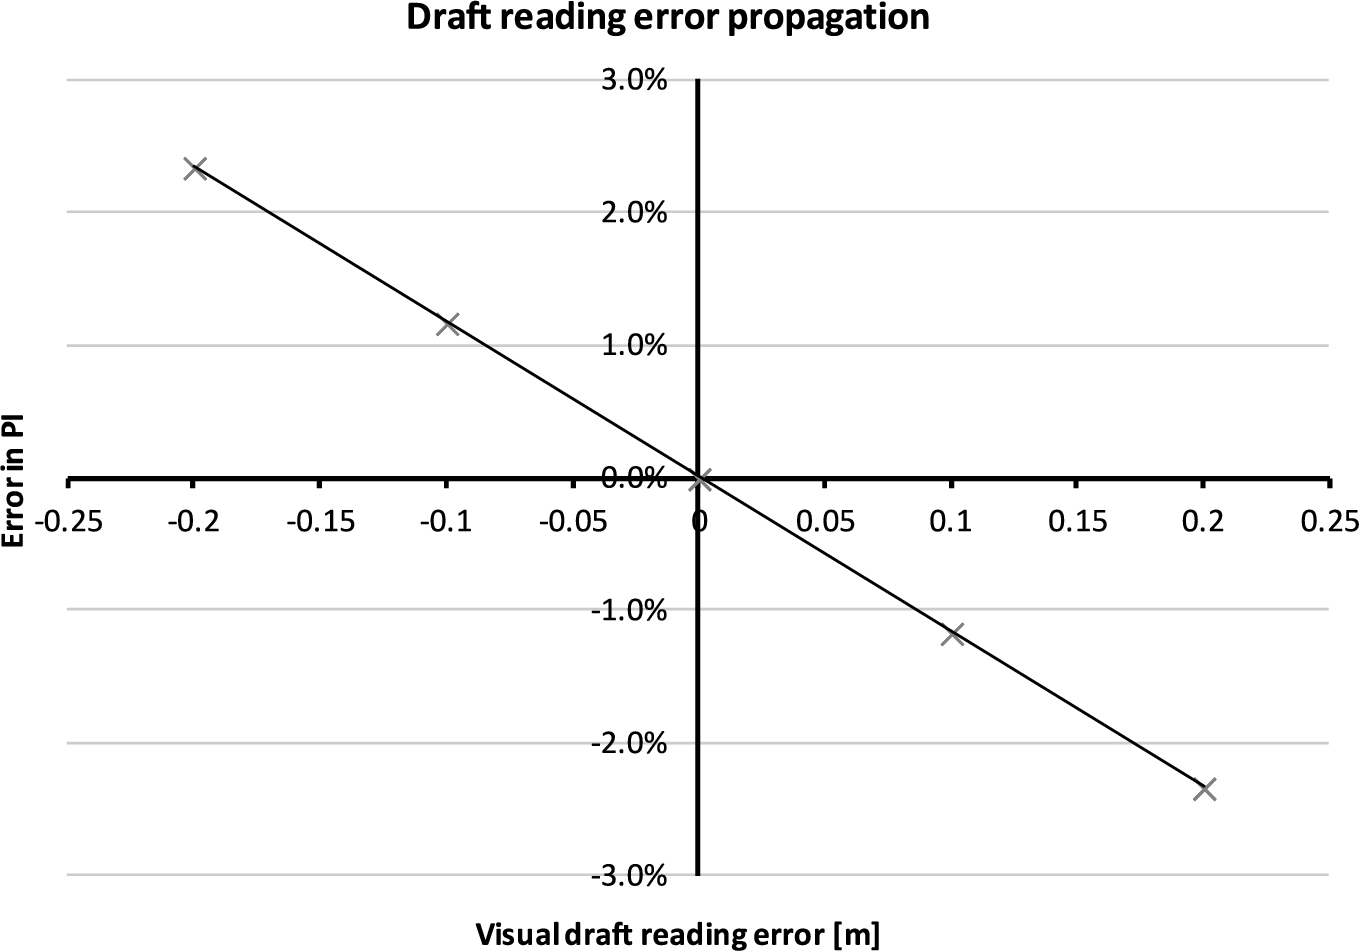
Error propagation of displacement differences.
Estimated measurement uncertainties for trials in different sea states
Table 3 shows the combined error in PI for a combined wind speed and direction error, wave height error and draft reading error at 100% MCR for three sea states. When two trials are compared to evaluate e.g. the effect of an energy saving device, the uncertainty becomes the sum of the individual uncertainties:
For example, if the first trial was done in
Based on above evaluation the following conclusions can be made for estimation of performance gains from an ESD using speed/power trials:
Trials should be done on the same vessel with the same instrumentation to avoid yard uncertainties and large uncertainties in shaft power measurement
Trials should be conducted at the highest power setting possible to minimise the relative contribution of added wind and wave resistance to speed loss
Typical measurement uncertainties in wind, wave, draft, speed and power propagate to uncertainties in the corrected trial performance. In fair weather they can be as low as 1%. In sea state 4 this can increase to 5%, based on the assumption that wind speed is measured with an uncertainty of 15%, wave height 25% and draft is read with 3 cm accuracy
A wave buoy should be deployed when wave height is larger than 1.0 meter to avoid wave estimation uncertainties
Trials should be executed directly prior and after the installation of the ESD. (Slime) fouling, which rapidly develops after launch, forming an almost invisible layer, may have large influences on ship performance [12]. The effects may be larger than the fuel saving properties of the ESD. Hull fouling and propeller roughness are the most important parameters to consider when evaluating trial performance differences
With these factors in mind speed trials were planned and executed on a handymax bulk carrier.
Full scale evaluation of ESD
Following the factors mentioned in the previous section trials were planned on a handymax bulk carrier build by Uljanik shipyard. The selected vessel, the MV Valovine, is a 52,000 DWT bulk carrier with a length of 189.9 metres and a beam of 32.26 metres. The vessel is propelled by a diesel direct configuration with a 5.8 m 4 bladed propeller running 121 RPM at maximum power. The vessel has been launched on September 28, 2013 and has been alongside the yard in Croatia until the beginning of April 2014 for outfitting. The development of hull fouling during this period was minimal due to the cold climate (winter) and the minimal submergence during outfitting (see Figs 6 and 7). The first 1/3rd of the vessel, which is most important in terms of frictional resistance, was largely out of the water during outfitting. Primarily the flat bottom was submerged. Due to the lack of sunlight this area the development of bio-fouling in this region is however slow.
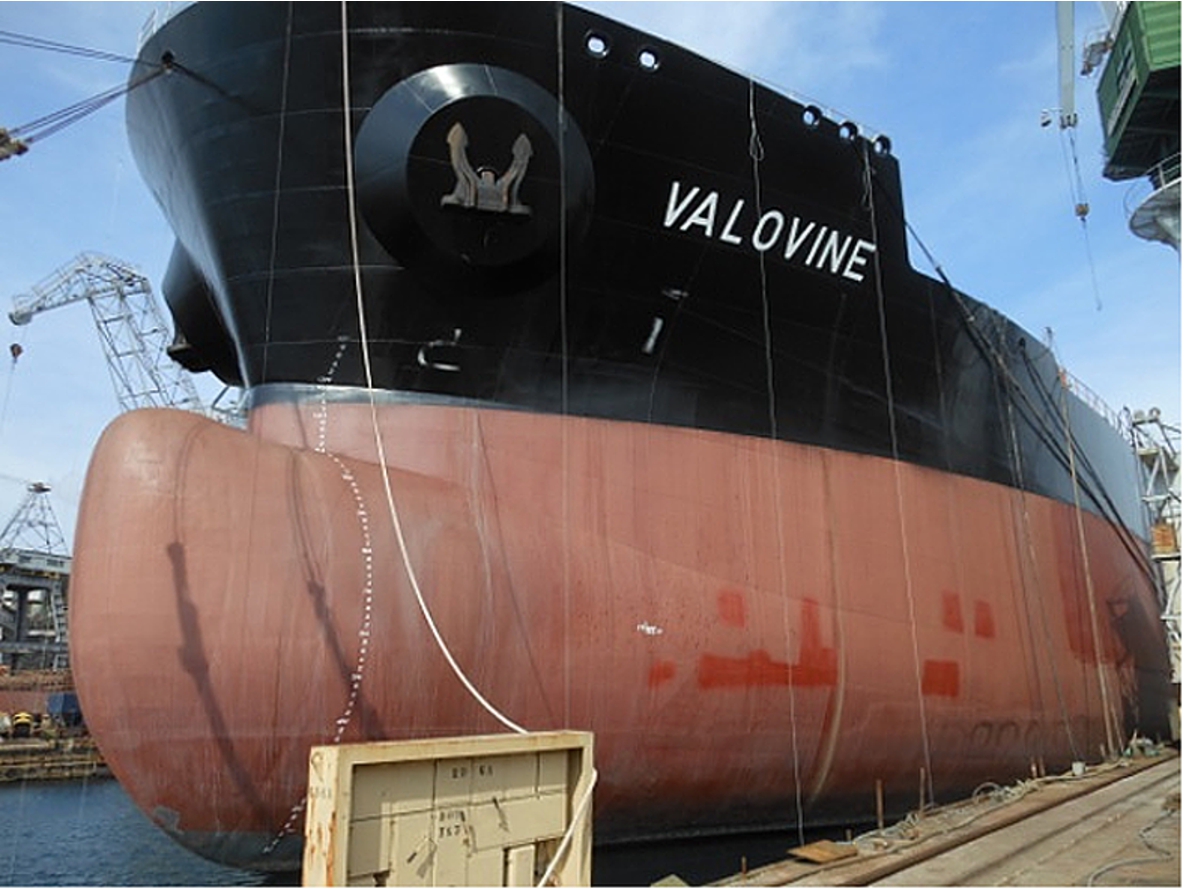
MV Valovine during outfitting; bow section.
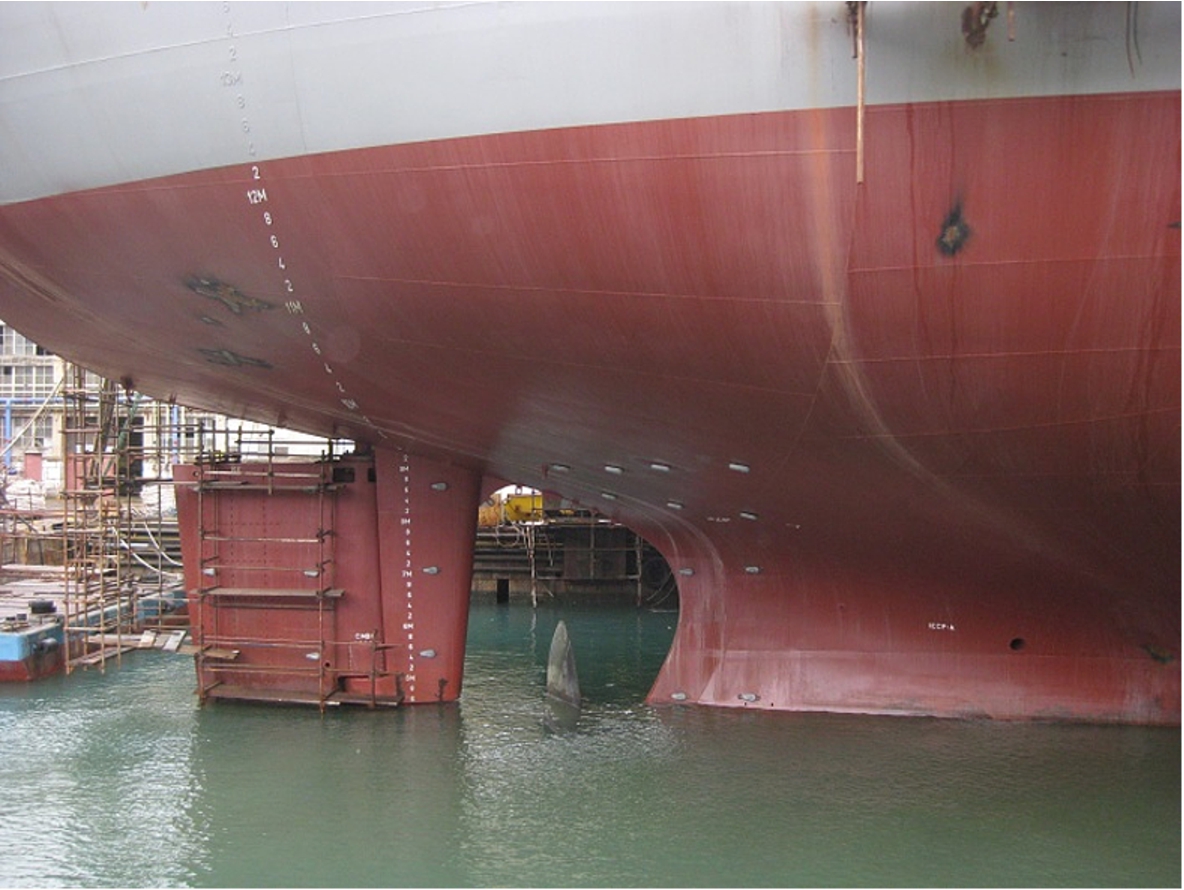
MV Valovine during outfitting; stern section.
During the outfitting period the propeller surface had been corroded with calcium deposits, resulting in a rough surface. To avoid unnecessary frictional losses and make fair comparison of the ESD performance possible, just prior to the first speed trials the propeller was polished by divers. The first trials (without ESD) were done 8 days after propeller polishing on April 5, 2014. Directly after the trials without ESD the ship was dry docked in Rijeka, Croatia at Viktor Lenac shipyard. During dry dock an assessment was made of the hull fouling, the complete hull was pressure cleaned, the stator fins were installed, docking studs were removed and the flat bottom re-coated. The docking studs, 8 in total measuring approx.
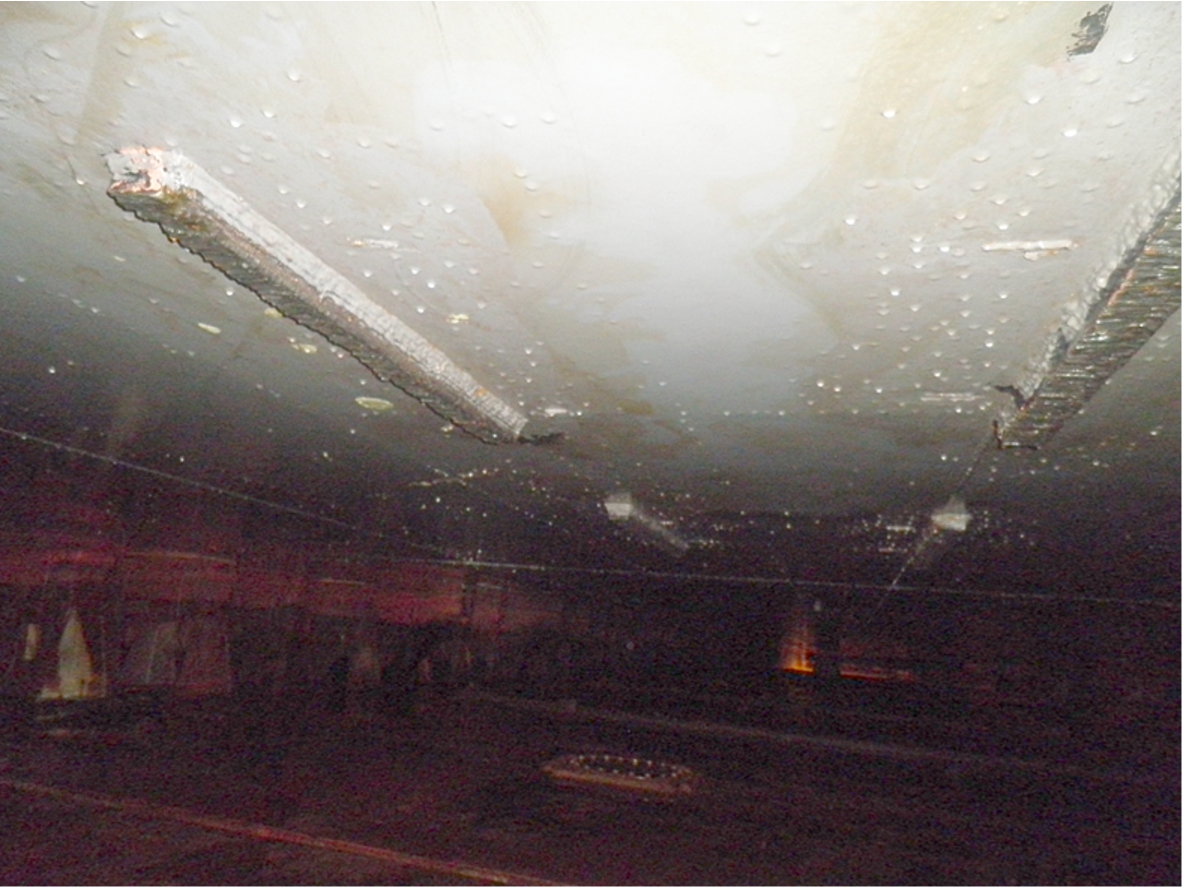
Docking studs later to be removed in dock.
The trials were done in the Adriatic Sea in an area sheltered from wind and waves and in deep (60 m) water. The trials were executed following the most up to date ITTC procedures [5] in heavy ballast conditions. Four speed settings were evaluated: 50, 75, 85 and 100% MCR. Trials were run into and following the dominant wave direction. The run duration of each leg was 10 minutes. The conditions during both trials were fair, with a significant wave height of 15 cm (measured using a wave buoy deployed prior to sea trials) and a wind breeze of 0.9 and 1.6 m/s for the first and second trial respectively. Prior to the trials care was taken to ballast the ship during both conditions to the same draft, checked by observing the draft markings on the hull. The difference in draft between the trials was estimated at 3 cm. Figures 9 and 10 show and appreciation of the environmental conditions during the first and second trial respectively.
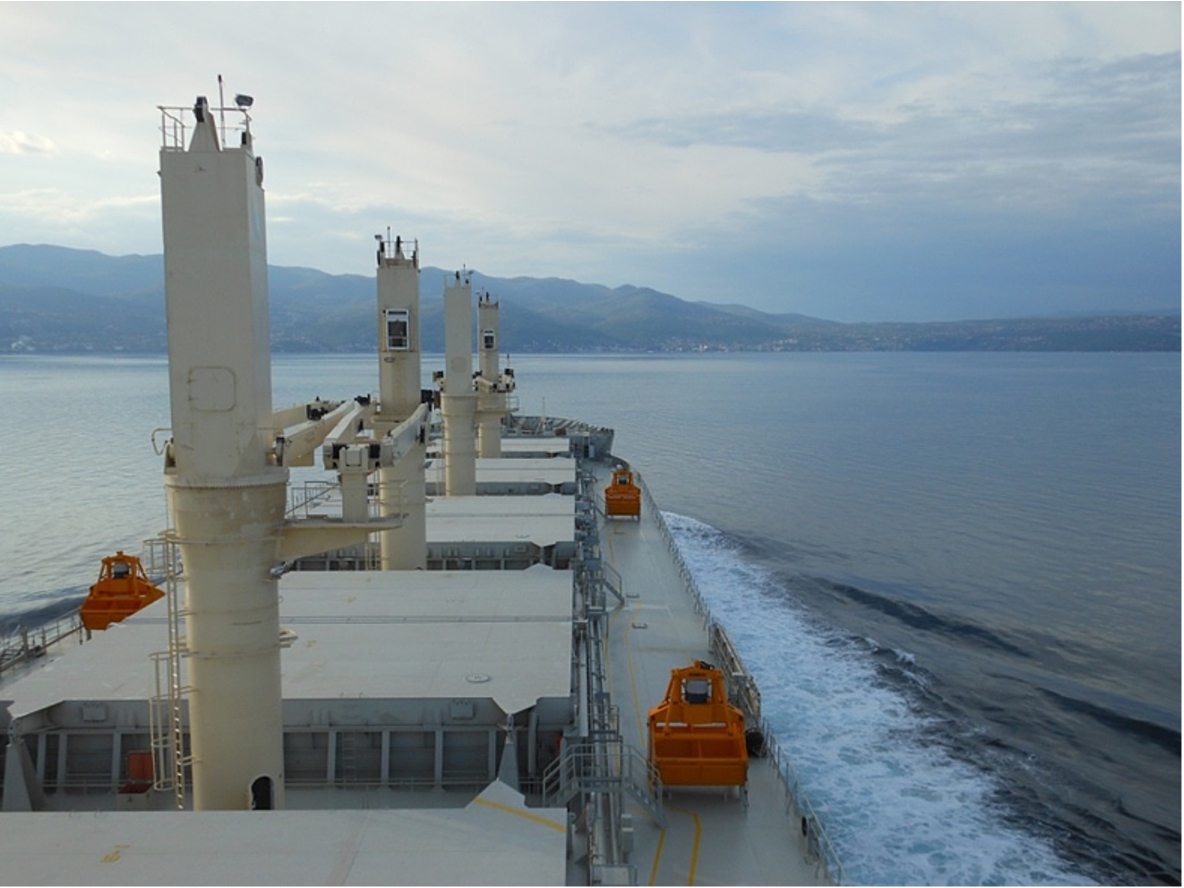
Trial conditions on April 5.
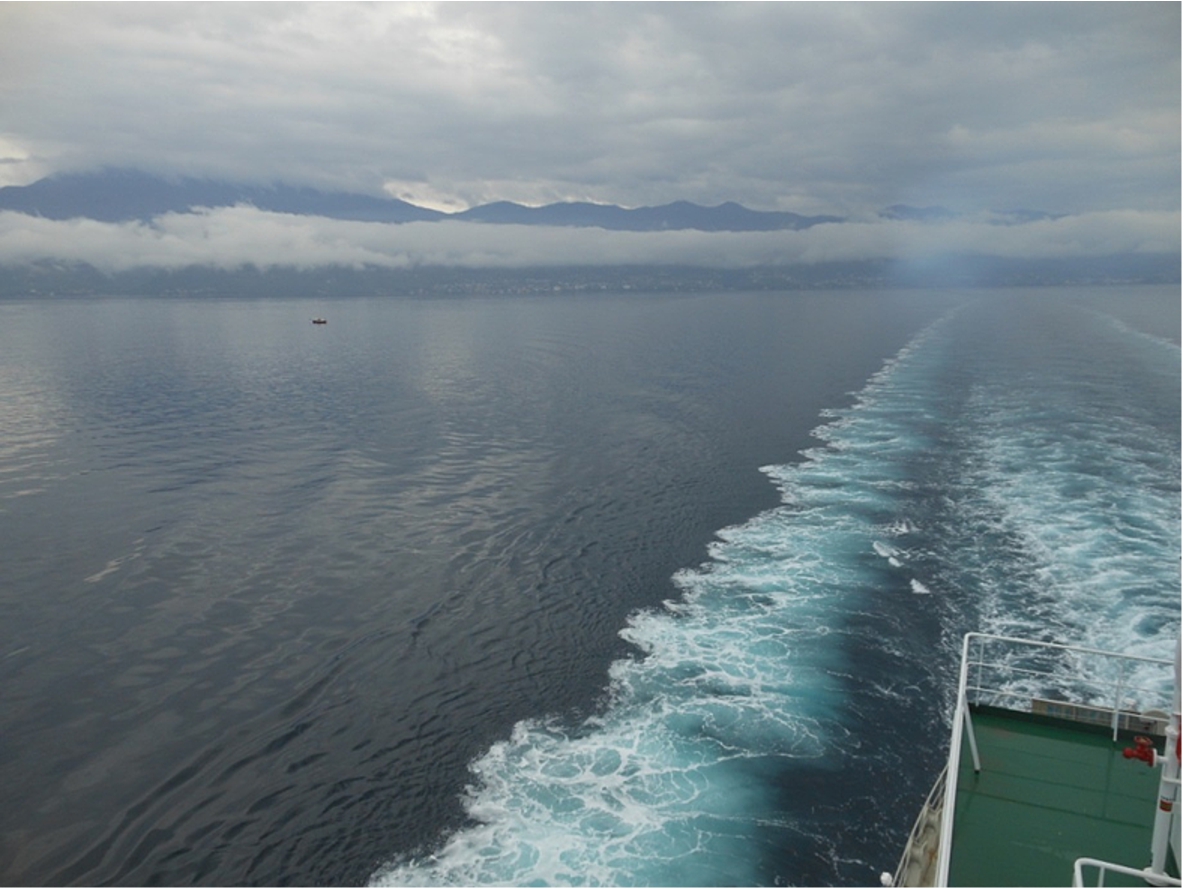
Trial conditions on April 18.
Shaft power was measured by a redundant power measurement system using strain gauges on the propeller shaft. Data was sampled at 1000 Hz to avoid aliasing. The system was zeroed in port prior to departure of the first trial and checked after the trials. For both trials, the same instrumentation and strain gauge on the propeller shaft was used. Position, course and speed over ground were determined using a DGPS unit, which was installed on the bridge top. The relative wind speed and direction was obtained using a sonic anemometer positioned on the mast on top of the wheelhouse at a location as high as possible to reduce the effects of wind distortion. Data was stored automatically with a sampling frequency of 10 Hz on a PC on the bridge. Furthermore, the depth below the keel was recorded manually from the echo sounder indicator on the wheelhouse. To record the wave height, period and direction, a free floating Datawell Directional Wave Buoy of type DWR G4 was deployed. The trials without and with ESD were performed by the same trial team.
Trial analysis
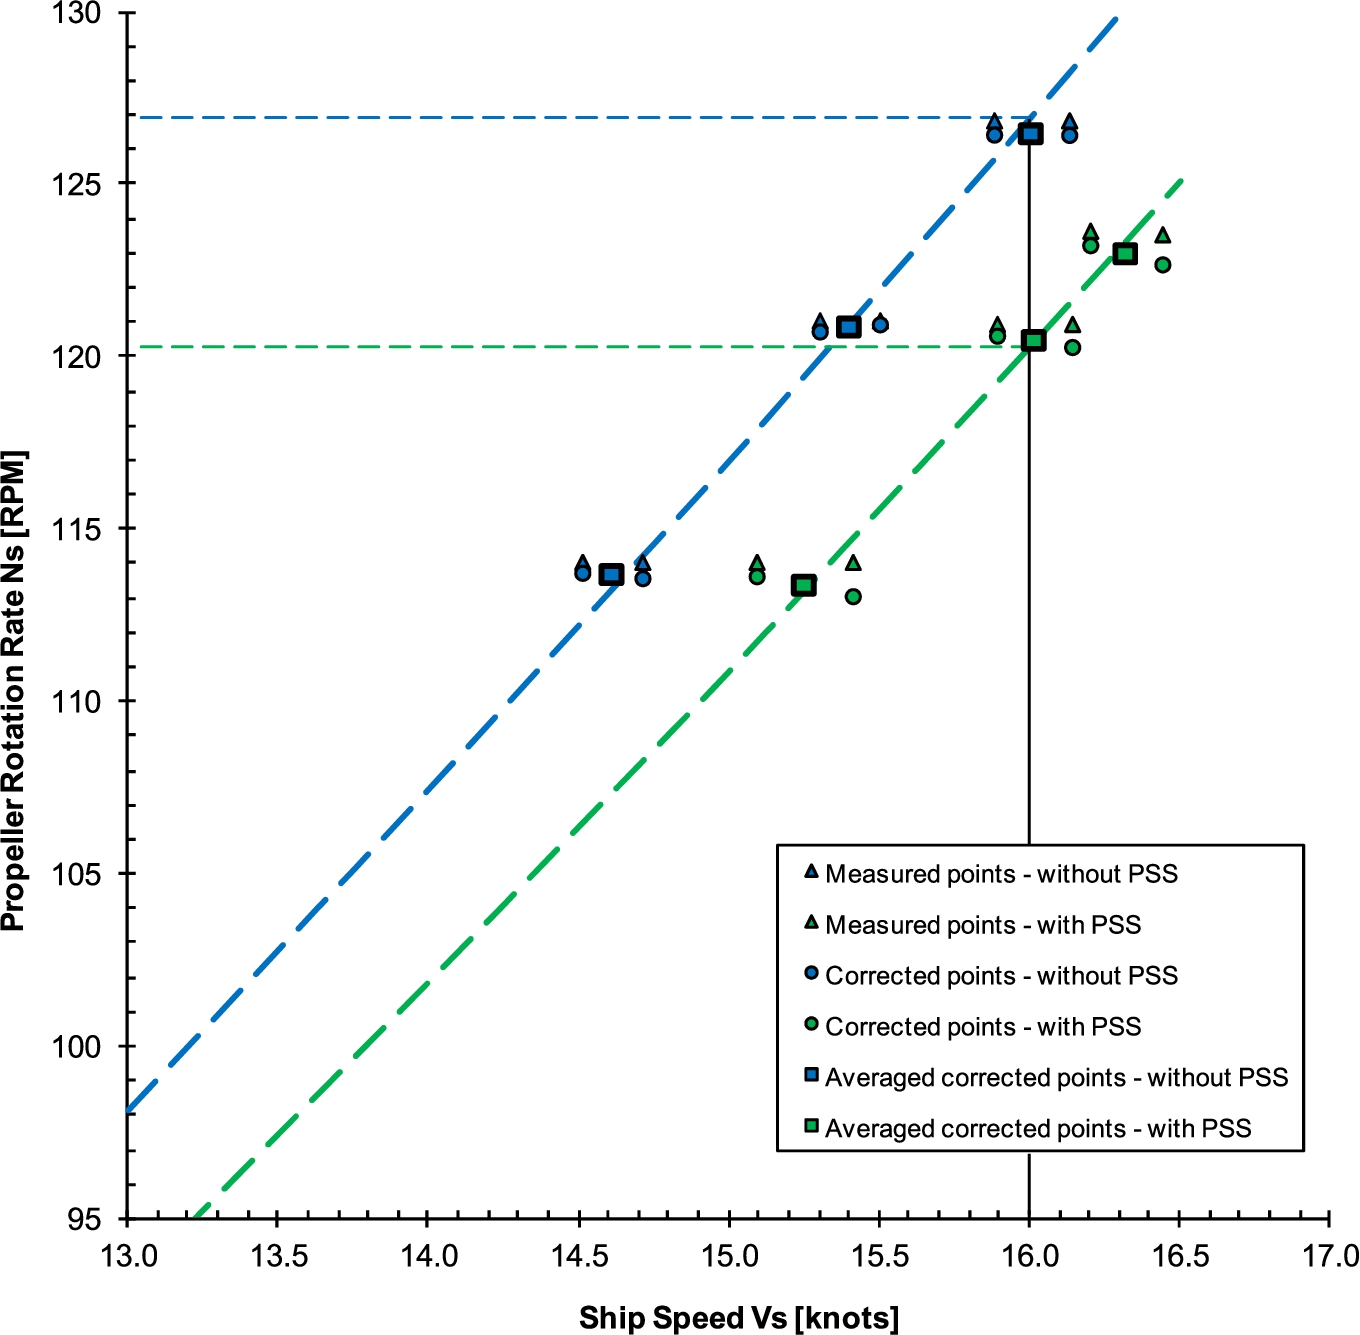
The uncorrected performance data has been analysed and corrected for the ideal weather and environmental conditions according to the ‘Direct power method’, described in [6]. The analysis has been performed using the IMO EEDI-certified program ‘STAIMO’ [7]. Both trial results have been corrected to no-wind, no-wave conditions and equal displacement. Corrections have been applied for wind, wave reflection and displacement differences. The difference in power at 16.0 kn between the two trials was 6.8% and is shown in Fig. 11. Exceptionally fair weather conditions and the use of the same instrumentation during both trials resulted in a low uncertainty due to measurement errors of
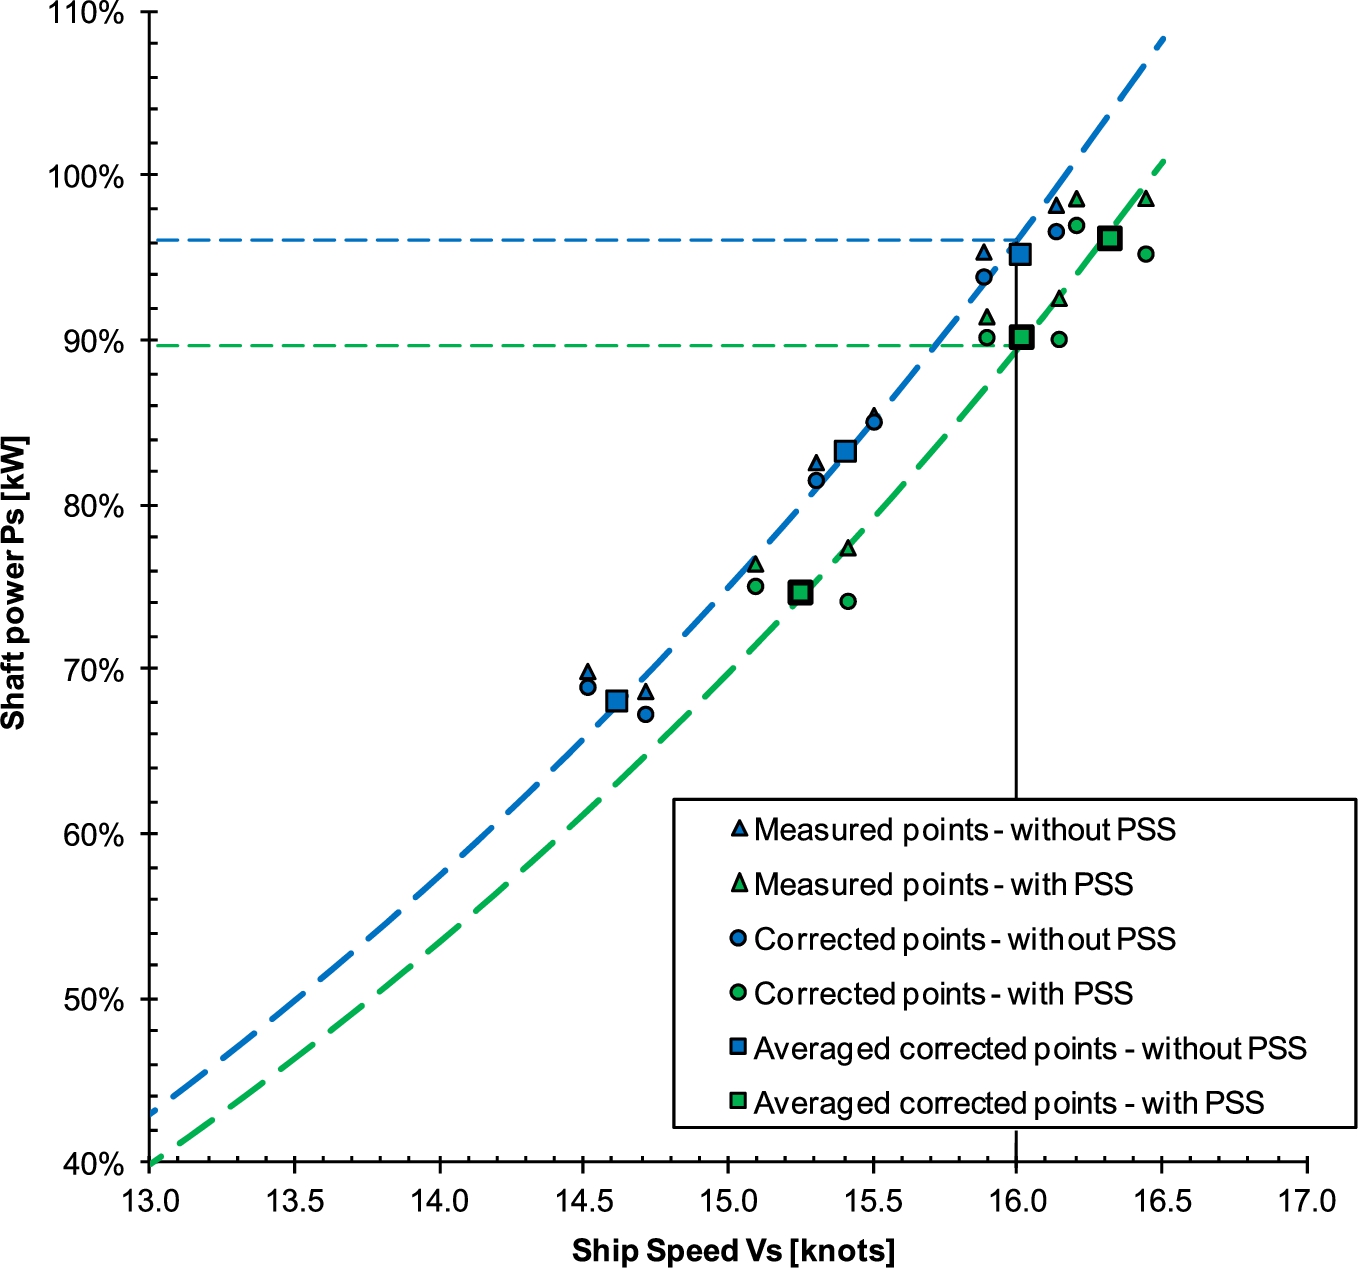
Speed-power relation for ship without and with Pre-Swirl Stator.
As a result of the PSS the propeller was higher loaded; the light running margin reduced from 5 to 2.6%.
The main objective of the trials without and with ESD was to evaluate the PSS design and performance predictions made by HSVA. In order to validate the CFD predictions the geometry of the PSS fins – as build – were determined using a 3D laser scan just prior to the second speed trial. It is often found that during manufacturing and installation the geometry and position of the stator is slightly different from the designed condition. The 3D laser scan, which showed some differences concerning fins’ longitudinal positions, twist and thickness, whereas the angular positions of the fins have been kept very well (see Fig. 12). Due to the geometrical differences, a direct comparison between the CFD results from the original geometry and the trial results becomes impossible. Therefore, a new CFD mesh based on the 3D in-situ geometry measurement was made.
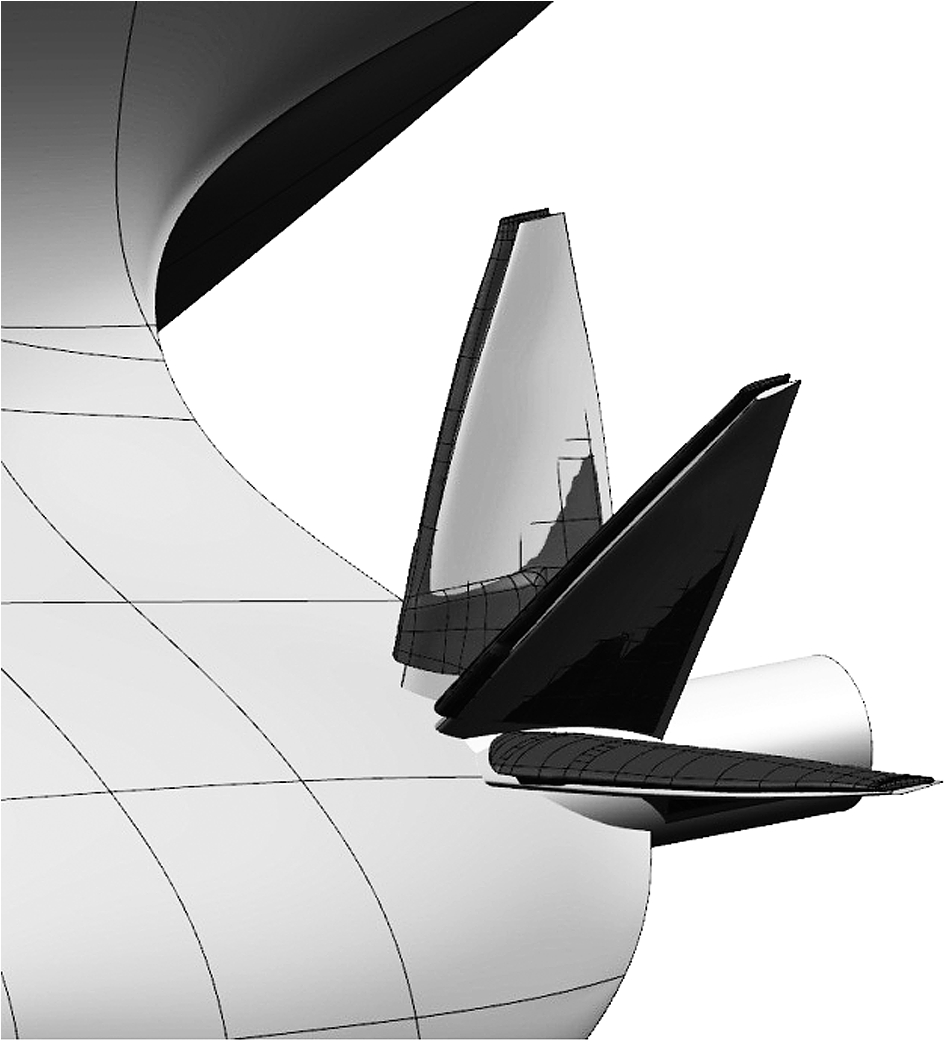
Comparison of the original CAD geometry of PSS (light) with the measured in-situ 3D model (dark).
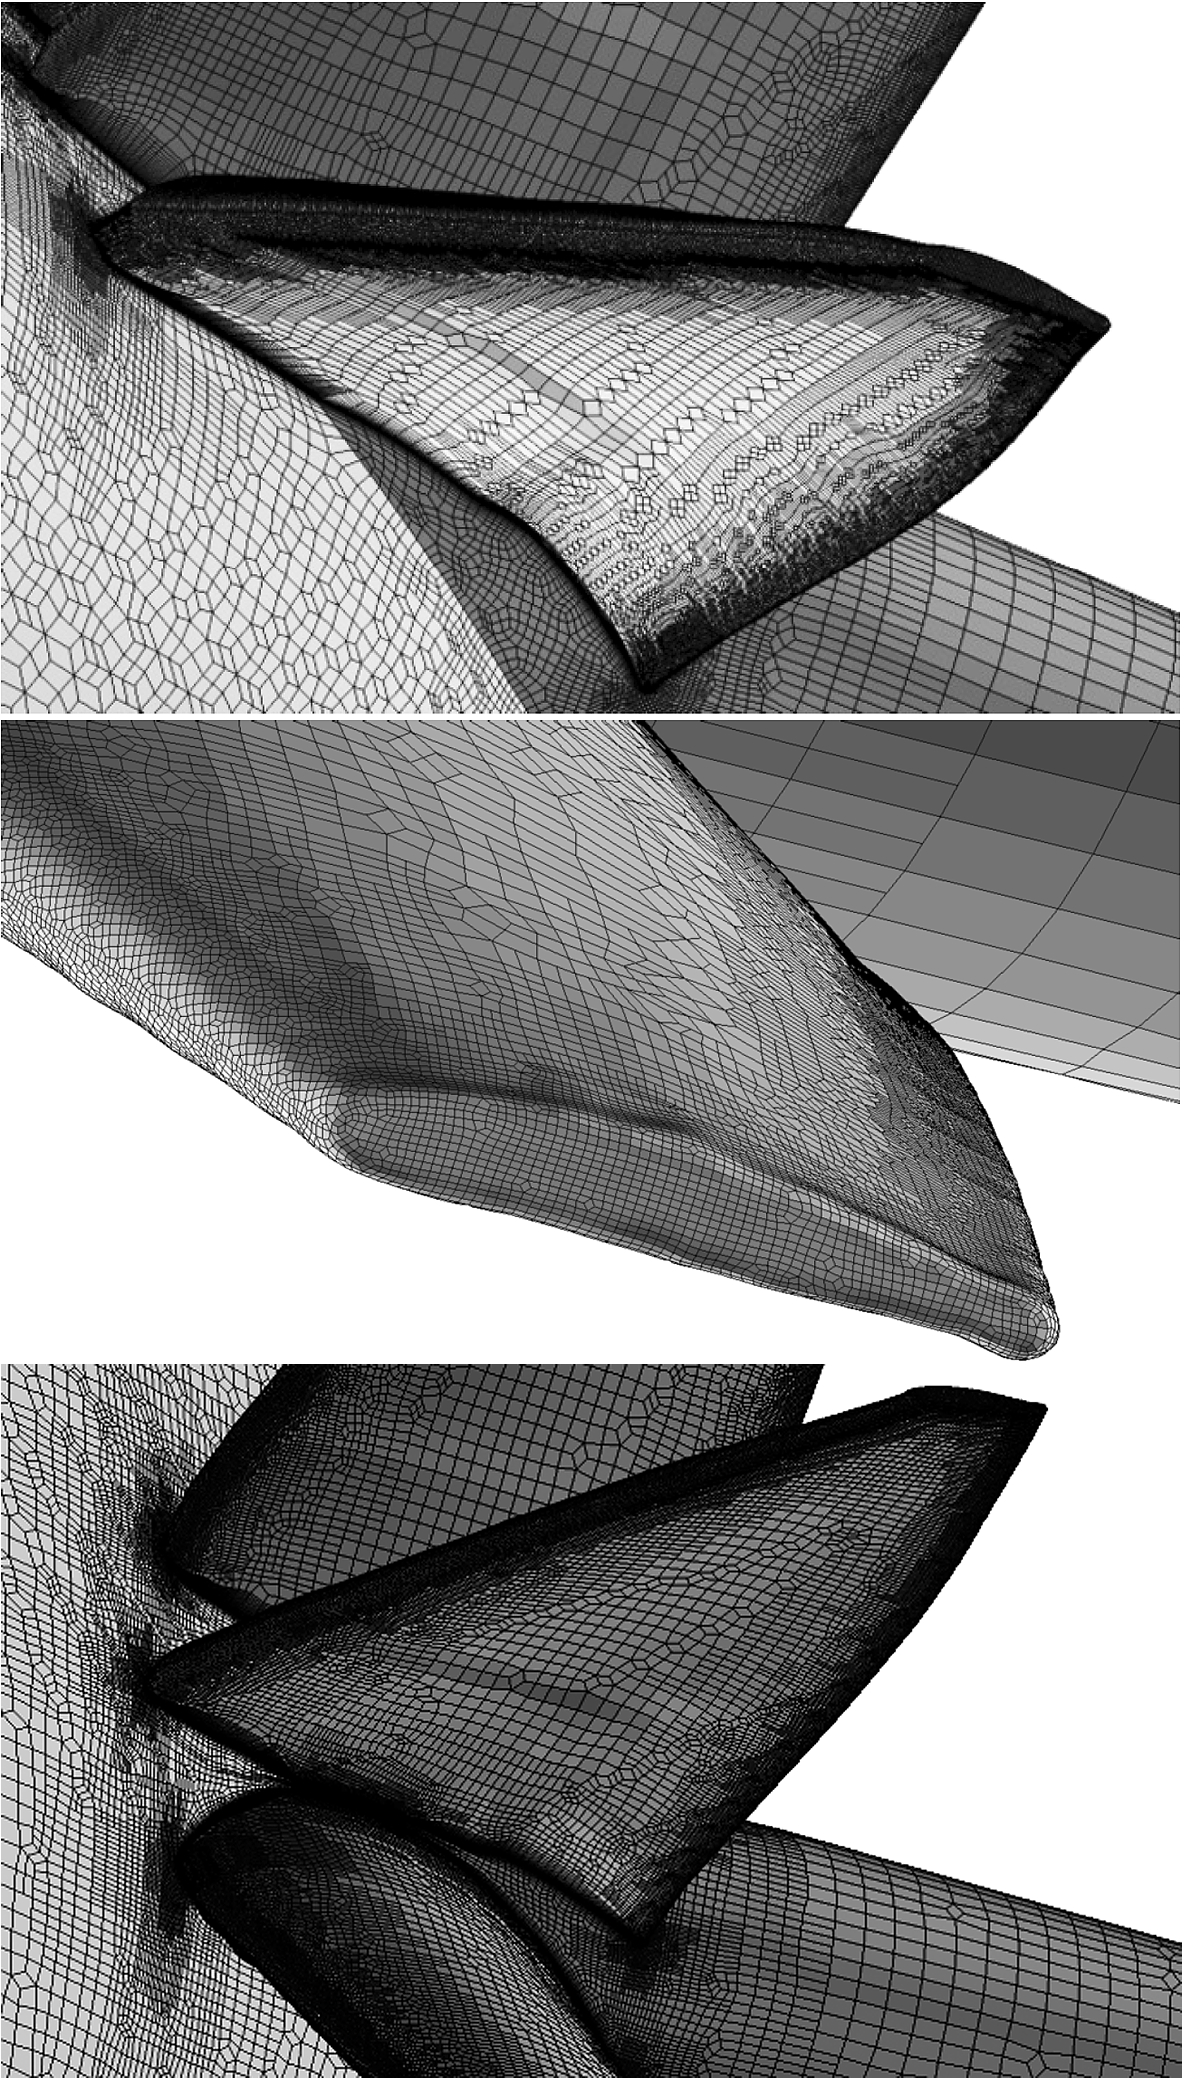
New generated CFD mesh based on the measured in-situ 3D model.
The numerical mesh generated for the 3D – as build – geometry has 11.2 Million cells. The new numerical mesh reflects the thickness increase on the pressure sides of the fins and shows the blunt tips from the building of the fins, see Fig. 13. Other numerical settings have been kept identical as in the CFD design phase, such as domain size and grid resolution, turbulence model (k-w SST), double body assumption and the RANS-BEM coupling for self-propulsion computations etc.
The predicted power-speed relations have been compared to the sea trial results for cases without and with the PSS respectively, shown in Fig. 14. As can been seen, the trends of both curves have been predicted by CFD very well, however there is still a certain gap in absolute power for both cases without and with PSS. And the effect of the PSS has been somewhat under-predicted by CFD when compared to trial results.
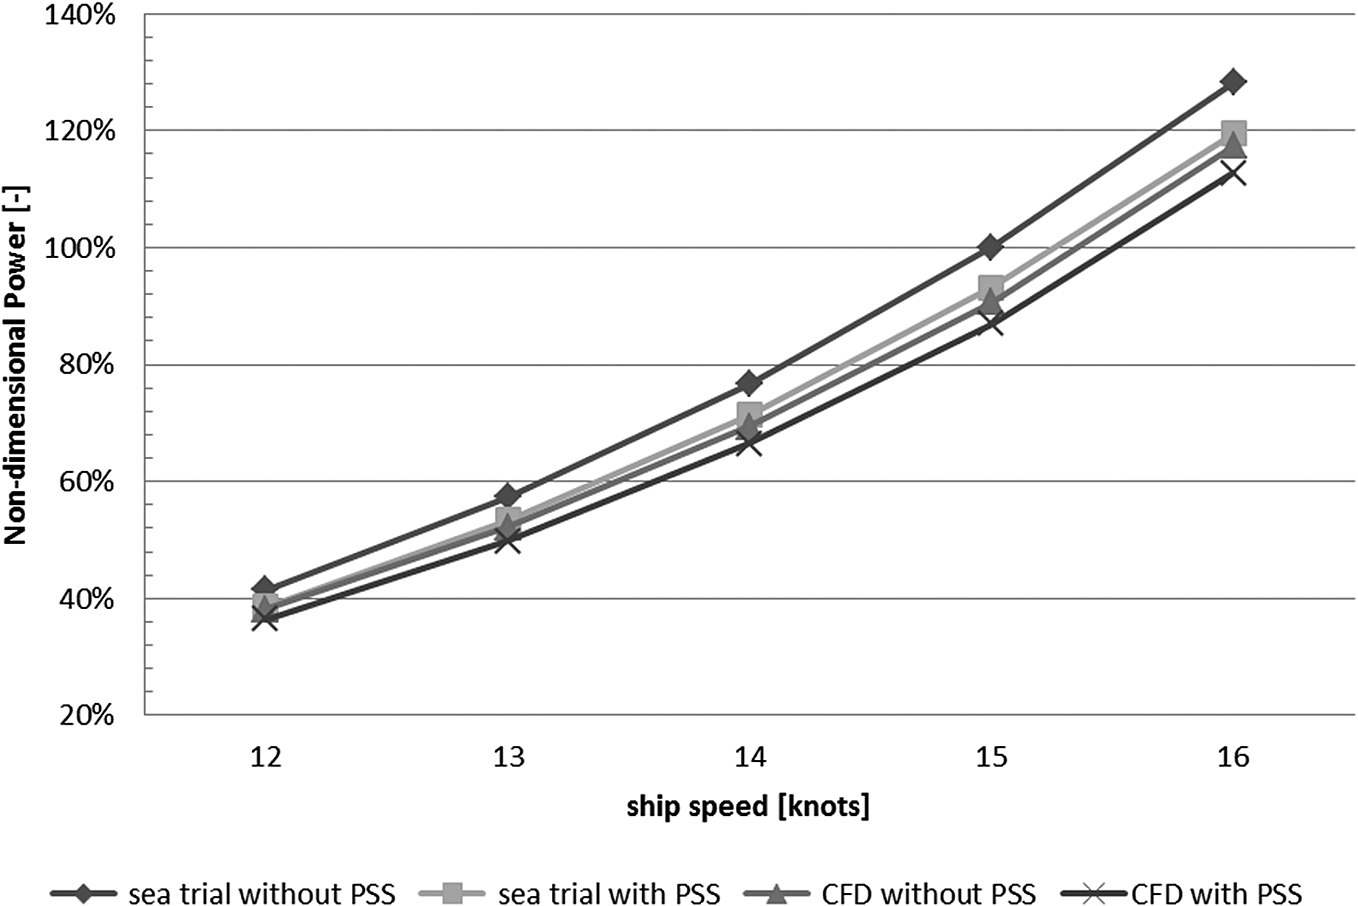
Comparison of speed-power relation between sea trials and full scale CFD predictions without considering the roughness of propeller blades.
Since double body assumption has been applied to all computations, there is no calm water wave resistance as the free surface deformation has not been included in the computations. The missing wave resistance can either be guessed empirically to be applied to the ship in self-propulsion computations or the computations without an ESD can be first performed with an estimated propeller rpm or thrust to get an appropriate loading of the propeller. The resulting unbalanced force between thrust and total resistance will correspond to the missing wave resistance and can be applied to the case with an ESD for a fair comparison. In this case, since the rpm of the propeller is known from sea trials, it has been taken directly from the trial results for the case without PSS. Therefore the under-prediction of the power finds its clue directly in the under-prediction of the propeller torque. Though there might be more sources for this under-prediction of the torque, one physical effect which has not yet been included in the CFD model is the propeller blade roughness. Even for a well-polished propeller, the blade surface is not ‘hydro-dynamically smooth’ as assumed in the current CFD simulations, when it is operating in full scale (high Rn Regime). Therefore, the blade roughness model has been included in the later computations with an assumption of roughness height of 30 μm according to the ITTC1978 method [8]. The differences in results are noticeable (see Fig. 15) and the relative error ranges of the prediction with consideration of propeller blade roughness are given in Fig. 16 for both cases without and with PSS. As can been seen, the deviation of delivered power between CFD prediction and trial results can be reduced when the propeller blade roughness is considered, which is below 8% in the whole speed range.
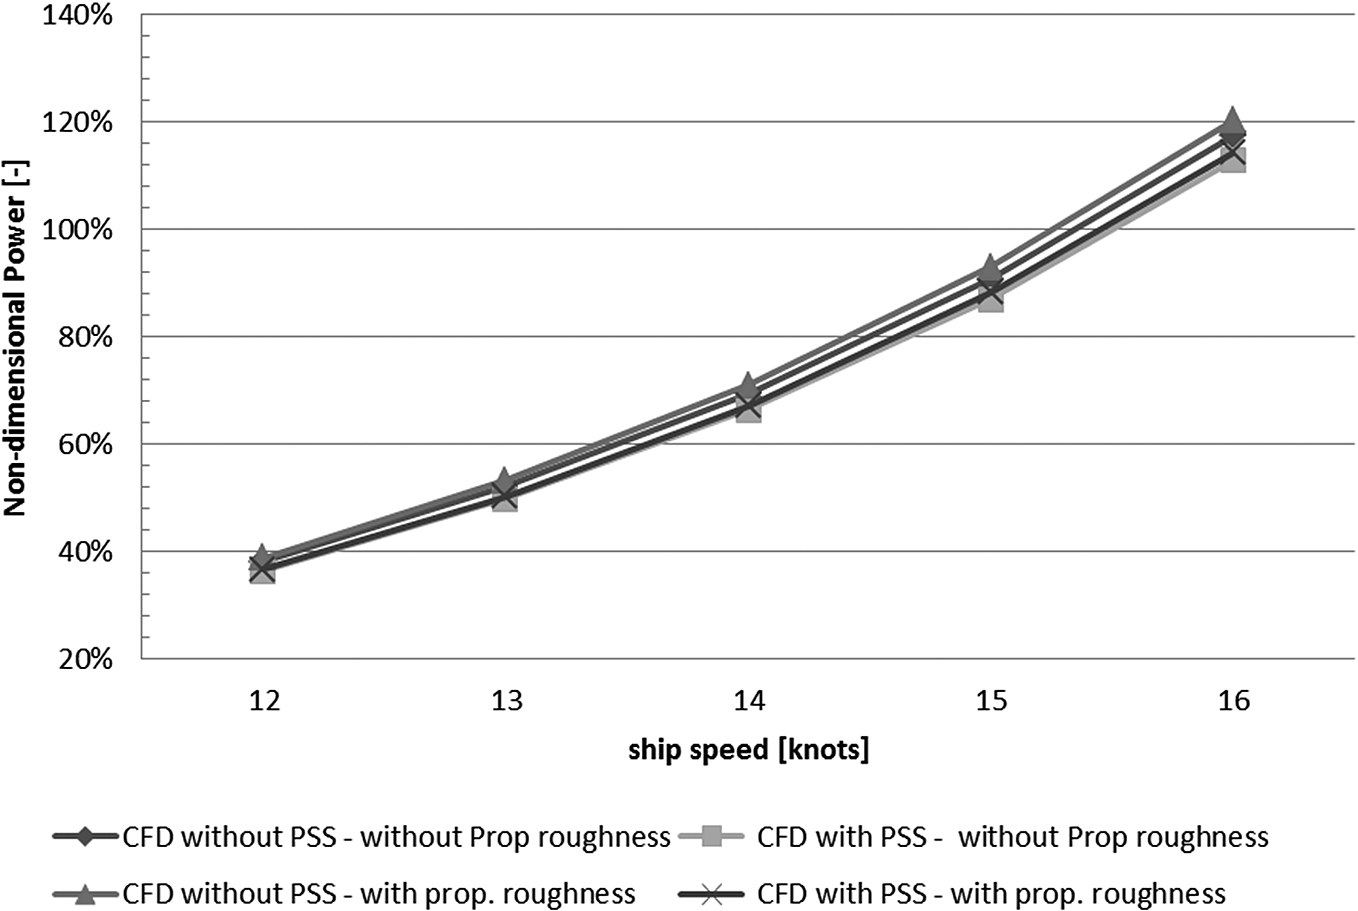
Comparison of speed-power relation between full scale CFD predictions without and with considering the roughness of propeller blades.
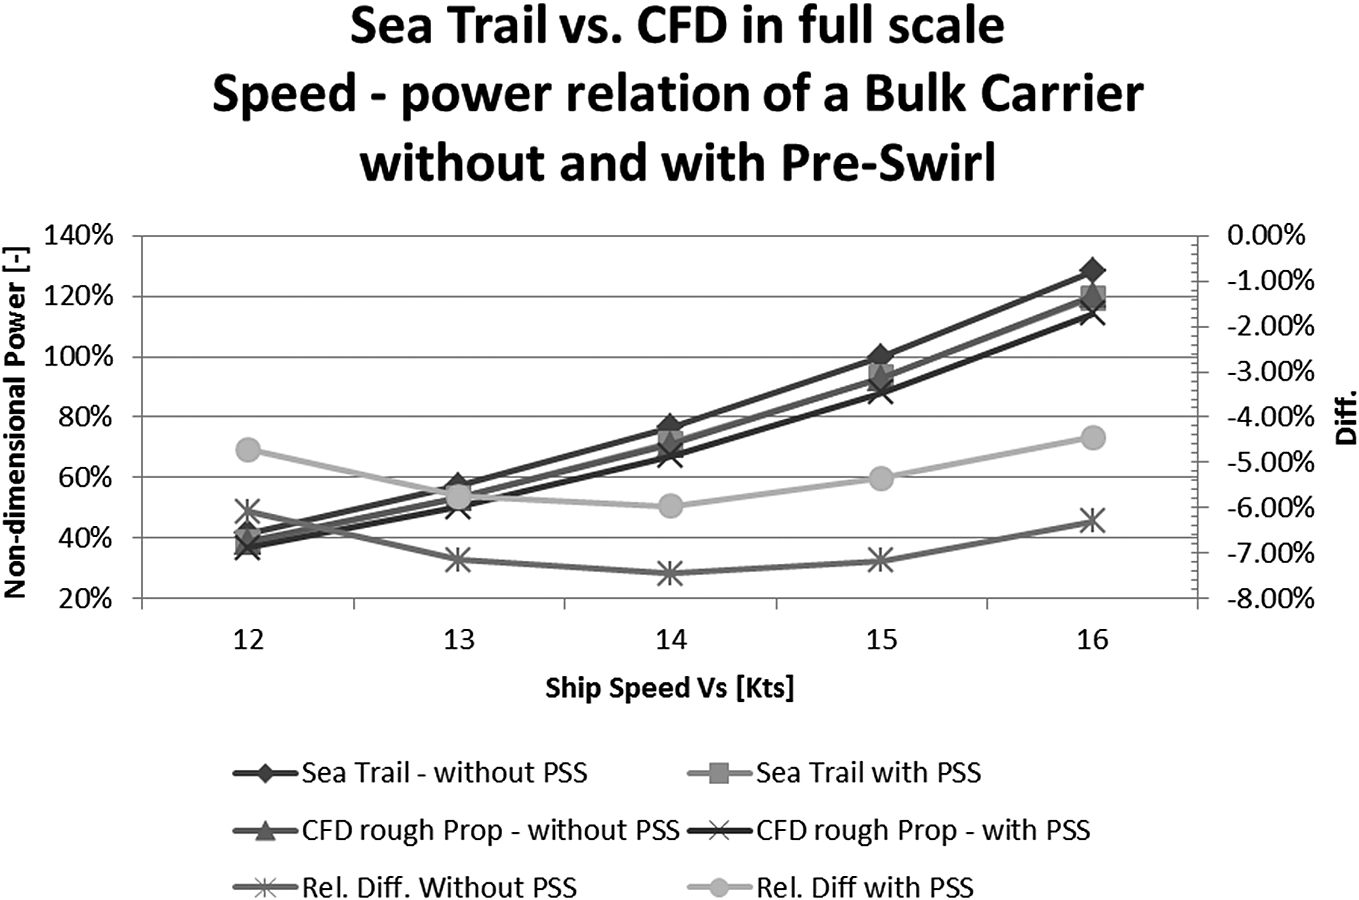
The error range of full scale CFD power prediction with consideration of the roughness of propeller blades.
Beside the absolute power prediction, the relative changes of power and rpm due to the installation of the PSS are of more interest in this study. Figure 17 shows the changes of shaft power, the propeller rpm and the torque for one ship speed in sea trial, full scale CFD prediction without and with considering the propeller blade roughness. It shows that the under-prediction of the PSS effect in CFD has been improved by considering the propeller blade roughness. Also the CFD prediction in reduction of propeller rpm is satisfactory. There are large errors in prediction of propeller torque. However improvement can be observed when the propeller blade roughness is taken into account.
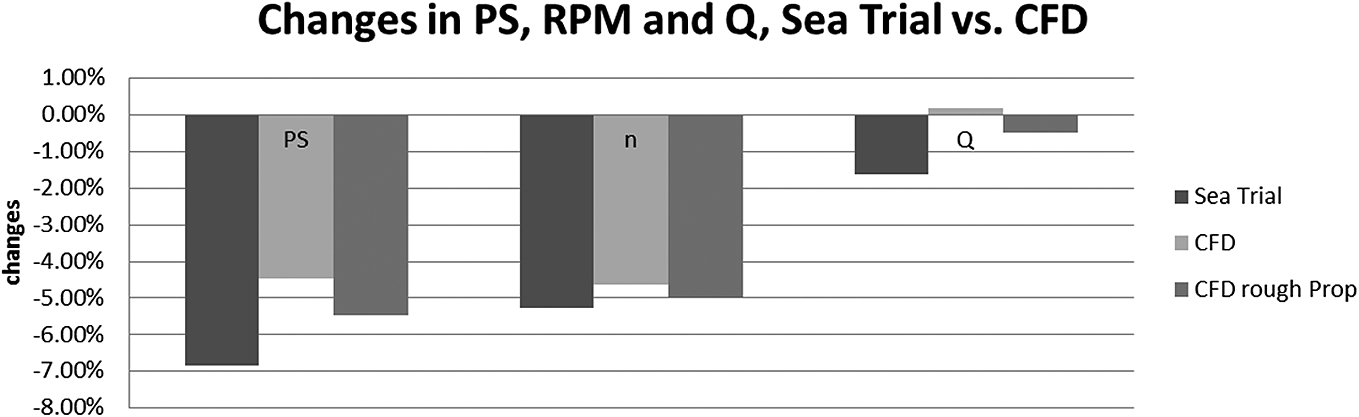
Comparison between sea trial and CFD results on changes of shaft power, propeller rpm and torque due to PSS.
Pre-ducts or pre-swirl stators which are attached to the hull can be considered as wake improvement devices. A wake field can be improved (equalised) either by acceleration of the axial flow where it was too slow, or by transforming the tangential flow where it was unfavourable making the propeller working more optimal and homogeneously. The objective of a pre-swirl stator is the latter, producing the pre-swirl where it is needed for the propeller to make the propeller loading more homogeneous and to minimize the rotational losses in the slipstream, while keeping the axial wake largely unchanged.
As an effect of the pre-swirl in the inflow to the propeller the tangential flow component
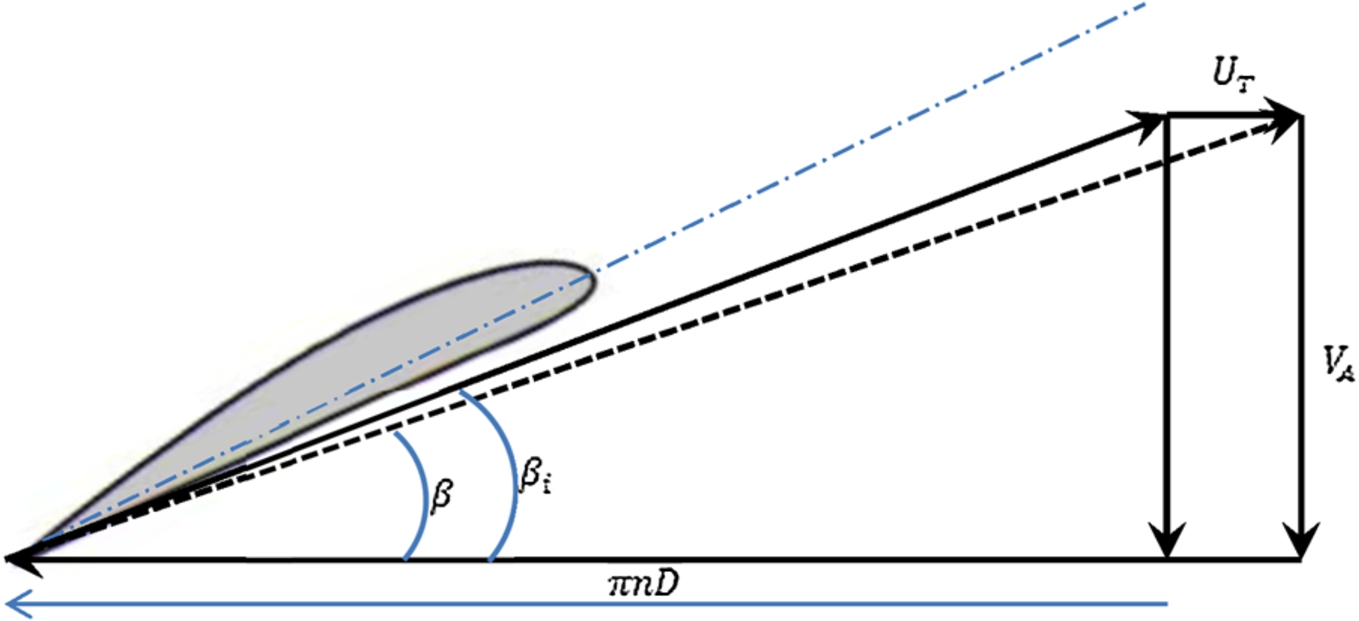
Effect of tangential flow on blade angle of attack.
RPM – Power relation of MV VALOVINE without and with Pre-Swirl Stator.
Figure 20 shows the tangential effective wakes from CFD computations for the cases without PSS and with PSS respectively. The difference between these two wakes has been plotted in Fig. 21: the tangential effective wake has been changed in positive sense in the whole propeller plane with the largest improvement in the port side behind the stator fins. The propeller loading becomes also more homogeneously. Figure 22 compares the nominated thrust distribution along the circumferential direction for cases without and with PSS. This shows that the fluctuation of the produced thrust during one blade rotation is much smaller with the PSS installed. An inspection on the thrust distribution in the propeller plane (Fig. 23) confirms that propeller loading becomes more homogeneously and higher loading found now in the originally poorly loaded region such as in the port side and in the hub vicinity.
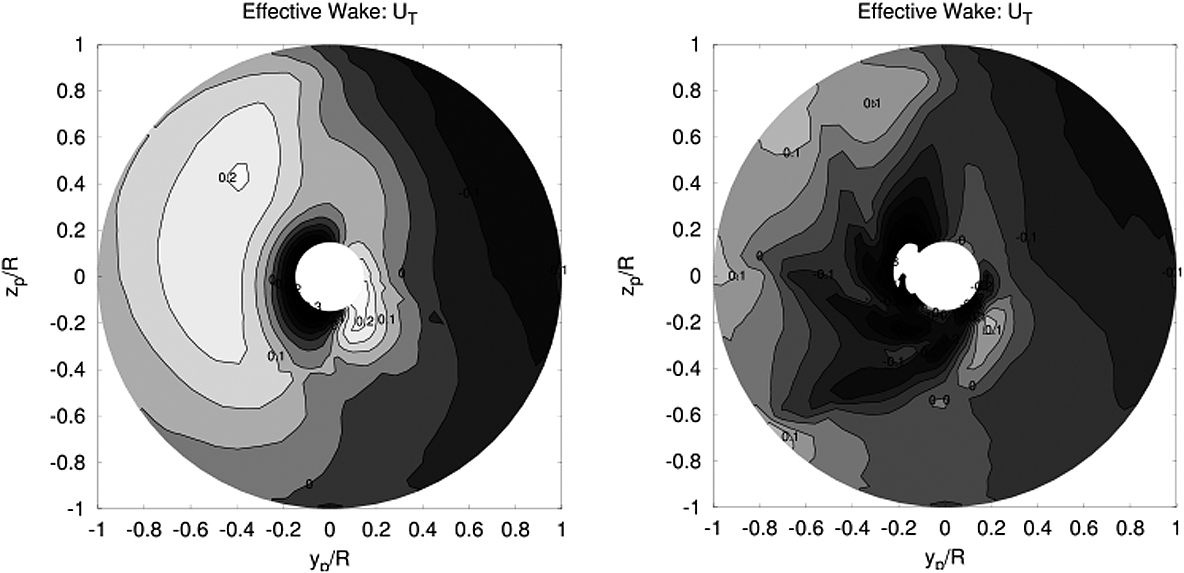
Tangential effective wake: without PSS (left) and without PSS (right).
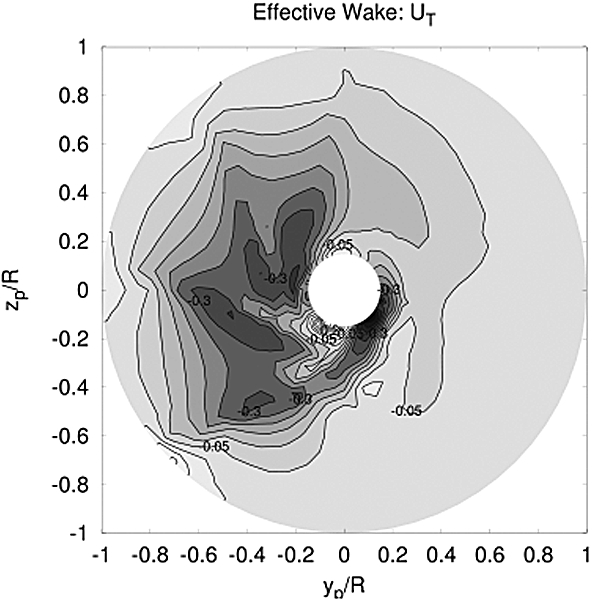
Changes of the tangential effective wake due to PSS.
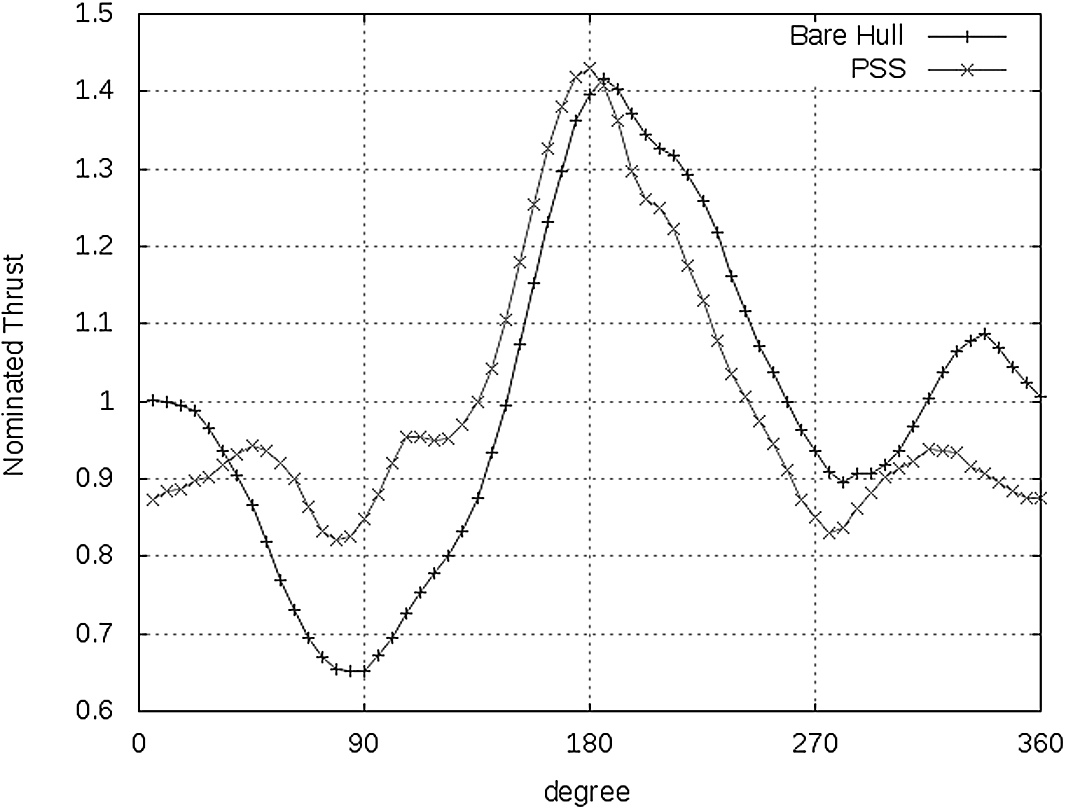
Comparison of nominated Thrust along circumferential direction for cases without and with PSS.
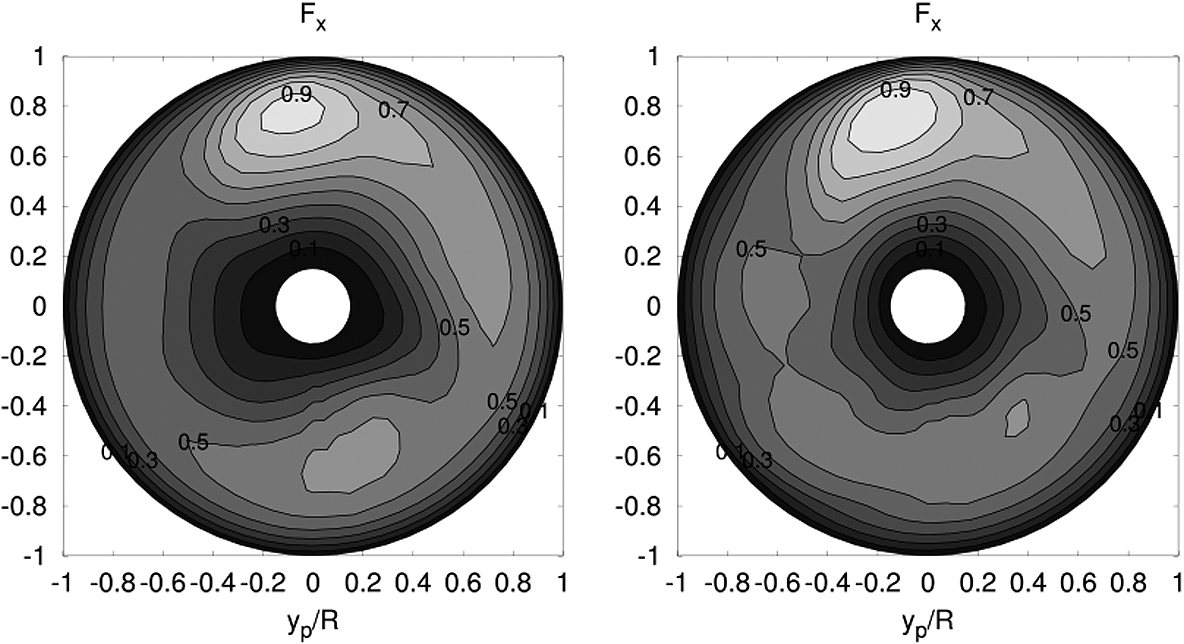
Comparison of thrust distribution on the propeller plane: without PSS (left) and with PSS (right).
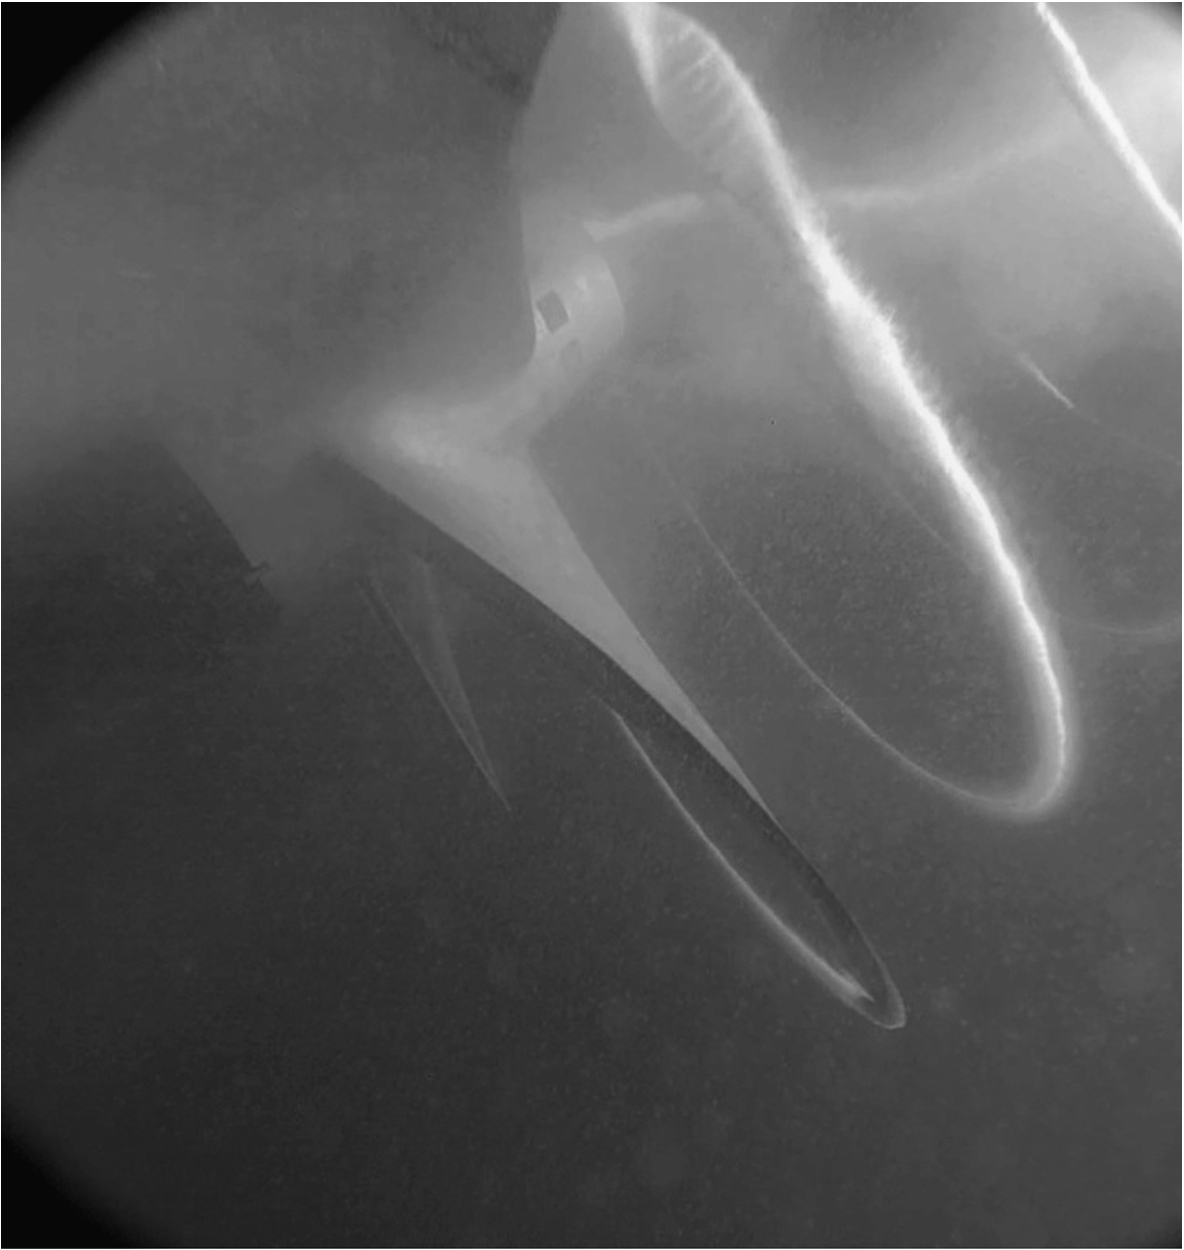
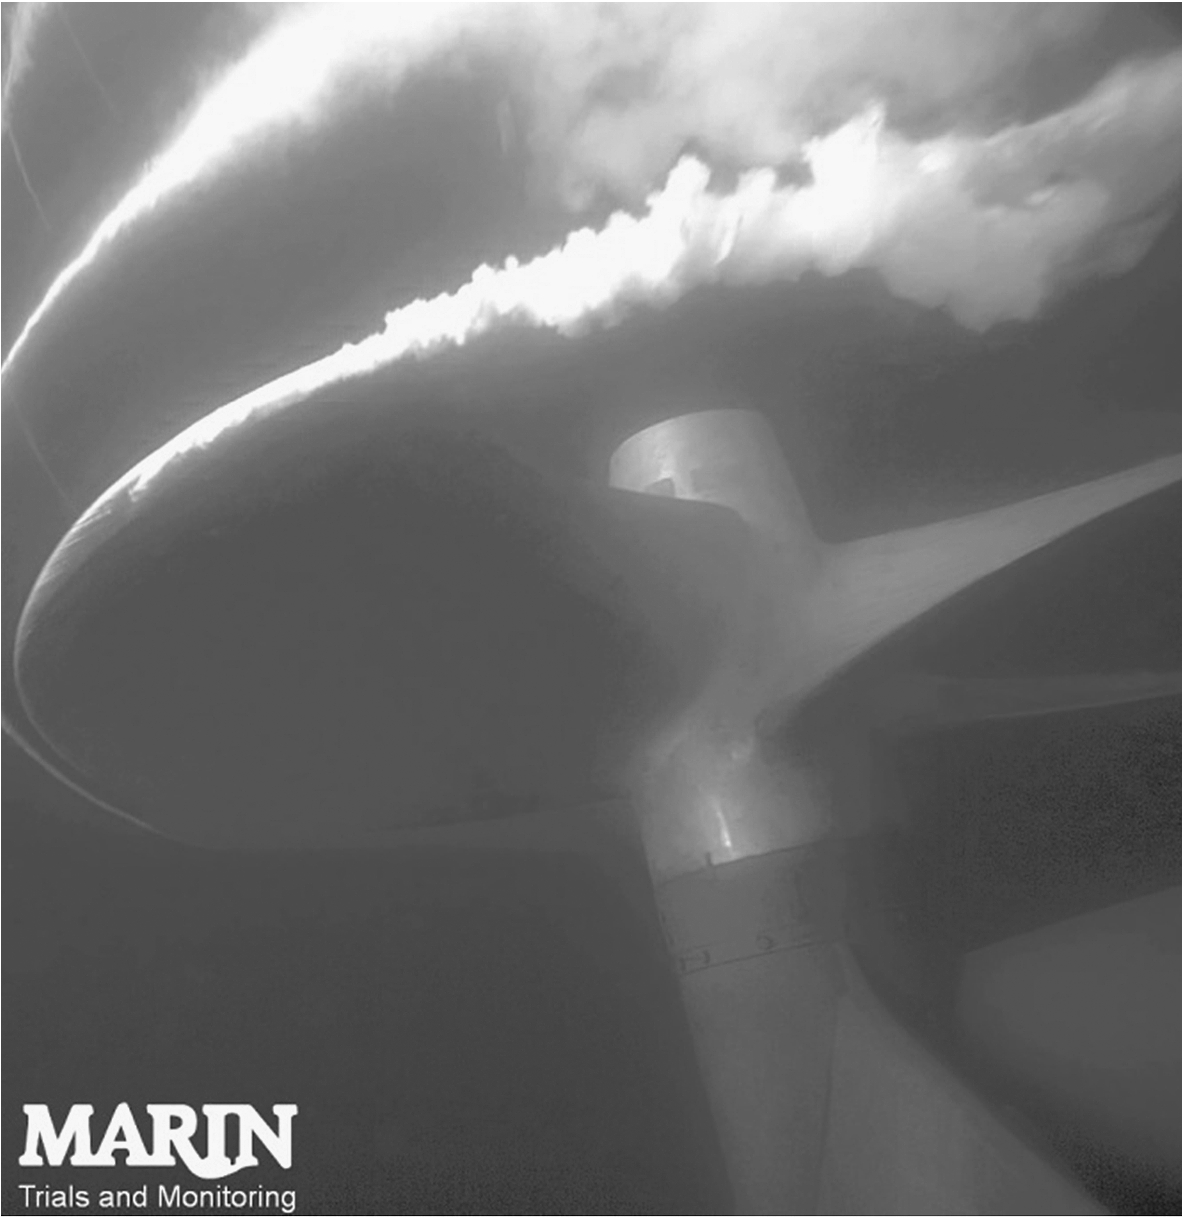
Propeller cavitation and cavitating hub vortex for ship without PSS.
Propeller cavitation for ship with PSS.
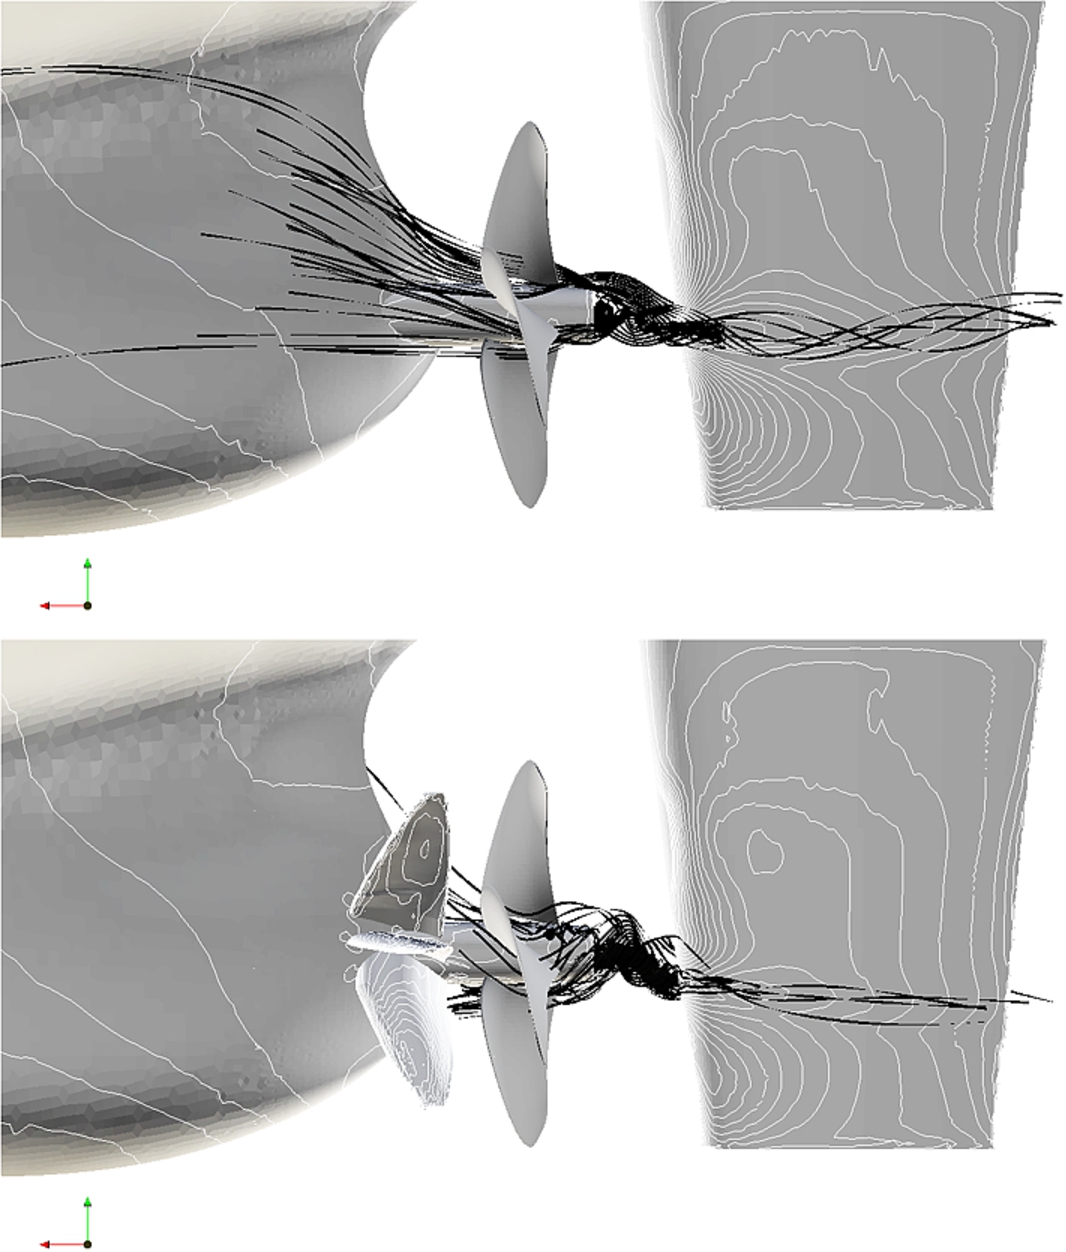
Streamlines passing through the propeller hub region and pressure distribution on the surfaces indicating a reduction of hub vortex due to PSS: without PSS (upper) and with PSS (lower).
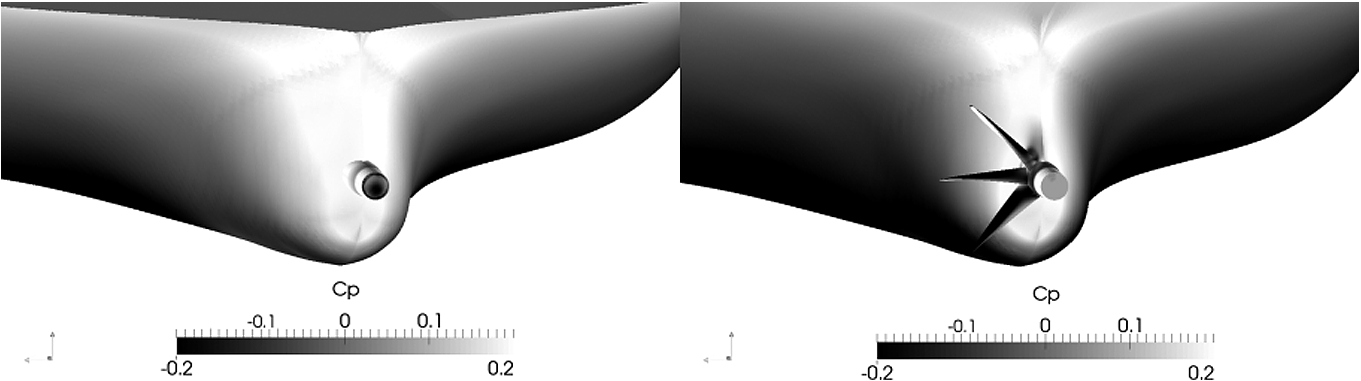
Pressure distribution on hull, hub cap and stator fins: without PSS (left) and with PSS (right).
Full scale cavitation observations were performed through cavitation windows installed directly above the propeller. Using a high-speed video camera successful observations were made during the speed trial at a frame rate of 1000 Hz. Figure 24 shows the propeller during 100% MCR sailing in a straight course in heavy ballast conditions prior to the installation of the ESD. The propeller showed suction side sheet cavitation and a clear cavitating hub vortex. Figure 25 shows the same condition but with the stator fins installed (a section of the fin is shown in the right bottom) of Fig. 25. For the whole speed range during trial with the ESD installed there was no cavitating hub vortex visible in the slipstream of the propeller.
The reduction of the propeller hub vertex can be confirmed by the full scale CFD simulations. Figure 26 shows the streamlines passing through the propeller hub region and the pressure distribution on the hull and rudder for both cases. For the case without PSS, a concentration of the hub vortex can be seen, which results in a low pressure region behind the hub on the port side of the rudder. A more detailed look at the pressure distribution on the propeller hub cap (Fig. 27) shows that the forces on the hub cap has turned from negative (resistance) to positive (thrust) due to the presence of the PSS. The reason why the PSS reduces the hub vortex can be traced back to the strong inflow modification of the PSS in the propeller hub region. With a certain amount of pre-swirl in the propeller inflow, the low radius loading of the propeller became more optimal leading to a reduction of hub vortex loses. A more detailed explanation it can be found in [13].
Conclusions
Speed/power trials are often used to evaluate fuel performance differences between vessels. When relatively small differences are to be evaluated, special attention should be paid to the uncertainty during trials. A sensitivity study for a bulk carrier revealed that large uncertainties in shaft power measurement and sister ship performance differences due to yard uncertainties require performance evaluations of an ESD to be done on a single vessel. The ESD should be installed in an additional docking whereby the trials prior to and directly after the installation of the ESD are performed. Additional uncertainties during the execution of trials are the corrections to no-wind, calm water and equal displacement condition. Typical measurement errors result in uncertainties in the order of 1 (BF3)–3% (BF5) per trial. For reliable ESD performance evaluations trials should therefore be ideally done in calm weather and sea conditions at high engine power settings to reduce the influence of measurement errors on the shaft power.
The pre-swirl stator fins designed within the GRIP project have successfully been evaluated using such trials on a handymax bulk carrier. Due to exceptionally good weather conditions, an extra dry dock for the retrofitting of the ESD, use of same instrumentation and trial team, a reliable trial comparison could be made for the ESD. A fuel saving effect of more than 6% was identified with an estimated 95% confidence interval of
The full scale trials have been used to evaluate the ESD design using CFD. Full scale measurements were made using a 3D laser measurement system to determine the as-build geometry. Using this geometry full scale self-propulsion CFD computations have been performed. Both the absolute power prediction and the power reduction due to PSS showed small offsets with the trials. Successful reduction of the under predictions of the CFD calculations could be achieved by taking the propeller blade roughness into account. The final fuel saving effect was calculated to be 5% by CFD, using a RANS-BEM coupling method. The reduction of the hub vortex found in trials through underwater cavitation observations has been confirmed by the CFD results.
Footnotes
Acknowledgements
This research is partly funded by the European Union under the 7th Framework Programme (FP7) under Grant Agreement 284905. The success of these trials would not have been possible without the support and good collaboration of the ship’s crew and engineers at Uljanik Shipyard. The 3D laser scan measurement has been performed by the project partner IMAWIS, making the CFD simulations based on an in-situ 3D model possible.