
Abstract
Background:
In order to design an Energy Saving Device (ESD), shipyards need to know the forces applied on the structure.
Objectives:
The objective is to develop a methodology able to evaluate the forces applied on an ESD in navigation conditions.
Methods:
From existing hydrodynamic potential codes, such as HydroStar, and tools developed by Bureau Veritas, the forces applied on an ESD have been evaluated and the methodology has been tested on a Pre-Swirl Stator structure.
Results:
The design process for an ESD has been described and tested including static analysis, dynamic analysis and fatigue analysis.
Conclusions:
The forces applied on an ESD can be estimated following a design process and a methodology developed in GRIP.
Introduction
Nowadays, the Energy Saving Device (ESD) structure is not reviewed by classification societies. Only its attachment to the hull is considered. From a safety point of view, it is important to demonstrate that the ESD does not represent any hazard for the structural element on which it is mounted and for other neighboring hull outfitting.
The main challenge is to evaluate the loads applied on the ESD structure in sailing conditions, because the regulations give no guidance to validate its design. In order to estimate these dynamic loads, Bureau Veritas has developed a methodology to define the maximum forces expected to be applied on an ESD for given wave conditions and return period.
The aim of this document is to introduce this new methodology developed in the framework of the EU Funded GRIP Project and its application on a Pre-Swirl Stator (PSS) installed on a bulk carrier during the project.
Ship Motions Methodology
The Ship Motions Methodology (SMM), developed in order to estimate the loads induced by the ship motions, is divided into 3 steps:
The first one consists in potential hydrodynamic computations for a given ship speed. For this first step, the ship hull meshing, the ship speed and the draught (depending on the ship loading case) are needed as inputs. The outputs of this step are the RAOs (Response Amplitude Operator) calculated for all the ship motions and for all the wave headings. The second step is a spectral analysis using the sailing wave scatter diagram and a selected return period. The output is the Equivalent Design Wave (EDW) for a target RAO which is the angle of attack of the fluid relative to the ESD calculated in step 1. The final step is the use of a transfer function to transform the spectral analysis into time analysis. From the lift and drag coefficients of the ESD and fluid velocities around the ESD, it is possible to compute the lift and drag forces applied on it.
Step 1: Hydrodynamic computations
The potential code HydroStar has been used to perform the hydrodynamic computations, see reference [4].
HydroStar is the hydrodynamic software developed by Bureau Veritas that provides a complete solution of first order problems of wave diffraction and radiation. It also gives the QTF (Quadratic Transfer Function) of second order low-frequency wave loads for a floating body with or without forward speed in deep water and in finite water depth.
HydroStar uses Newton’s second law to describe the motions of floating bodies. The following motion equation is derived:
After the hydrodynamic computations, HydroStar is able to generate different transfer functions as Response Amplitude Operators (RAO) of displacements, ship motions, accelerations or fluid velocity at any point.
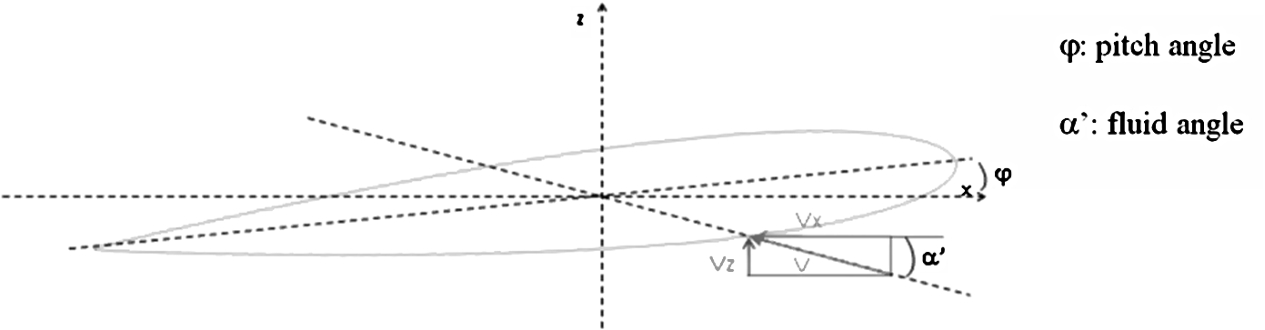
Fluid angle of attack.
The fluid velocity RAOs are used in the SMM to assess the fluid angle for a given profile because the fluid velocity is characterized by:
And the angle of attack α for a profile is defined as follows, see Fig. 1:
From this RAO and the lift and drag coefficients of the ESD, it is possible to define the lift and drag forces applied on the ESD for a unitary spectral wave. However, in order to extrapolate these results in real sea states, a spectral analysis is to be carried out.
Additionally, the setting angle (σ) of the ESD, including the trim angle, should be considered as constant values for the determination of the total angle of attack.
The spectral analysis is performed using the software Starspec developed by Bureau Veritas. Starspec is a spectral analysis software that performs short and long term response analysis, see reference [7].
The JONSWAP (JOint North Sea Wave Project) wave spectrum is used for this step. It represents the wind-generated seas with fetch limitation. The formulation is more general and includes the Pierson Moskowitz spectrum as a particular case.
The spectral density γ is the peak-enhancement factor ( σ is a relative measurement of the width of the peak; and
The spectral density
A wave scatter diagram is a description of the joint probabilities of the wave heights and the wave periods. This description is made for a given geographical area. Usually, there is no information about the direction of the waves. The scatter diagrams are usually based on visual observations and hindcast data, which are merged and extrapolated using some analytical functions.
The Global Wave Statistics atlas gives some scatter diagrams for 104 areas in the world, including some seasonal and directional information.
In order to take into account the operational speed profile of the ship, the scatter diagram is to be divided into several parts where the ship’s speed is adapted to the wave height.
For example, in the application case presented in Section 3, the North Atlantic scatter diagram has been selected and split following the ship operational speed profile below:
Wave height [0 m; 5.5 m] and ship speed 15 knots; Wave height [6.5 m; 14.5 m] and ship speed 10 knots; and Wave height [15.5 m; 21.5 m] and ship speed 5 knots.
Step 3: Transfer function
Step 3 consists in transforming the frequency domain results into the time domain to estimate the forces and to generate the design wave that will be used later for CFD computations.
The objective is to simplify the sea state to obtain a representative sea state leading to the same ESD strength. In this study, the design wave is generated to maximize the angle of attack of the ESD.
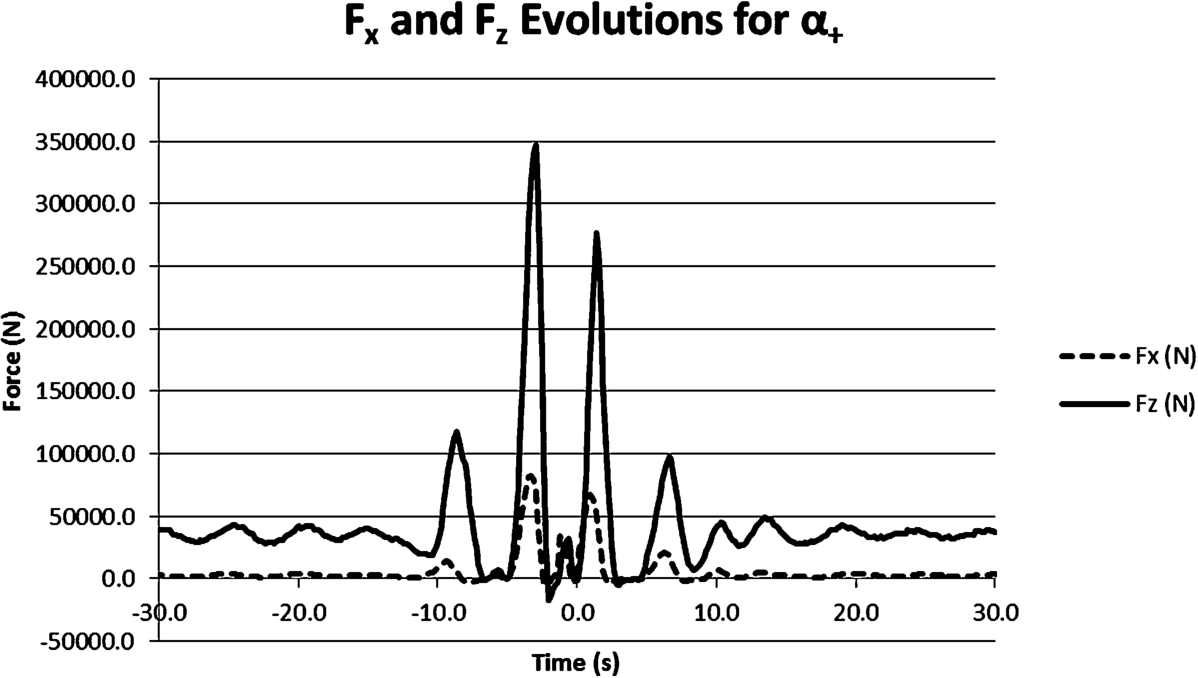
Starspec is able to calculate the design wave for the angle of attack RAO and associated Load Combination Factor (LCF) for the fluid velocity RAOs and pitch, yaw and roll RAOs. However, it is needed to study the symmetric wave leading to the minimal angle of attack (which could be the maximum one in absolute value). For this reason, two angles of attack are computed:
Two types of design wave can be generated, a Regular Design Wave (RDW), defined by its height
The design wave is defined to perform CFD computations in the worst sea-state leading to the maximum forces applied on the ESD.
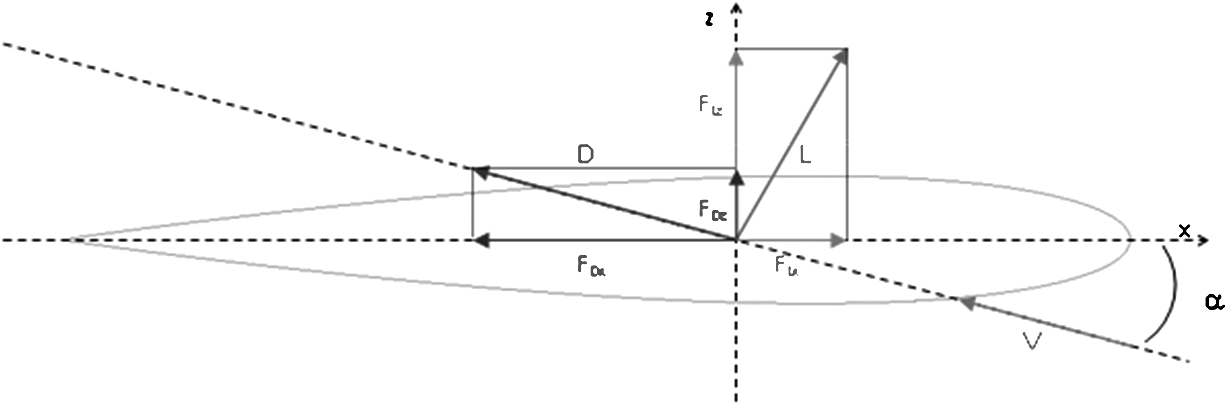
Lift and drag forces.
From the LCF results and with the lift and drag coefficients, it is possible to determine the lift (L) and drag (D) forces applied on a profile, see Fig. 2, with the following equations, references [2] and [3]:
ρ: water density = 1025 kg/m3; S = profile area in m2; V = fluid velocity in m/s;
The lift and drag coefficients are to be determined by CFD computations or, in case of typical shape as NACA profile, values are known.
The lift and drag forces are computed in the profile coordinate system depending on the angle of attack α and are to be expressed in the global coordinate system to simplify the strength analysis. The horizontal and vertical forces used for the analysis are:
Application case on a Pre-Swirl Stator
The following section deals with the computations (static, dynamic and fatigue) performed on a Pre-Swirl Stator designed in the GRIP Project framework and installed on a bulk carrier during the project.
Introduction
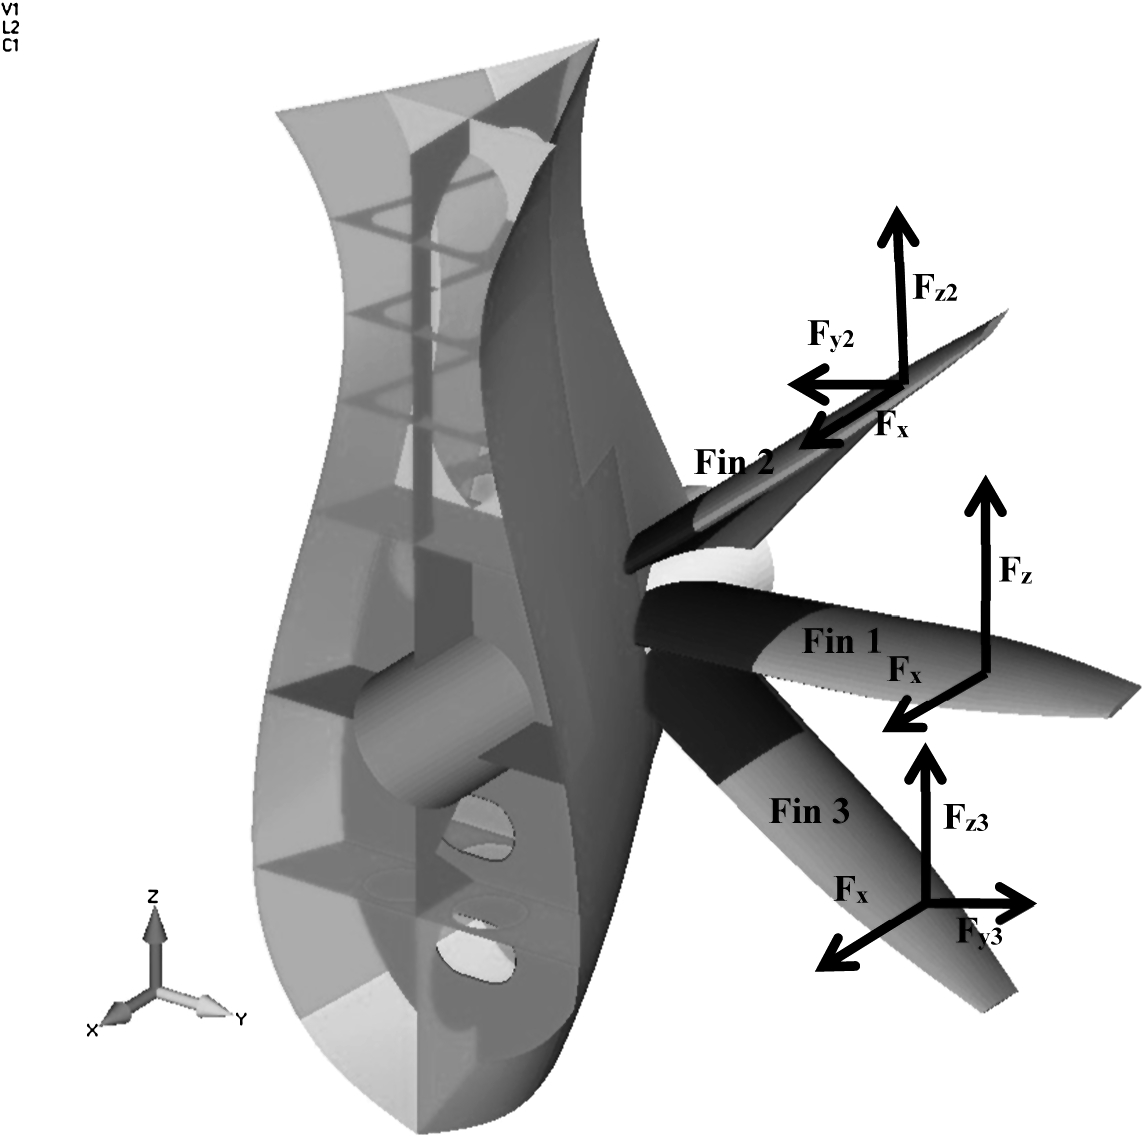
The PSS shape has been defined in the GRIP Project by HSVA and the design has been provided by Uljanik Shipyard. The PSS is composed of 3 fins installed in front of the propeller and welded on the stern tube and the hull. The PSS is fitted only at the port side as indicated in Fig. 3.
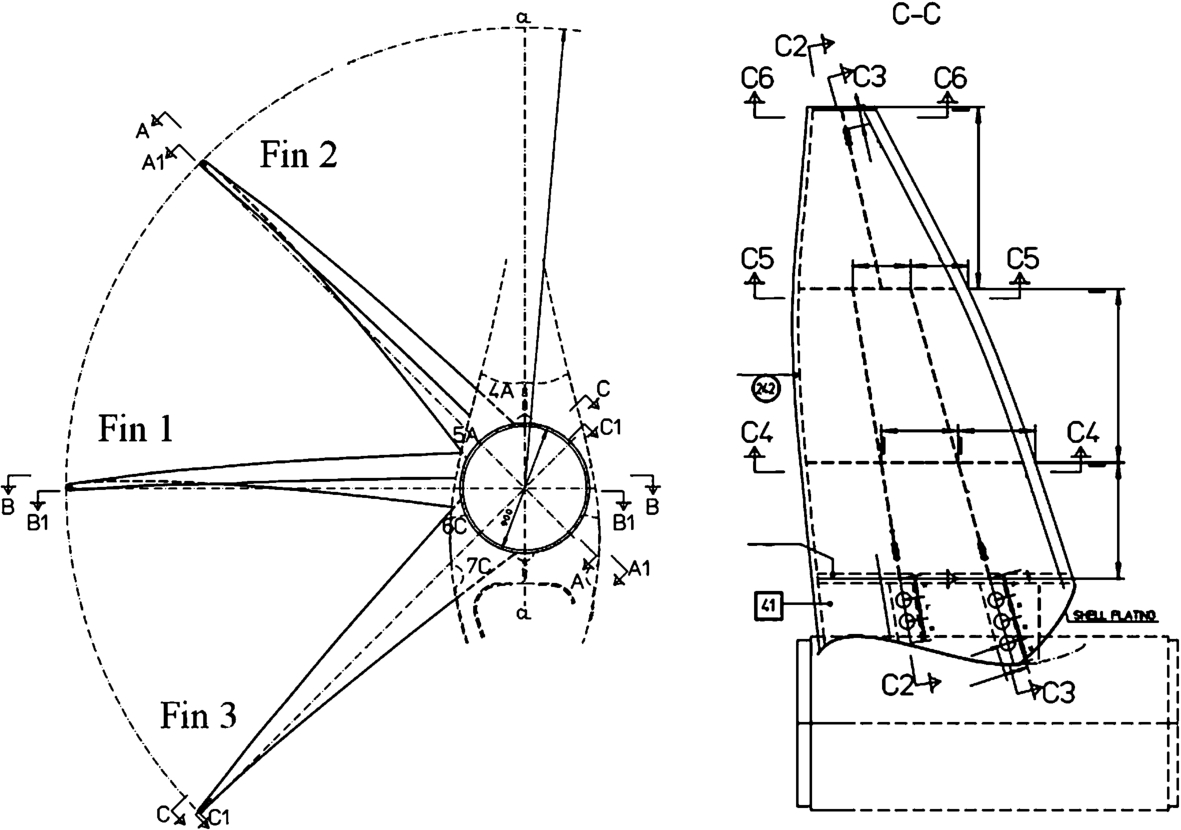
Pre-Swirl Stator structure.
The PSS has been installed on a bulk carrier built by Uljanik Shipyard whose dimensions are presented in Table 1.
Technical bulk carrier properties
Forces evaluation
In order to estimate the maximum forces applied on the Pre-Swirl Stator, following the methodology presented in Section 2, hydrodynamic computations with HydroStar have been performed considering 2 loading cases, ballast and full loads, and 3 ship speeds. The forces have also been determined for every fin: Fin 1, the horizontal fin; Fin 2, the upper fin and Fin 3, the lower fin, and at 3 positions along the fins, at the tip, at the middle and at the root of each.
The computation consists in calculating the maximum lift and drag forces, to identify the wave condition leading to these maximum forces in order to provide the inputs for the CFD simulations. In total, 54 calculation cases have been performed to evaluate the worst sea state condition leading to maximum forces on the fins. For each calculation case, the
The maximum forces have been computed for the ballast case, 15 knots ship speed and at the middle point of the upper fin (fin 2).
The maximum forces applied on the upper fin for the ballast load case at 15 kn are:
The corresponding sea state, i.e. the Equivalent Design Wave, has the following properties:
Finite Element Analyses have been performed to validate the scantling defined by the shipyard, using the loads obtained with the SMM.
FEMAP has been used for the model construction and the post-processing of the results. NASTRAN has been used to solve the problem.
The following properties have been applied for the steel material:
Young’s modulus: 210 000 MPa; Poisson’s ratio: 0.3; and Yield stress: 235 MPa.
In order to take into account the corrosion phenomenon, a 1 mm thickness reduction has been applied on all elements of the model.
View of the Finite Element Model and of the loadings.
The model, see Fig. 5, is made of:
56 306 elements; 54 329 nodes; and 24 534 degrees of freedom. From propeller to frame 13; From base line (BL) to 7.1 m/BL; and From starboard to port side.
To consider the fin connection stiffness in the computation, the aft part of the ship has been modelled:
All nodes at frame 13 and at 7100 mm/BL are considered clamped.
The Finite Element models have been loaded with nodal forces distributed on the bottom skin between two transversal stiffeners, section C4 and section C5. Forces, provided by the SMM, have been applied as indicated in Fig. 5.
The scantling has been reviewed according to Bureau Veritas NR467 – Rules for the Classification of Steel Ships, reference [6].
The allowable stresses are computed in accordance with part B, Chapter 7, Section 3, with the following equation:
The computed Von Mises stresses are less than the allowable stress
The maximum Von Mises stress computed is less than allowable stresses.
Conclusion
The complete connection of the fin to the stern tube allows to ensure a structural continuity and all strengths go through the hull. Accordingly, no hot spot stress has been observed at the connections, and all computed stresses are below the allowable stresses.
Vibration analysis
Analytical approach
In a first stage, analytic calculations have been performed in order to estimate the first natural frequencies of the structure. The fin has been considered as a rectangular plate, with one clamped side and three other free sides. Formulas used for the analytic calculation are derived from Formulas for Natural frequency and mode Shape, reference [1].
Dry modes. The natural frequencies, a: Length of plate in m; b: Width of plate in m; E: Young modulus in N/m2; h: Thickness of plate in m; γ: mass per unit area of plate in kg/m2; and ν: Poisson’s ratio.
In this application case, it is given:
Results are given in Table 2.
Rectangular plate frequencies – dry modes
Rectangular plate frequencies – dry modes
Wet modes. The effect of a surrounding fluid in the analysis of natural frequencies is to be incorporated by adding the added mass of the fluid. The added mass will lower the natural frequencies of the plate and according to [1], the effect can be expressed approximately as:
For a cantilever plate, an approximate added mass can be predicted using the previous equation as
Results are given in Table 3.
Rectangular plate frequencies – wet modes
The influence of the added mass on the natural frequency is non-negligible for plate vibrations in a fluid and this effect is to be considered for frequencies estimation. The method used above will be applied for vibration analysis with Finite Element.
The static Finite Element Model (FEM), described in Section 3.2.2, has been used for the modal analysis. Frequencies in air have been computed with Nastran and frequencies in water have been evaluated using formulas in reference [1].
Table 4 summarizes the results obtained with the Finite Element Model.
Pre-Swirl Stator – dry and wet modes

Pre-Swirl Stator – dry and wet modes
(Continued)

(Continued)

In the FEM analysis, the comparison of the first three bending modes frequency indicates that the hull connection flexibility can modify the frequency from 39.3 Hz to 44.1 Hz. Indeed, due to the structural arrangement of the aft part geometry, the fin hull connection is different for each fin and the length of the fin root connected to the stern tube, the rigid part of the structure similar to a clamping, varies along the fin skin. In this condition, the connection stiffness is different for the different fins hence different eigenvalue frequencies. These results highlight the importance of the boundary condition in the model.
The previous results show that the first dry mode frequency obtained using the analytic equation and the FEM are very similar, the difference is about 4%.
Comparison of the propeller/fins frequencies. The objective of this modal analysis is to ensure that the natural frequencies of the fins are not in the range of the propeller frequencies to avoid resonance problems. From the propeller characteristics provided by the shipyard, the propeller frequency, in hertz, may be determined with the following equation:
RPM: Number of revolutions per minute; n: Number of propeller blades; and H: Number of Harmonic. RPM: 123 rpm; and n: 4.
In this application case, it is given:
The propeller frequencies are given in Table 5.
Propeller frequencies
Propeller frequencies
The fins frequencies are out of the range of the propeller excitation ones so the risk of resonance of the fins by the propeller is very limited.
Comparison with VIV/fins frequencies. From the modal analysis, it is also possible to evaluate the risk of Vortex Induced Vibration (VIV) by comparing the natural frequencies of the fins with the vortex shedding frequency. The frequency V: fluid velocity; and d: Length of the profile’s chord. ρ: fluid density, in kg/m3; μ: dynamic viscosity of the fluid, in kg/(m.s); and L: Length of the profile.
The Strouhal number depends on the Reynolds number defined by:
In general, in order to avoid the risk of vibration generated by the vortex, the natural frequencies of the structure are to be greater than
In this application case, it is given:
The numerical application gives:
Consequently, the risk of VIV of the PSS fins is very limited.
Flutter analysis. In the framework of the GRIP Project, Bureau Veritas has developed a tool able to estimate the risk of flutter.
From Finite Element Analyses (FEA) data (stiffness matrix, mass matrix, structural meshing, etc.), the flow induced vibration software, named VibraStar, calculates at each fluid speed step the hydrodynamic forces applied on the structure and solves the motion equation in order to provide for each mode and each fluid speed, the natural frequencies and damping of the structure. By analysing these output data, it is possible to identify a region of fluid speeds in which the bending and twisting frequencies tend toward a common value. In this region, the flutter phenomenon is likely to appear. The goal is to make sure that this fluid speeds region is not within the range of the ship speeds.
The current version of VibraStar (2D hydrodynamic sections only) requires simplification of the ESD model. Thus, the GRIP ESD is studied independently from the ship hull and only one fin of the PSS is considered, see Fig. 6.
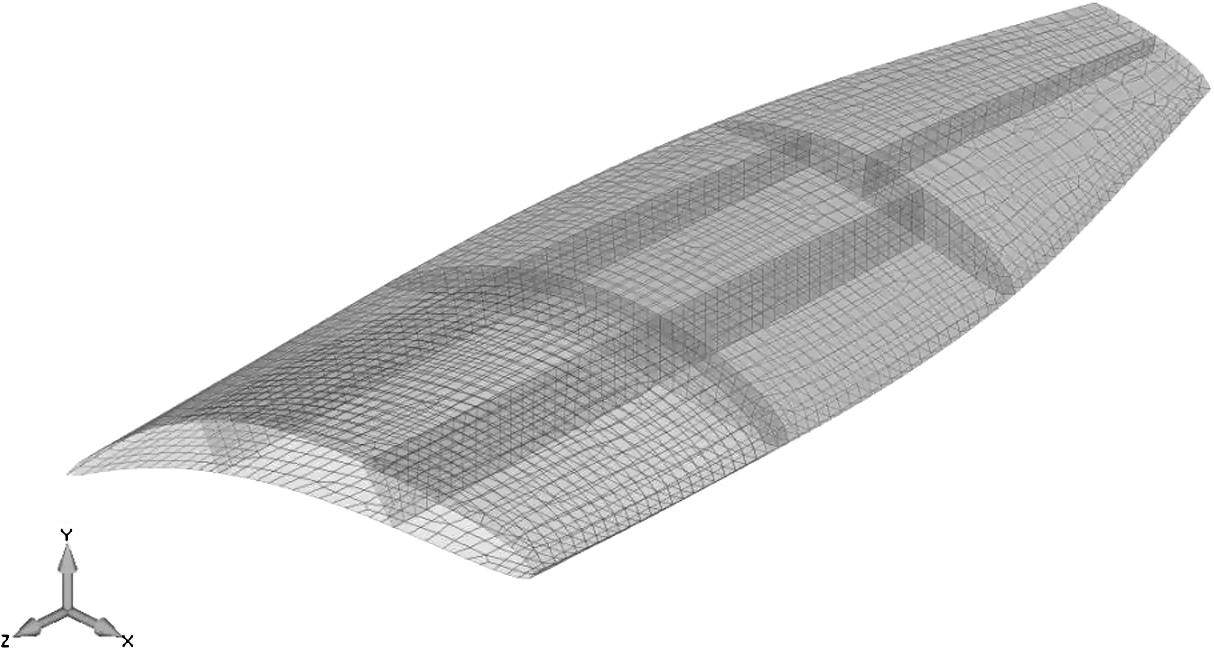
Model of the fin studied in the flutter analysis.
The tested fluid speed range is from 0 knot to 25 knots and is incremented every 1 knot. The modes frequencies and damping versus fluid speed are presented in Fig. 7.
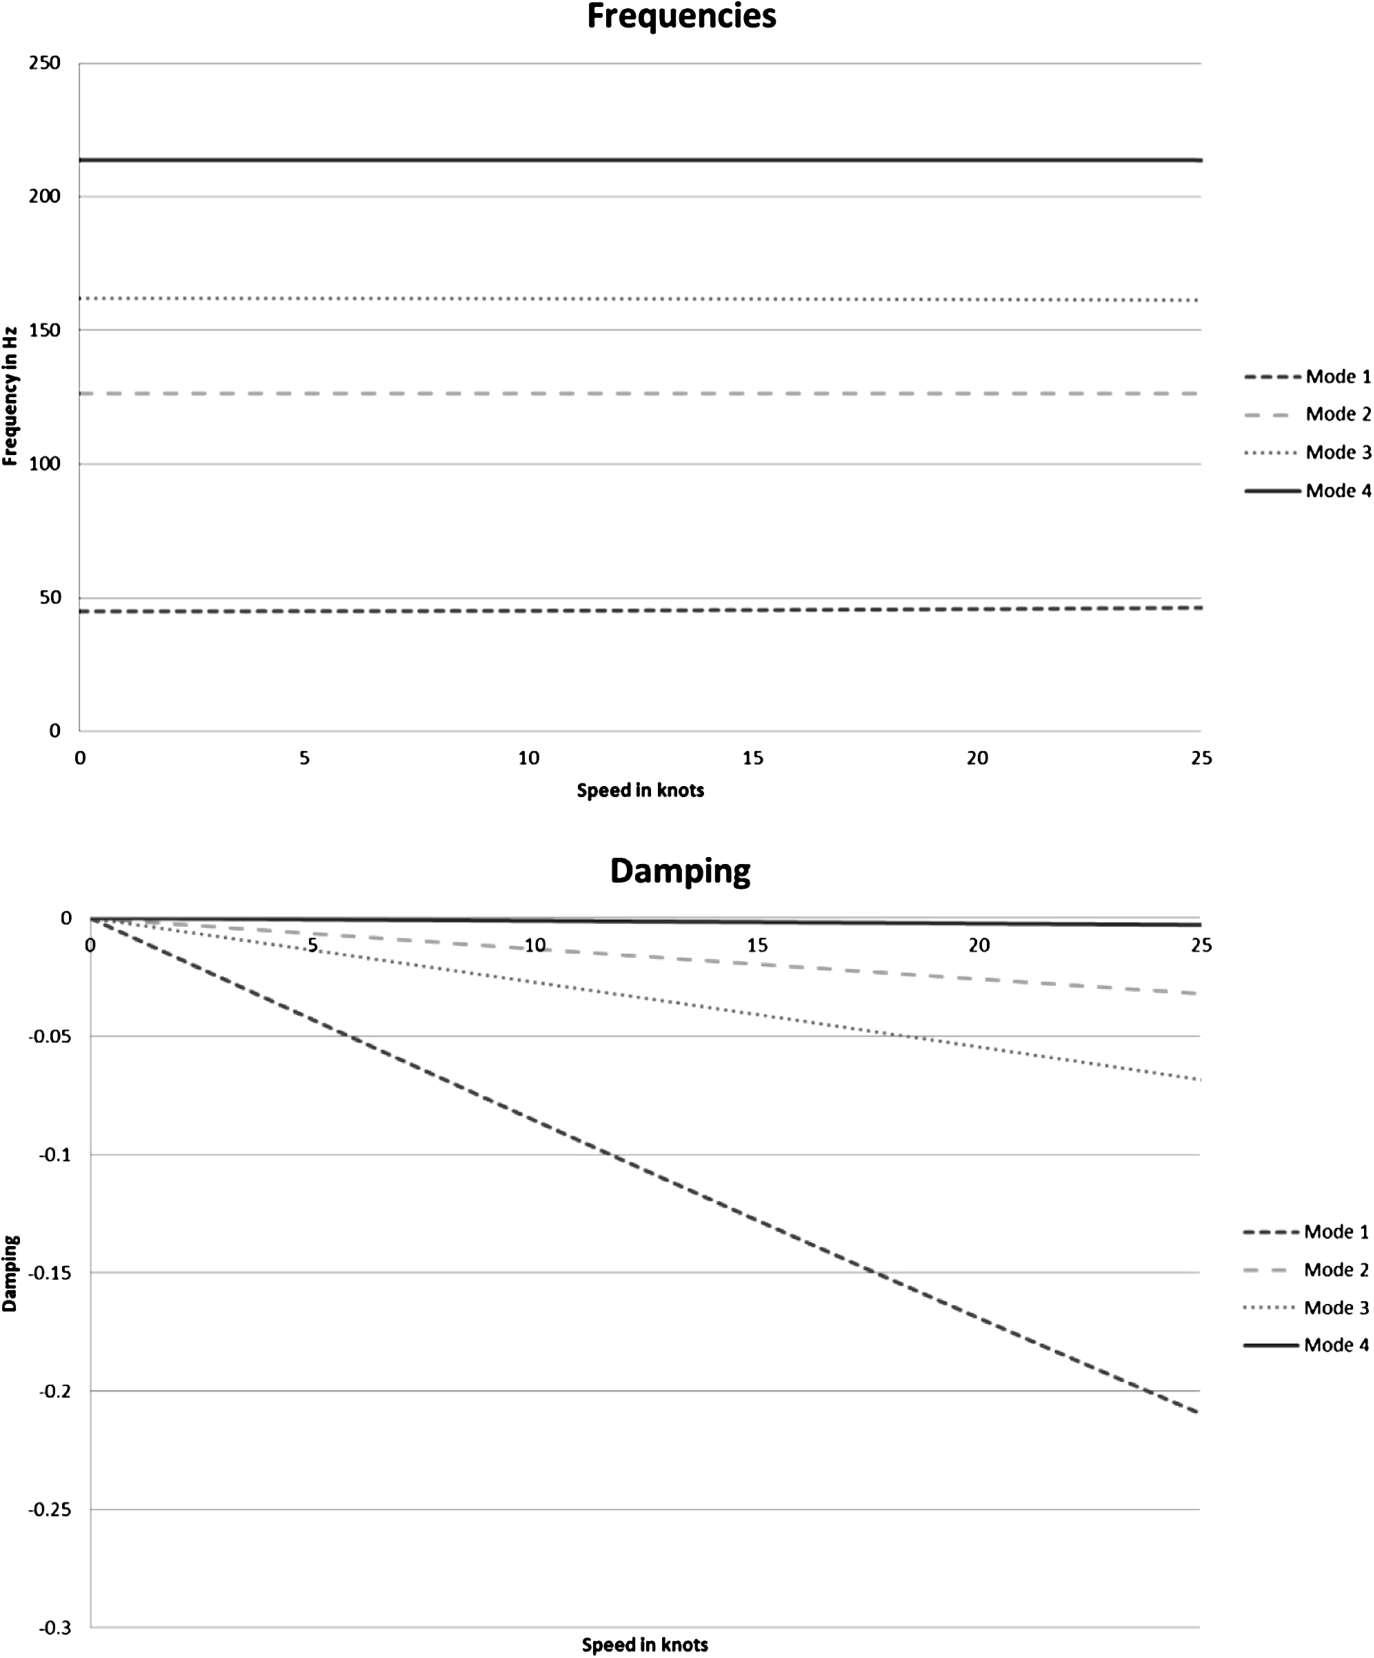
VibraStar results.
As one can observe from Fig. 7, there is little frequency variation for the modes studied (top of Fig. 7). As the fluid speed increases, the modes 1, 2 and 3 are clearly damped by the fluid. The mode 4 is also damped even if it is less relevant than the 3 other modes.
Regarding these results and considering the assumptions presented before, it is possible to conclude that the fin of the PSS is not likely to be subject to the flutter phenomenon.
The results show that the fins’ frequencies are out of range of the propeller excitation ones so the risk of vibration of the fins by the propeller excitation is very limited. The risk of vortex induced vibrations of the fins also appeared to be very limited. As far as flutter is concerned, the fluid speed leading to this phenomenon is higher than the ship speed range.
Fatigue analysis
Angle of attack probability
From the methodology developed in GRIP, see Section 2, it is possible to estimate the probability distribution of the ESD angle of attack over a period of time based on the scatter diagram.
In the Ship Motions Methodology (SMM), the scatter diagram has been divided into 3 domains in order to adapt the ship speed to the sea state. The following operational conditions have been considered:
Wave height [0 m; 5.5 m] and ship speed 15 knots; Wave height [6.5 m; 14.5 m] and ship speed 10 knots; and Wave height [15.5 m; 21.5 m] and ship speed 5 knots.
As HydroStar computations have been performed for a return period of 25 years, the wave height distributions obtained are presented in Fig. 8. The time spent in each area depending on ship speed is presented in Table 6.
With HydroStar, the RAO of angle is constructed following the methodology explained in Section 2 and after a combination of all the results, the cumulative probability distribution of the angle of attack of the Pre-Swirl Stator profile can be plotted, see Fig. 9. The interpretation of the curves in Fig. 9 is summarized in Table 7. The PSS angle of attack is less than 10° during 96.5% of the navigation time of the ship in ballast condition and during 99.4% of the navigation time of the ship in full load condition. It is greater than 15°, which corresponds to the ESD stall angle, during less than 1% of the time in ballast or in full load condition. These results highlight that the efficiency of PSS is kept during the majority of the navigation ship’s life.
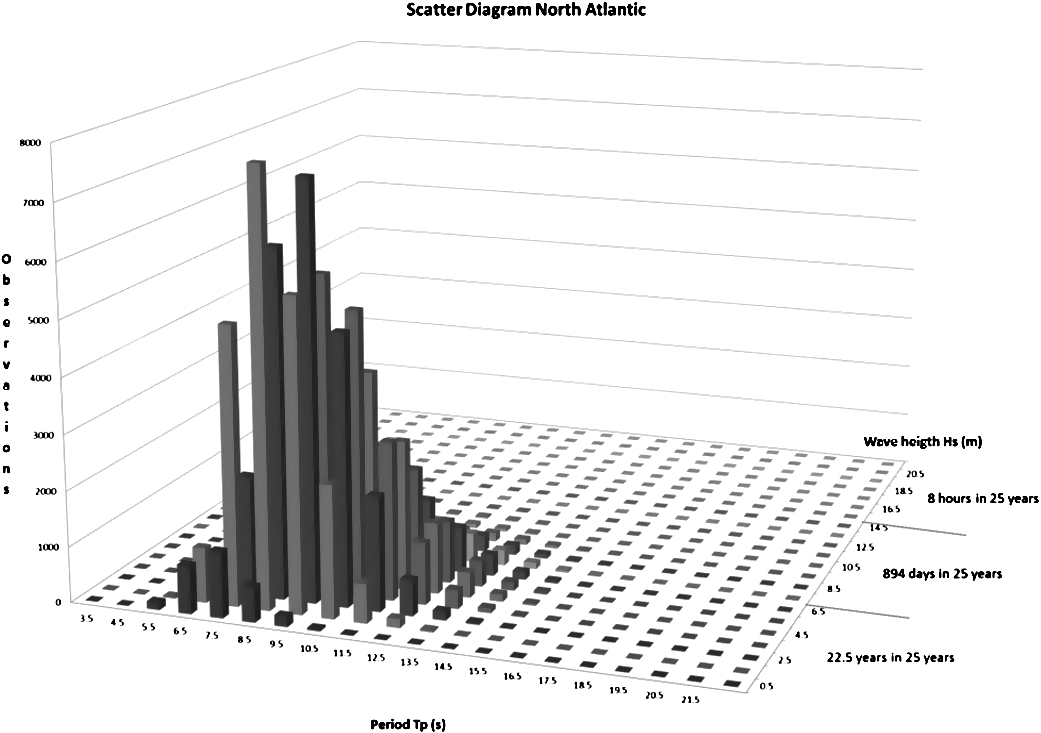
Scatter diagram North Atlantic – wave distributions.
Navigation time spent in selected wave height ranges over 25 years
Similarly to the angle of attack method, HydroStar generates lift RAO with lift forces amplitude and the associated number of cycles. By combination of the results corresponding to the 3 ship speeds, lift forces versus the number of cycles curves can be plotted. The curves in Fig. 10 present the cumulative distribution of the lift forces versus the cycles over a period of 25 years. The curves in Fig. 10 show that the lift forces applied on the PSS are greater in ballast condition than in full load condition. For high numbers of cycles, the difference is not significant. However, for low numbers of cycles the difference is around 25%.
Fatigue life computation
The fatigue analysis has been performed according to Bureau Veritas rules, see NI 393 reference [5] and NR467 reference [6].
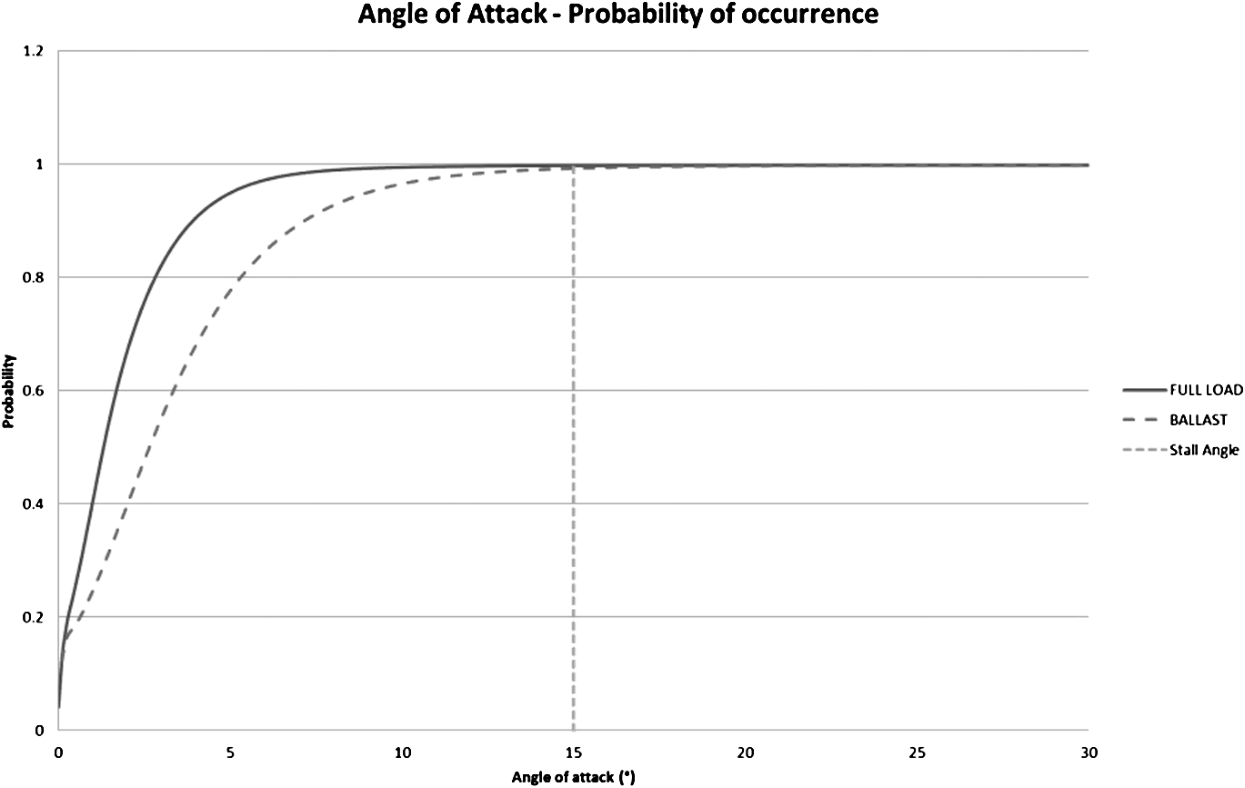
Angle of attack – cumulative probability distribution for a return period of 25 years.
Percentage of time of occurrence of the angle of attack
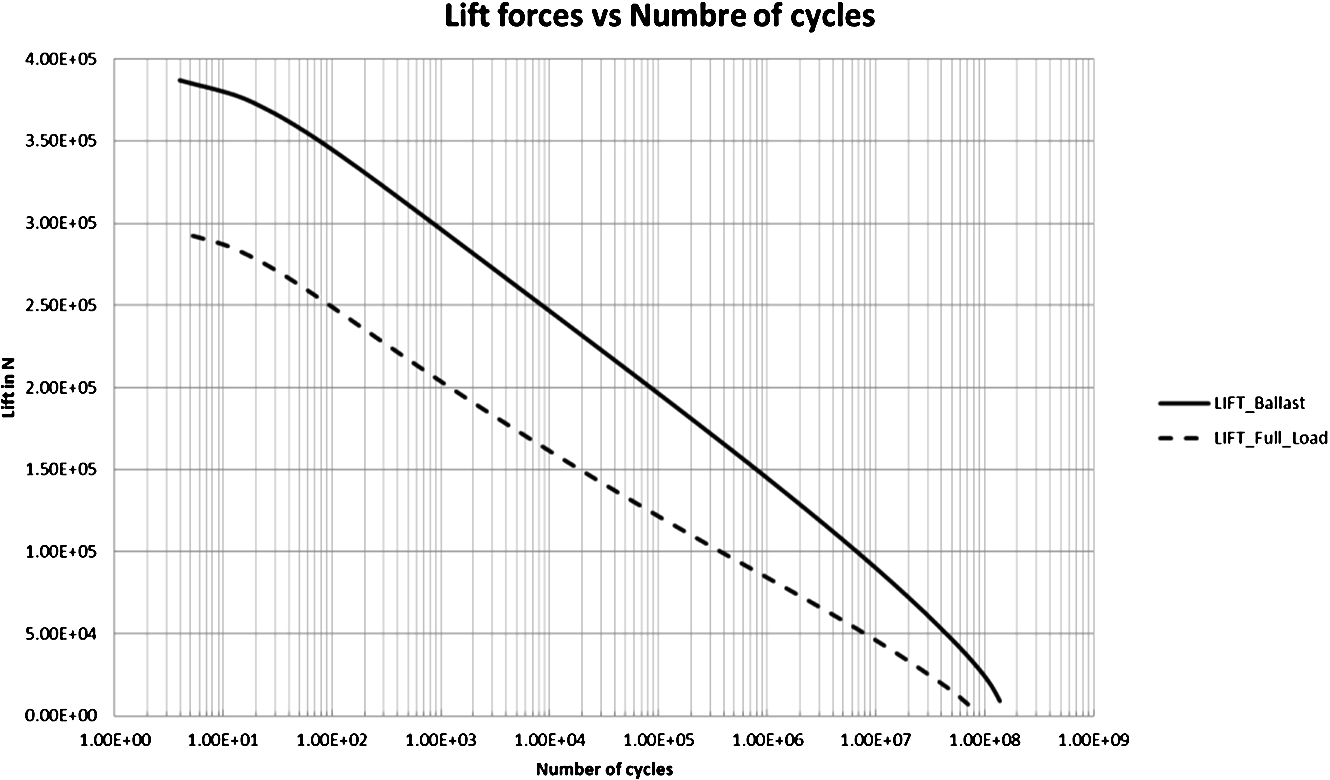
Lift forces vs number of cycles.
The elementary hot spot stress
As the size of the finite element located at the vicinity of the hot spot is about once the thickness of the structural member, the hot spot is the stress computed at the centroid of the element.
The elementary notch stress range is obtained from the following formula:
λ: coefficient depending on the weld configuration; θ: mean weld toe angle, in degrees;
N: Number of cycles to failure; and m: slope of the curve.
The design S–N curves considered in the fatigue analysis, based on a survival probability of 97.5% and taking into account the Haibach effect, are defined as follow:
The Haibach effect consists in changing the slope of the S–N curve for a number of cycles in order to consider a threshold level under which no failure is observed.
The cumulative damage ratio is obtained from the following formula:
α and β, part of the ship life loading condition (for bulk carrier,
And
The fatigue life is given by:
In case of grinding of welds, the cumulative damage ratio D can be divided by the fatigue life improvement factor
The numerical application gives, considering relevant assumptions, a fatigue life greater than 25 years.
Thanks to the Ship Motions Methodology developed in the framework of the EU Funded GRIP Project, the cyclic loads applied on an ESD can be estimated during the sailing life of a ship and used for the fatigue life assessment. The method provides also information concerning the ESD angle of attack during the navigation. Indeed, the methodology shows that the angle of attack of the PSS is less than 10° during 96.5% of the navigation time of the ship, in ballast condition, and during 99.4% of the navigation time of the ship in full load condition. Additionally, the angle of attack is greater than 15°, which corresponds to the ESD stall angle, only during less than 1% of ship navigation in ballast or in full load condition.
These results highlight that the efficiency of PSS is kept during the majority of the ship’s navigation life. Additionally, the cyclic loads distribution indicates that the lift forces applied on the PSS are greater in ballast condition than in full load condition. For high numbers of cycles, the difference is not significant. However for low numbers of cycles the difference is around 25%.
Conclusion
The methodology, named Ship Motions Methodology (SMM), has been developed by Bureau Veritas for the strength assessment of ESD in the design process. It is based on hydrodynamic computations, using the Bureau Veritas software, and the study of fluid velocities and the profile angle of attack. From the ship motions RAOs and considering the sailing area of the ship, the forces applied on an ESD structure can be estimated. In addition, the design wave, leading to the maximum strength, is also determined. In order to obtain more accurate estimations of loads applied on an ESD, CFD computations using the design wave determined by the SMM will be carried out in a further step.
The methodology provides also cyclic loads for fatigue analysis and allows evaluating the probability of occurrence of the angle of attack of the ESD profile over a return period.
The methodology has been applied during the project for the validation of a Pre Swirl Stator installed on a bulk carrier built by Uljanik Shipyard. This study demonstrates the applicability of the methodology and the interest for designers, shipyards and owners to know of applied force and fatigue life of this type of structure.