
Abstract
Assessments of brain glucose metabolism (18F-FDG-PET) and cerebral amyloid burden (11C-PiB-PET) in mild cognitive impairment (MCI) have shown highly variable performances when adopted to predict progression to dementia due to Alzheimer’s disease (ADD). This study investigates, in a clinical setting, the separate and combined values of 18F-FDG-PET and 11C-PiB-PET in ADD conversion prediction with optimized data analysis procedures. Respectively, we investigate the accuracy of an optimized SPM analysis for 18F-FDG-PET and of standardized uptake value ratio semiquantification for 11C-PiB-PET in predicting ADD conversion in 30 MCI subjects (age 63.57±7.78 years). Fourteen subjects converted to ADD during the follow-up (median 26.5 months, inter-quartile range 30 months). Receiver operating characteristic analyses showed an area under the curve (AUC) of 0.89 and of 0.81 for, respectively, 18F-FDG-PET and 11C-PiB-PET. 18F-FDG-PET, compared to 11C-PiB-PET, showed higher specificity (1.00 versus 0.62, respectively), but lower sensitivity (0.79 versus 1.00). Combining the biomarkers improved classification accuracy (AUC = 0.96). During the follow-up time, all the MCI subjects positive for both PET biomarkers converted to ADD, whereas all the subjects negative for both remained stable. The difference in survival distributions was confirmed by a log-rank test (p = 0.002). These results indicate a very high accuracy in predicting MCI to ADD conversion of both 18F-FDG-PET and 11C-PiB-PET imaging, the former showing optimal performance based on the SPM optimized parametric assessment. Measures of brain glucose metabolism and amyloid load represent extremely powerful diagnostic and prognostic biomarkers with complementary roles in prodromal dementia phase, particularly when tailored to individual cases in clinical settings.
Keywords
INTRODUCTION
The mild cognitive impairment (MCI) construct is nowadays the most clinically valid entity to define a stage of possible transition from moderate cognitive impairment in aging to dementia. However, the trajectories of cognitive decline and the conversion to different forms of dementia call for the identification of optimal biomarkers for outcome prediction [1]. The risk prediction of conversion to dementia due to Alzheimer’s disease (ADD) has crucial implications for the best fitting in clinical trials of subjects with correct AD diagnosis, particularly in prodromal and preclinical phases [2, 3]. Decreases of cerebral glucose metabolism in temporo-parietal and precuneus regions as measured by 18F-FDG-PET, and the amyloid burden, as detected with amyloid-PET, are adopted in the National Institute of Aging-Alzheimer Association (NIA-AA) criteria for both dementia and MCI due to AD pathology [4, 5]. According to these criteria, 18F-FDG-PET hypometabolism and amyloid-PET positivity, reflecting respectively downstream neuronal degeneration and pathological amyloid deposition, are both considered in vivo supporting biomarkers for AD pathology and are required to establish diagnosis [4, 5]. In contrast, the International Working Group criteria (IWG-2) have proposed a simplified algorithm in which only cerebrospinal fluid (CSF) measurements of amyloid and tau protein or amyloid-PET status are considered as supportive diagnostic biomarkers of AD pathology [6], while 18F-FDG-PET is considered only for disease staging and monitoring of the progression [6]. A recent study on the prognostic value of the NIA-AA [5], IWG-2 and IWG-1 criteria [6, 7], however, showed that classification according to the NIA-AA criteria, in which PET pathological and neuronal injury biomarkers are both considered for AD diagnosis, reached the highest prediction accuracy for MCI to ADD conversion in a clinicalsetting [8].
As for prediction of conversion to ADD in MCI subjects, both 18F-FDG-PET and amyloid-PET techniques have shown high variability in their performances, as recently reported in two Cochrane reviews [9, 10]. As for the former [9], the 18F-FDG-PET meta-analysis showed high variability in sensitivity and specificity, thus advising against 18F-FDG-PET routine utilization in MCI subjects [9]. A critical stance by the European Association of Nuclear Medicine (EANM) followed [11]; highlighting the limitations of the Cochrane review and claiming that the observed variability was mostly due to confounding biases, among them, crucially, the methodology to define 18F-FDG-PET scan positivity [11]. Similarly, the Cochrane review on 11C-PiB-PET for risk assessment in MCI and differential diagnosis of dementias [10] concluded for a considerable heterogeneity in the conduct and interpretation of the results, particularly due to the lack of defined thresholds for test positivity and standardization of analysis methods, thus not recommending amyloid PET in routine clinical practice [10]. Other sources of variability for 11C-PiB-PET results relate crucially to the different follow-up durations employed by different studies, as well as to sampling bias related to varying operational MCI definitions, accordingly to a recent review [12].
Thus, the adoption of validated and standardized methods for 18F-FDG-PET and amyloid-PET in research and clinical settings is fundamental to achieve high accuracy, as shown in two large recent meta-analyses [13, 14]. This is especially true since the role for 18F-FDG-PET in the early and differential diagnosis of dementias and for amyloid PET in excluding the presence of underlying AD pathology is confirmed by several reports [15 –21].
In a sample of MCI subjects evaluated in a clinical setting, we investigated the separate and combined performances of 18F-FDG-PET and 11C-PiB-PET imaging, respectively, analyzed with an optimized SPM procedure [22, 23] and semi-quantified standardized uptake value ratio (SUVR) methods [24], in predicting or excluding ADD conversion at the individual level. A follow-up period confirmed the ADD conversion or the stable MCI condition.
METHODS
Participants
We included 30 MCI subjects, classified according to diagnostic criteria [1], all of them retrospectively included from the database of the Karolinska Institutet, Stockholm, Sweden. Inclusion criteria for the study were the availability of both 11C-PiB-PET and 18F-FDG-PET imaging and a clinical follow-up to evaluate the conversion to ADD. MCI clinical subtypes were assessed following standardized criteria [1], thus splitting the whole sample in amnestic/non-amnestic, single- or multiple-domain MCI (aMCI SD, aMCI MD, naMCI SD, naMCI MD, see Table 1). Progression from MCI to ADD was established according to standardized clinical diagnostic criteria [5]. At the clinical follow-up, 14 MCI converted to ADD (median time to conversion 21.5, inter-quartile range IQR 34.8 months) and 16 MCI remained stable (median 31.5 months, IQR 25.8 months). Demographic and clinical summary for the whole cohort and split by conversion status is available in Table 1.
Demographic and clinical summary of the MCI cohort
Table showing demographic and clinical data of the studied MCI cohort, split by conversion status. p-values represent the significance of pairwise converter versus non-converter MCI group comparisons. Fisher Exact Test (two-tailed) was adopted for the bimodal discrete variables, otherwise a two-tailed χ 2 test was performed. APOE, Apolipoprotein E; MMSE, Mini-Mental State Examination; IQR, interquartile range; aMCI SD, amnestic MCI single-domain; aMCI MD, amnestic MCI multi-domain; naMCI SD, non-amnestic MCI single-domain; naMCI MD, non-amnestic MCI multi-domain.
All subjects, or their informants/caregivers, gave written informed consent to the experimental procedure that had been approved by the regional Human Ethics Committee of Stockholm as well as the by the radiation safety committee of Uppsala University Hospital.
Cognitive assessment
Global cognitive functioning at baseline was assessed using Mini-Mental Status Examination (MMSE). Multiple cognitive domains were evaluated adopting an extended standardized neuropsychological battery. The neuropsychological tests included the Swedish versions of the Wechsler Adult Intelligence Scale (WAIS), including the Full Scale Intelligence Quotient (FSIQ), Information, Similarities and Block Design subscales. Additionally, verbal short-term memory (Digit Span, Rey Auditory Verbal Learning Test – RAVLT immediate recall), short-term memory, attention and processing speed (Digit Symbol), visuo-constructive abilities (Rey Figure copy), long-term episodic memory (RAVLT delayed recall), long-term visual spatial memory (Rey Figure recall), and visuo-motor, executive and attention functioning (Trail Making Test – A/B) tests. In order to analyze neuropsychological measures, raw scores were transformed into z-scores according to the national normative data [25].
PET Studies
18F-FDG-PET acquisition
18F-FDG-PET scans were acquired either with a Siemens ECAT EXACT HR+ or a GEMS Discovery ST PET/CT scanner with 3D mode yielding a 155–157 mm axial field of view. The injected dose was 214±45 MBq, and was acquired through a 3D dynamic scan of either 60 (5×60, 5×180, 6×300, 1×600 s) or 45 min (1×60, 1×1140, 5×300 s / 4×30, 9×60, 3×180, 5×300 s). Image reconstruction protocol followed a 3D Filtered Back Projection (FBP). Attenuation correction was performed with rotating 68Ge rod sources for the ECAT EXACT HR+ scanner whereas it was CT-based for the GEMS Discovery-ST. All reconstructed frames were re-aligned to correct for between frame patient motions (VOIager).
18F-FDG-PET data analysis
Image analysis was carried out with SPM5 software (Wellcome Department of Imaging Neuroscience, London, UK; www.fil.ion.ucl.ac.uk/spm) on MATLAB 8 (MathWorks Inc, Sherborn, Mass). The late 15-min summation image of each 18F-FDG-PET scan was analyzed according to an optimized 18F-FDG-PET SPM procedure previously developed and validated in early and differential dementia diagnosis [18 , 26–29] and in prodromal MCI outcome prediction [17]. Briefly, scans were ‘spatially normalized’ in accordance to a reference “dementia specific” 18F-FDG-PET template [22] and then smoothed 8 mm. These single-subject images were compared to a normality database tool by means of a two-sample t-test implemented in SPM5 to assess brain hypometabolism (detailed description available in [22, 23]. The statistical threshold was set at p = 0.05, family wise error (FWE) corrected for multiple comparisons. Only clusters containing more than 100 voxels were deemed to be significant. This method has been shown to be valid, accurate and reliable in detecting AD metabolic signature independently from the PET scanner used for image acquisition [30].
11C-PiB-PET acquisition
Amyloid-PET scans were performed using 11C-PiB-PET and either a Siemens ECAT EXACT HR+ scanners or a GEMS Discovery ST PET/CT scanner with 3D mode yielding a 155–157 mm axial field of view. The mean injected dose was 247±72 MBq. The 11C-PIB-PET scans consisted of 24 frames (4×30; 9×60; 3×180; 8×300 s) with a total duration of 60 min with a FBP protocol adopted for image reconstruction. Attenuation correction was performed with rotating 68Ge rod sources for the ECAT EXACT HR+ scanner whereas it was CT-based for the GEMS Discovery-ST. All reconstructed frames were re-aligned to correct for between frame patient motions (VOIager).
11C-PiB-PET data analysis
11C-PiB-PET late 40–60 min summation images were created and nonlinearly spatially normalized to a population-based PIB template in Montreal Neurological Institute (MNI) space [24] with the use of SPM8 software. A cerebellar grey matter region [24] was used as reference for each 40–60 min PIB image to create SUVR (SUVRCERGM) parametric images.
Neuroimaging biomarkers positivity
18F-FDG-PET
The single-subject 18F-FDG-PET SPM hypometabolism maps were evaluated by four experts in neuroimaging, blind to each other and to clinical information and amyloid status. The expert raters showed a high agreement (Cohen’s k: 0.89) in the evaluation of SPM maps. Images were defined as AD-positive pattern (FDG+) when 18F-FDG-PET SPM hypometabolism maps represented either the typical (temporoparietal and/or posterior cingulate hypometabolism) [18 , 31] or an AD atypical pattern as follows: 1) predominant left posterior perisylvian and parietal hypometabolism, suggestive for the logopenic variant of primary progressive aphasia (lvPPA) [32]; 2) predominant posterior parietal and occipital brain hypometabolism for posterior cortical atrophy (PCA) [26, 33]; and 3) frontal and temporo-parietal hypometabolism with posterior cingulate involvement for the frontal variant AD [34]. Otherwise, the 18F-FDG-PET SPM hypometabolism maps were defined as AD-negative pattern (FDG–) when they did not show differences in the comparison with normal control database.
11C-PiB-PET
Composite amyloid SUVR scores resulting from the average of uptake values of medial orbitofrontal, superior parietal, middle temporal, precuneus, anterior and posterior cingulate regions were estimated. We adopted template-based regions of interest (ROIs) created through the Wake Forest University PickAtlas toolbox for SPM [35], using anatomical definitions from the automated anatomical labeling (AAL) atlas [36]. These composite SUVR scores were then compared to a validated cut-off threshold, i.e., 1.41 [24]. All the subjects were classified as amyloid positive (Amy+) when their composite cortical SUVR score was above the normality cut-off threshold, and as amyloid negative (Amy–), when it was below the normality cut-off threshold.
Biomarkers analysis for progression prediction
We first evaluated the separate ability of both PET biomarkers in predicting or excluding conversion to dementia, as established at the clinical follow-up diagnosis. We then estimated sensitivity, specificity, accuracy for each PET biomarker, together with a receiver operating characteristic (ROC) analysis with area under the curve (AUC) estimation, which was performed setting clinical status at last follow-up as the primary outcome.
Second, to evaluate the combined diagnostic power of both PET biomarkers, we ran a forward conditional logistic regression, setting 18F-FDG-PET and 11C-PiB-PET results (FDG+/–and Amy+/–) as predictors and dementia conversion status as outcome. This procedure allows the creation of a third variable in which each subject has a predicted probability value according to the combination of 18F-FDG-PET and 11C-PiB-PET ratings. We then used this third variable to test the classification ability of the biomarkers combination in predicting conversion to ADD. Considering the group as split by biomarker combination status (e.g., FDG+/Amy+, FDG–/Amy–), we estimated a Kaplan-Meier survival distribution considering ADD conversion as event as a function of the follow-up time. All the statistical analyses were performed with SPSS software (v21.0 http://www.ibm.com/analytics/us/en/technology/spss/).
RESULTS
Cognitive assessment
Converter MCI when compared to the non-converters showed more impairment at baseline in the long-term visual spatial memory task (Rey Figure recall) (Mann-Whitney non-parametric U test, p = 0.011) and in the WAIS Similarities subscale (Mann-Whitney non-parametric U test, p = 0.011). No significant differences were found in the other neuropsychological test scores at baseline between the two MCI subgroups. A summary of neuropsychological data is available in Table 2.
Neuropsychological summary of the MCI cohort
Table showing neuropsychological summary of the studied MCI cohort, split by conversion status. Values are shown as z-scores, with reported mean±sd. p-values represent the significance of pairwise converter versus non-converter MCI group comparisons. * Indicates a significant (p < 0.05) difference (Mann-Whitney U-test for independent samples), MMSE, Mini-Mental State Examination; WAIS, Wechsler Adult Intelligence Scale; FSIQ, Full Scale Intelligence Quotient; RAVLT, Rey Auditory Verbal Learning Test. See Methods for details.
Biomarkers positivity
Within the 14 converter MCI cases, 11 were FDG+/Amy+, showing both the typical pattern (n = 4) and atypical AD brain glucose hypometabolism patterns (i.e., 2 lvPPA, 2 PCA, and 1 frontal variant of AD patterns). In addition, there were two subjects with a typical AD hypometabolism pattern with mixed evidence for cerebrovascular disease. Finally, the other three MCI converter cases were FDG–/Amy+. All the 16 non-converter MCI cases were FDG-negative. As regards 11C-PiB-PET, 10/16 were Amy–and 6/16 were Amy+. The results are summarized on Table 3. Figure 1 depicts representative 18F-FDG-PET for typical AD, lvPPA, and PCA patterns with the respective 11C-PiB SUVRs maps.
PET biomarker combinations and conversion to AD dementia
Table showing combinations of biomarkers positivity and AD conversion in our MCI cohort. Group sizes are also shown. FDG+, FDG pattern suggestive for AD; FDG–, FDG pattern negative for AD; Amy+, amyloid composite 11C-PiB-PET SUVR above positivity cut-off; Amy–, amyloid composite 11C-PiB-PET SUVR below positivity cut-off.
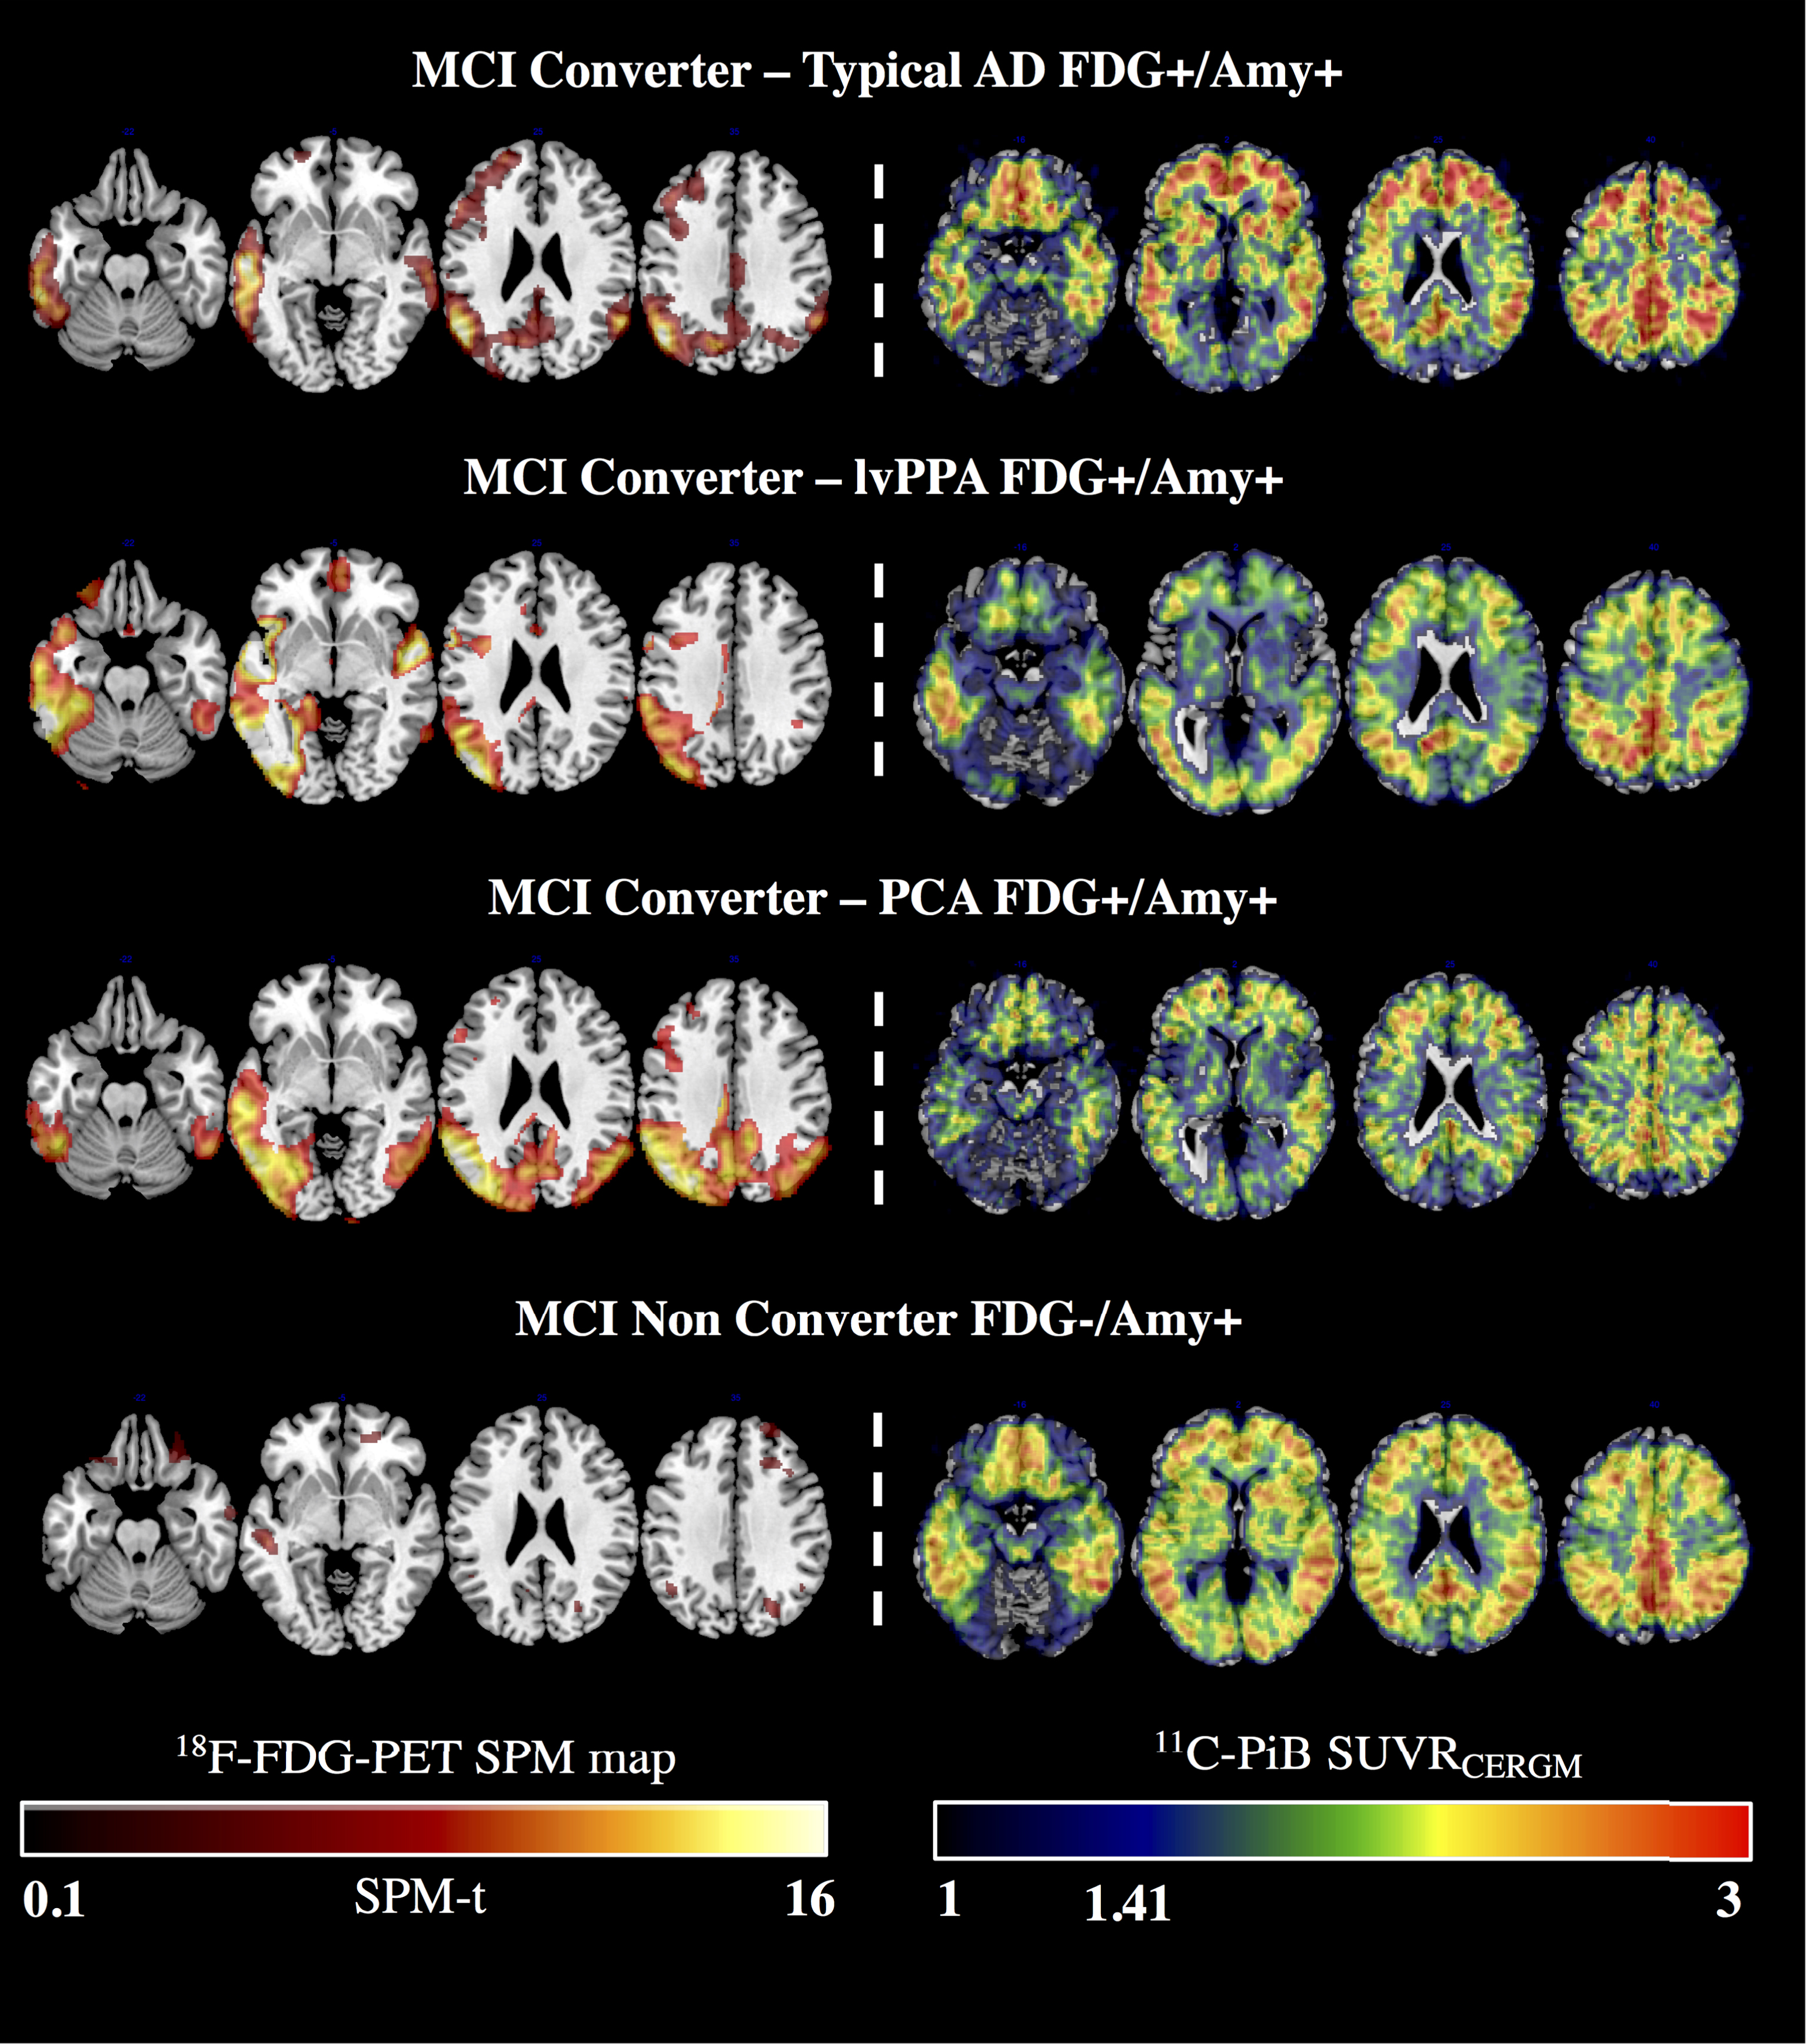
Optimized 18F-FDG-PET SPM maps and 11C-PiB-PET SUVRs in representative MCI cases. Figure showing optimized 18F-FDG-PET SPM maps and 11C-PiB-PET SUVRCERGM images of representative MCI subjects split by clinical outcome and biomarkers positivity combinations. Diverging 18F-FDG-PET hypometabolism SPM patterns representative of the AD variants are associated with comparable 11C-PiB-PET amyloid retention distributions. Optimized 18F-FDG-PET SPM and 11C-PiB-PET SUVRCERGM images are overlaid on a T1 standard anatomical template with MRIcron software (http://www.mccauslandcenter.sc.edu/crnl/tools).
Biomarkers progression prediction
Both modalities showed valuable prediction ability, with 18F-FDG-PET positivity performing as the best individual predictor for AD conversion, showing an overall higher accuracy than 11C-PiB-PET (0.90 versus 0.80, respectively). 18F-FDG-PET showed higher specificity than 11C-PiB-PET (1.00 versus 0.62), but lower sensitivity (0.79 versus 1.00). AUCs were 0.89 for 18F-FDG-PET and 0.81 for 11C-PiB-PET. Adding genetic risk, i.e., APOE status, to either the PET-based measurements did not improve the prediction, or exclusion, of conversion to ADD.
Noteworthy, 18F-FDG-PET and 11C-PiB-PET combined showed the highest AUC (0.96) (see Fig. 2A). None of the FDG–/Amy–subjects converted to AD, leading to 1.0 probability of non-conversion at about 10 years from MCI diagnosis. On the other hand, all the FDG+/Amy+ converted within about 8 years of follow-up. Lastly, three FDG-/Amy+ subjects converted to ADD either very early after initial MCI diagnosis (n = 2, converting after 6 and 7 months of follow-up) or about 7.5 years later (n = 1, converting after 90 months of follow-up). Kaplan-Meier curves showed a clear difference between the survival probability of the FDG+/Amy+, FDG–/Amy+, and FDG–/Amy–groups (see Fig. 2B). The right censoring pattern differed across the biomarker groups, in particular with lack of censored events for the FDG+/Amy+ group and complete censoring for the FDG–/Amy–. A log-rank (Mantel-Cox) test confirmed the statistically significant difference between the survival distributions of the three groups (χ 2: 12.051, p = 0.002). The log-rank test was preferred since it focuses on the longer survival times and is more resistant to differences in the right censoring patterns, which are in contrast with the proportional hazard assumption of the Kaplan-Meier test.
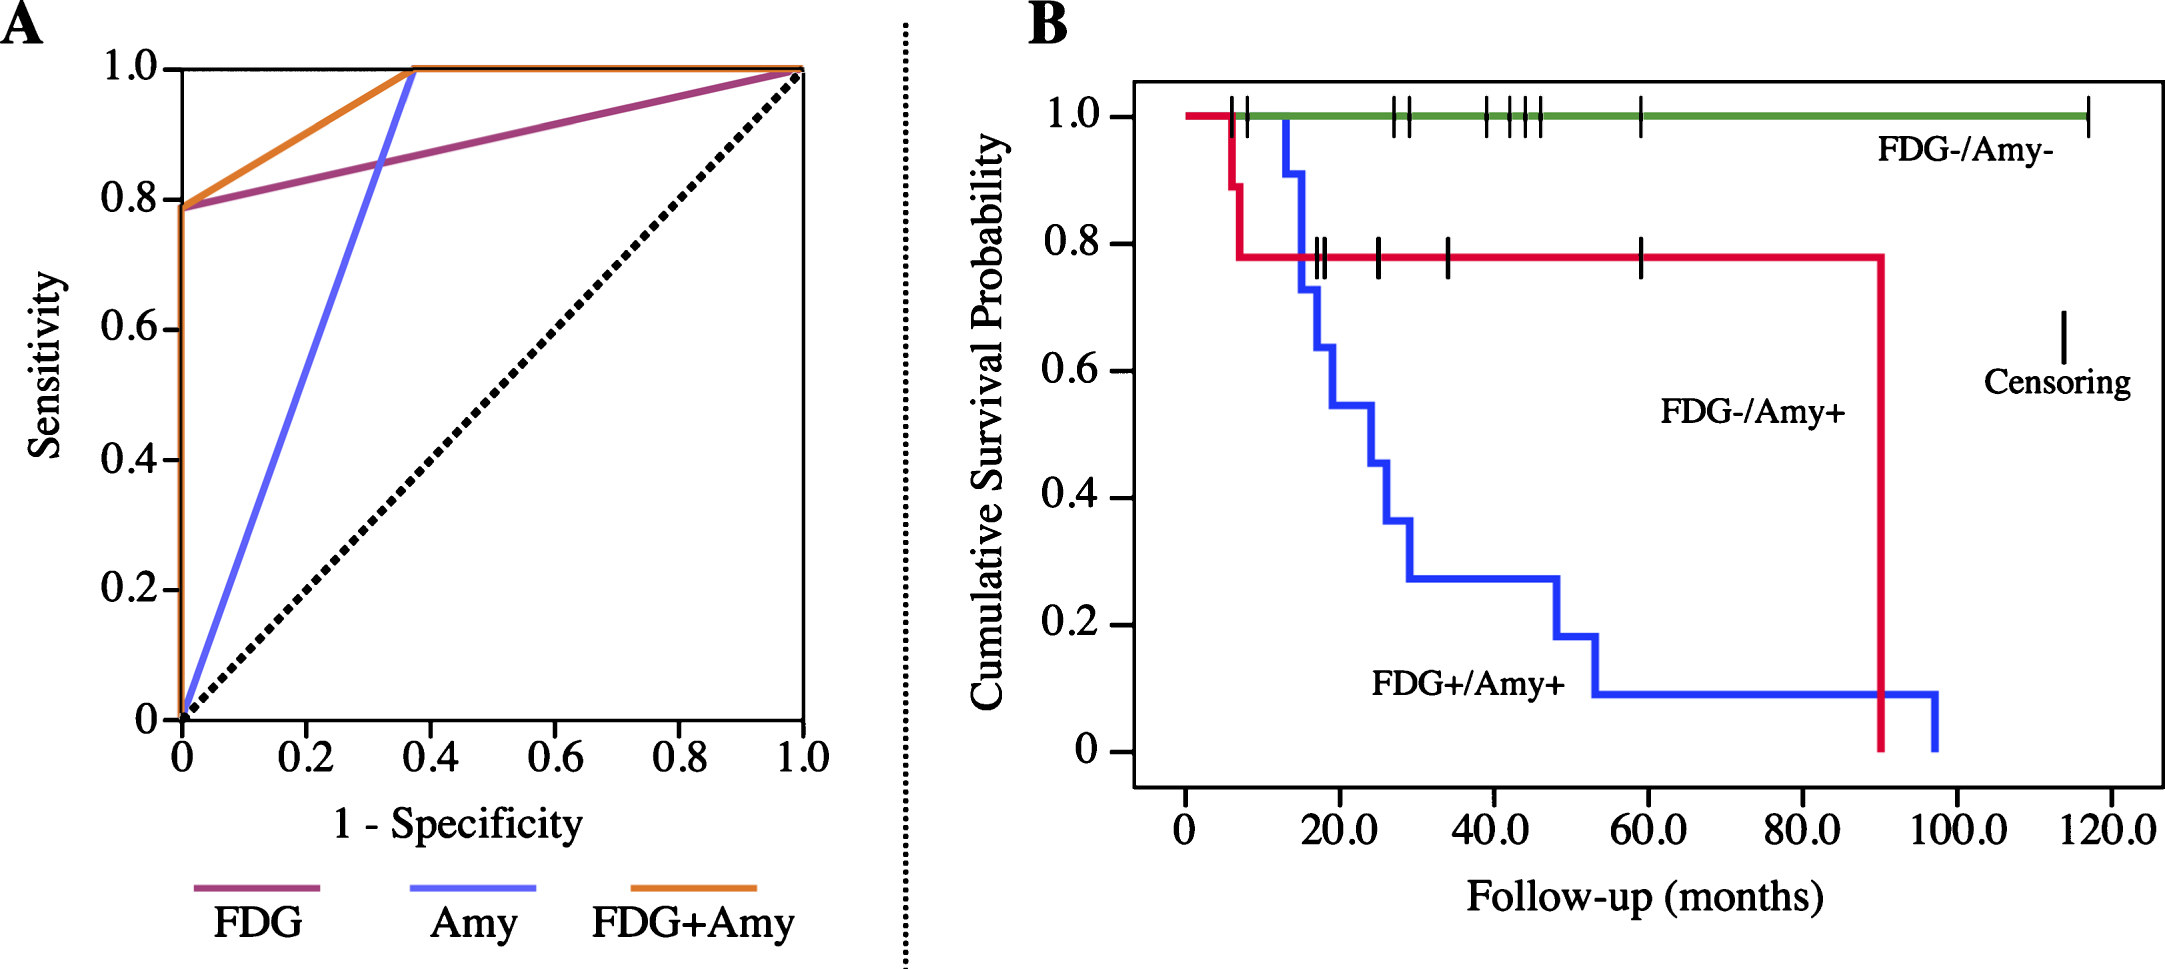
ROC and Kaplan-Meier curves for ADD conversion prediction. Figure showing ROC and Kaplan-Meier Survival Curves for ADD conversion prediction. A) ROC curves for the individual 18F-FDG-PET (violet) and 11C-PiB-PET (blue) biomarkers, together with their combination (orange). The dashed black line represents a diagonal reference. AUCs were: 0.89 for 18F-FDG-PET, 0.81 for 11C-PiB-PET and 0.96 for their combination. B) Image showing Kaplan-Meier survival plots split by subgroups derived from PET biomarkers positivity combinations, respectively: FDG-/Amy–(green), FDG-/Amy+ (red), and FDG+/Amy+ (blue). Dashes represent right censored cases. See text for details.
DISCUSSION
In this study we investigated, in single MCI individuals, the separate and combined performances of 18F-FDG-PET and 11C-PiB-PET measures, using validated semi-quantified methods, as biomarkers of neurodegeneration and pathology status able to exclude or predict the risk of conversion to ADD. From the clinical and neuropsychologicalstandpoint, at baseline, the converter MCI performed significantly worse than the stable subjects in long-term visual spatial memory (Rey Figure recall) and productive/receptive language (WAIS Similarities subscale). These findings are coherent with the known AD-related neuropsychological signature [5].
The prediction analyses showed partly different performances for topographical (18F-FDG-PET) and pathological (11C-PiB-PET) biomarkers, with higher specificity for 18F-FDG-PET SPM maps and higher sensitivity for 11C-PiB-PET SUVRs. In details, the conversion rate of 18F-FDG-PET-positive subjects was 100%, whereas the conversion rate of PET amyloid-positive subjects was 70%, consistently with previous literature [24, 37]. All the subjects positive for both 18F-FDG-PET and 11C-PiB-PET (n = 11) were diagnosed with ADD during the follow-up period. The combination of these PET biomarkers showed an increase in overall accuracy for ADD conversion prediction in MCI subjects (Fig. 2A).
In this series, 18F-FDG-PET SPM maps were able to detect not only the typical AD hypometabolism signature, but also the hypometabolism patterns suggestive of atypical clinical presentation of AD pathology (i.e., lvPPA, PCA, and frontal variant) [34] (see Fig. 1). The optimized 18F-FDG-PET SPM method here confirmed previous evidence on its effective role in differentiation of atypical clinical phenotypes associated with AD pathology [26, 28]. There is a consistent body of evidence regarding the potential of 18F-FDG-PET in detecting specific hypometabolism patterns across different dementia conditions, e.g., ADD, dementia with Lewy bodies, and frontotemporal dementia [17 , 38]. The previous literature and present results strongly advocate for a crucial role of topographical downstream neurodegeneration markers, such as 18F-FDG-PET, particularly in MCI conversion prediction and also in early dementia classification, with critical implications in the use of voxel-wise semiquantitative methods. Additionally,few 18F-FDG-PET SPM maps were rated as representative of mixed AD plus cerebrovascular disease (see Results). Neuroimaging-based biomarkers have increasingly been recognized as of value for clinical practice in the diagnosis of underlying vascular disease [39, 40]. Structural magnetic resonance imaging (MRI) techniques are the standard choice when cerebrovascular disease is suspected, revealing specific imaging abnormalities associated with vascular events [41]. 18F-FDG-PET studies in cerebrovascular diseases have revealed typical patterns of focal scattered and patchy hypometabolism in cortical and subcortical regions [39]. Of note, 18F-FDG-PET measurement could add to MRI the evidence of dysfunctional areas, due to its sensitivity in detecting cortical deafferentation and synaptic dysfunction in normal-appearing tissue [40].
Crucially, all the subjects negative for both 18F-FDG-PET and 11C-PiB-PET remained stable over the follow-up time. This finding supports the fundamental value of both biomarkers in excluding neurodegenerative process due to underlying AD pathology in the MCI stage. This high negative ADD risk prediction was driven by the high value of the 18F-FDG-PET negativity to rule out AD-associated neurodegeneration in MCI cases, as previously found and discussed [17]. The high specificity of 18F-FDG-PET in ADD, dementia with Lewy bodies, and frontotemporal dementia implies that a negative, or normal scan in the presence of the suspicion of dementia makes a diagnosis of a neurodegenerative disease very unlikely. In the context of early diagnosis, the exclusionary role of 18F-FDG-PET is especially important in younger subjects with a suspicion of neurodegenerative disease [20]. With regards to amyloid-PET, its potential in ruling out AD pathology is well known [42].
Six out of 16 non-converter MCI showed an Amy+ pattern with a negative 18F-FDG-PET scan, at a median follow-up time of 25 months. We suggest that these FDG–/Amy+ non-converter MCI cases could either be in need of longer follow-ups or, when remaining stable over long time, could be considered as incidental amyloid cases [43]. In addition, as previously stated, the presence of high PET amyloid burden in MCI subjects does not provide a sufficient confidence of progression to ADD [43, 44]. A known limit of amyloid-PET imaging regards the prevalence of subjects, increasing with age, who do not develop dementia or do not present cognitive alterations in spite of a significant amyloid burden [43]. For these subjects, the topographical 18F-FDG-PET downstream biomarker fully shows its potential in ruling out ongoing neurodegenerative process in vivo. 18F-FDG-PET imaging has been indeed shown to have a valuable exclusionary role, thus really bearing a crucial added prognostic value in MCI [13 , 20]. Three out of 14 converter MCI cases were FDG negative but Amyloid positive, presenting, respectively, 6, 7, and 90 months of follow-up. This evidence supports a possible temporal dissociation between the two PET biomarkers, with an earlier positivity of amyloid-PET imaging in some cases, which supports the need of combined adoption of pathological and neurodegenerative biomarkers, when available.
Only few studies evaluated the impact of 18F-FDG-PET and 11C-PiB-PET in the same cohort of MCI subjects, although with inconsistent results, especially with regards to 18F-FDG-PET imaging [46 –49]. Overall, these studies showed lower performances of 18F-FDG-PET in the MCI to ADD conversion prediction, which is likely to be due to variability in follow-up durations and, more importantly, to the heterogeneity in the analysis methodology [46 –49]. The 18F-FDG-PET quantification methods varied from 18F-FDG-PET SUVR composite scores [46, 48], to the use of fully automated analyses [47, 49]. The higher sensitivity and specificity of 18F-FDG-PET found in the present study is likely related to 1) follow-up lengths, 2) the use of an optimized and validated SPM method for the analysis of 18F-FDG-PET data with expert image interpretation [23], and 3) the study design. As for the latter, in our retrospective study the MCI subjects within the internal database of a clinical research center are representative of a highly-selected group, not reflecting the standard consecutive population observed in a memory clinic. Even if the present results are specific to this experimental clinical scenario, the high accuracy of the optimized 18F-FDG-PET SPM method in this MCI group was comparable to the accuracy level obtained in more heterogeneous cohorts of MCI subjects, in predicting, or excluding, conversion to different dementia syndromes [17 , 23].
Conclusion
To date, there are no absolute timing algorithms for diagnosis of ADD providing clear recommendation for the use of 18F-FDG-PET and amyloid-PET imaging in a clinical setting [9, 10]. 18F-FDG-PET as a biomarker of AD- as well as non-AD neurodegeneration has shown a very high specificity, which is of utmost relevance for differential diagnosis in the early phase of dementia and for the exclusion of underlying neurodegenerative processes. On the other hand, amyloid-PET represents a unique biomarker with exceptional sensitivity for in vivo investigation of underlying cerebral AD pathology.
There is some added value for the combined use of these PET biomarkers, especially when adopted with validated quantification approaches as shown in the present study, given that the combination of these techniques improved the global accuracy of ADD conversion prediction. We suggest, however, that the recommendation for adoption of both PET techniques for MCI prognosis should be tailored on the individual cases, taking into account clinical, neuropsychological, and the availability of other biomarker data.
Finally, this work contributes to the need for standardization of core biomarkers collection and measurements and the urgency to develop evidence-based guidelines for high-level accuracy biomarkers, useful for early dementia diagnosis, and in particular for the inclusion or exclusion in prevention clinical trials [50].
Footnotes
ACKNOWLEDGMENTS
L.I. holds a ministerial fellowship granted by the Italian Ministry of Education, University and Research (Graduate program). The research received funding from the Italian Ministry of Health (Ricerca Finalizzata Progetto Reti Nazionali AD NET-2011- 02346784), from the EU FP7 INMIND Project (FP7-HEALTH-2011-two-stage “Imaging of Neuroinflammation in Neurodegenerative Diseases”, grant agreement no. 278850) and from the Joint Program on Neurodegenerative Disorders (EU-JPND) project Biomarkers for Alzheimer’s Disease and Parkinson’s Diagnostics (BIOMARKAPD).
K.C and A.N. were financially supported by the Swedish Research Council (project 05817), Swedish Brain Power, the Regional Agreement on Medical Training and Clinical Research (ALF) for Stockholm County Council, the Strategic Research Programme in Neuroscience at Karolinska Institutet, the Foundation for Old Servants, Gun and Bertil Stohne’s Foundation, KI Foundations, the Swedish Brain Foundation, the Swedish Alzheimer’s Foundation (Alzheimerfonden), Demensfonden, the Wenner-Gren Foundation, the European Union’s Seventh Framework Programme (FP7/2007-2013) under grant agreement n° HEALTH-F2-2011-278850 (INMiND), and the Swedish Foundation for Strategic Research (SSF).
KC and AN wish to thank Mr. Johan Lilja for support related to the imaging software VOIager. LI, PA, VB, and DP wish to thank Dr. Luca Presotto for its assistance in image handling and Dr. Tommaso Ballarini and Dr. Silvia Paola Caminiti for their comments on the work.