
Abstract
Background:
Despite common pathology, Alzheimer’s disease (AD) can have multiple clinical presentations which pathological studies suggest result from differences in the regional distribution of tau pathology. Positron emission tomography (PET) ligands are now available that can detect tau proteins in vivo and hence can be used to investigate the biological mechanisms underlying atypical AD.
Objective:
To assess regional patterns of tau uptake on PET imaging in two atypical AD variants, posterior cortical atrophy (PCA) and logopenic progressive aphasia (lvPPA).
Methods:
Eighteen PCA and 19 lvPPA subjects that showed amyloid-β deposition on PET underwent tau-PET imaging with [18F]AV-1451. Group comparisons of tau uptake in PCA and lvPPA were performed using voxel-level and regional-level analyses. We also assessed the degree of lobar tau asymmetry and correlated regional tau uptake to age and performance on clinical evaluations.
Results:
Both syndromes showed diffuse tau uptake throughout all cortical regions, although PCA showed greater uptake in occipital regions compared to lvPPA, and lvPPA showed greater uptake in left frontal and temporal regions compared to PCA. While lvPPA showed predominant left-asymmetric tau deposition, PCA was more bilateral. Younger subjects showed greater tau uptake bilaterally in frontal and parietal lobes than older subjects, and sentence repetition, Boston naming test, simultanagnosia, and visuoperceptual function showed specific regional tau correlates.
Conclusion:
Tau deposition is closely related to clinical presentation in atypical AD with age playing a role in determining the degree of cortical tau deposition.
INTRODUCTION
Alzheimer’s disease (AD) can have many different clinical presentations, despite a common underlying pathology of amyloid-β (Aβ) and tau deposition in the brain. Pathological studies have shown that there is little association between location and density of Aβ deposition and cortical atrophy or clinical symptoms in AD; the location and density of tau neurofibrillary tangles at autopsy, on the other hand, have shown stronger correlations with both atrophy and symptoms [1–4]. Until recently, investigating the distribution of tau deposition has only been possible postmortem, but PET ligands, such as [18F]AV-1451, have now been developed that can detect tau proteins in vivo in patients with AD [5, 6]. This technology can thus be used to investigate the relationship between tau deposition and clinical presentation during life in AD.
The two most commonly recognized atypical clinical variants of AD are posterior cortical atrophy (PCA) [7, 8] and logopenic progressive aphasia (lvPPA) [9]. Posterior cortical atrophy is characterized by difficulties with visuospatial, visuoperceptive, and praxic skills; these deficits can also be accompanied by Balint’s or Gerstmann’s syndromes [7, 11]. In contrast, lvPPA typically presents with language difficulties, including impaired single-word retrieval, difficulties with sentence repetition, and phonological errors, some of which are believed to be caused by impairment in the phonological loop of working memory [12–14]. The majority of patients diagnosed with either PCA or lvPPA have underlying AD pathology or show Aβ deposition on PET [15–18].
These two disorders are associated with different, although somewhat overlapping, patterns of neurodegeneration as measured on volumetric MRI and [18F] fluorodeoxyglucose PET. The main regions of involvement in PCA include the occipital, parietal, and occipito-temporal regions [17, 19], while those affected in lvPPA include the posterior portions of the superior and middle temporal lobe, the inferior parietal lobe, and the temporo-parietal junction [20, 21]. Patterns of neurodegeneration are usually asymmetric in lvPPA, involving the left hemisphere greater than right, and can also be asymmetric in PCA [22], more commonly involving the right hemisphere. Given the close association between tau deposition in the brain and the presence of neurodegeneration, one could hypothesize that patterns of tau uptake on [18F]AV-1451 PET would also differ between these two atypical AD syndromes. Understanding how tau deposition differs between lvPPA and PCA will increase understanding of the biological mechanisms underlying clinical variability in AD and may help improve recognition and diagnosis of these syndromes.
Therefore, the goal of this study was to assess and compare the regional patterns of tau uptake using [18F]AV-1451 PET in a cohort of PCA and lvPPA subjects. We also aimed to investigate whether asymmetry in tau uptake differed across the syndromes, and determine whether regional tau uptake correlates with clinical performance in these groups.
METHODS
Subjects
All subjects were recruited from the Mayo Clinic Department of Neurology into an NIH-funded study assessing atypical AD. Each subject underwent thorough neurological and neuropsychological evaluations, [18F]AV-1451 and Pittsburgh Compound B (PiB) PET imaging and a volumetric MRI. To be included in the study subjects had to meet clinical criteria for either PCA [7] or lvPPA [12] and show evidence of Aβ deposition on PiB-PET. Thirty-seven subjects were included in the study, of which 18 met criteria for PCA and 19 for lvPPA. These 37 patients were matched by age and gender to 111 healthy controls that had undergone [18F]AV-1451 PET imaging at Mayo Clinic. The controls were participants in the Mayo Clinic Study of Aging [23]. The study was approved by the Mayo Clinic IRB, and all subjects consented to participate in this study.
Neurological and neuropsychological evaluations
All neurological assessments were performed by one of two Behavioral Neurologists (KAJ and JGR). The neurological evaluation included the Montreal Cognitive Assessment Battery (MoCA) [24] to assess general cognitive function, the Clinical Dementia Rating (CDR) Scale [25] to assess functional ability, the brief questionnaire version of the Neuropsychiatric Inventory (NPI-Q) [26] to assess psychiatric and behavioral features and the Movement Disorder Society-sponsored revision of the Unified Parkinson’s Disease Rating Scale (MDS-UPDRS) Part III [27] to assess Parkinsonism. In addition, in order to capture symptoms typically associated with lvPPA, the 15-item Boston Naming Test (BNT) [28] was used to assess naming, and the Repetition of Sentences subtest of the Boston Diagnostic Aphasia Examination (BDAE) [29] was used to assess sentence repetition. Specific features characteristic of PCA were also assessed. The presence/absence of oculomotor apraxia and optic ataxia were assessed on neurological examination. Oculomotor apraxia was defined as the inability to voluntarily direct one’s gaze to a particular point. Optic ataxia was defined as the impairment of goal-directed hand movements toward visually presented targets. A subject was considered to have the Gerstmann syndrome if they had three or more of the following symptoms: acalculia (3 or less on MoCA calculation), left-right confusion, agraphia, or finger agnosia. The severity of simultanagonia was determined on a 20-point scale with 20 being the best score. The simultanagnosia test was designed to assess the individual’s ability to perceive the overall meaning/shape of the figure/object/picture instead of recognizing bits and pieces, and included, for example, pictures of overlapping line drawings, pictures of fragmented numbers, and pictures of objects/letters whose shape was created from smaller items. In addition, the Visual Object and Space Perception Battery (VOPS) [30] incomplete letters test was used to assess visual perception, the Rey-Osterrieth (Rey-O) Complex Figure test [31] was used to assess visual spatial abilities, and the Wechsler Memory Scale-III (WMS-III) Visual reproduction test [32] was used to assess visual memory. The Rey-O and WMS-III% retention scores were expressed as Mayo Older American Normative (MOANS) age-adjusted scale scores which are constructed to have a mean of 10 and standard deviation of 3 among cognitively healthy people.
Tau-PET analysis
Tau-PET imaging was performed using the [18F]AV-1451 ligand and amyloid-PET imaging was performed using PiB-PET. The radiolabeling protocol for [18F]AV-1451 is as follows: A solution of AV-1622 Precursor in DMSO is treated with Cryptand 2.2.2-K2CO3 [18F]fluoride (for [18F]fluoride incorporation) followed by aqueous HCl (for removal of the Boc-protecting group) and aqueous NaOH (for neutralization). The resulting reaction mixture is concentrated on a solid-phase extraction (SPE) cartridge. The retained flortaucipir F 18 is then eluted from the SPE cartridge, purified using semi-preparative high pressure liquid chromatography, concentrated on and eluted off an additional SPE cartridge, and formulated in 10% ethanol/90% Sodium Chloride Injection [33]. All PET scans were acquired using a PET/CT scanner (GE Healthcare, Milwaukee, Wisconsin) operating in 3D mode. For tau-PET, an intravenous bolus injection of approximately 370 MBq (range 333–407 MBq) of [18F]AV-1451 was administered, followed by a 20-min PET acquisition performed 80 min after injection. For PiB-PET, subjects were injected with PiB of approximately 628 MBq (range, 385–723 MBq) and after a 40-min uptake period a 20-min PiB scan was obtained consisting of four 5-min dynamic frames following a low dose CT transmission scan. Standard corrections were applied. Emission data was reconstructed into a 256×256 matrix with a 30-cm FOV (Pixel size = 1.0 mm, slice thickness = 1.9 6 mm). All subjects had a 3T MPRAGE sequence performed on the same day as the tau-PET, as previously described [34].
Analysis of [18F]AV-1451 tau uptake was performed both at the region-of-interest (ROI) and voxel-level using SPM12 software. [18F]AV-1451 images were co-registered to each subject’s MRAGE. Regional grey and white matter tau uptake was then calculated by transforming the Mayo Clinic Adult Lifespan Template (MCALT) (https://www.nitrc.org/projects/mcalt/) into the native space of each MPRAGE using ANTs software [35]. Median tau uptake was calculated for 54 ROIs covering the entire cortex, as well as basal ganglia and thalamus. Median [18F]AV-1451 uptake in each ROI was divided by median uptake in the cerebellar crus to create standard uptake ratios (SUVRs). Lobar-level median tau uptake was also calculated in the same manner, as a weighted average median uptake across lobe in each hemisphere. Asymmetry scores were calculated for each lobar ROI as: left SUVR-right SUVR. In addition, each subject was designated as asymmetric for each lobe if the absolute asymmetry score (i.e., difference between left and right) was greater than 0.10 SUVR.
A voxel-level analysis was also performed to examine global patterns of uptake in each group compared to controls. All MPRAGE scans were spatially normalized to the MCALT template and segmented using the unified segmentation model [36]. All voxels in the MPRAGE-space [18F]AV-1451 images were divided by median uptake in cerebellar crus grey matter to create SUVR images. These images were then normalized to the MCALT template using the normalization parameters from the MPRAGE normalization. Voxel-level comparisons were performed using two-sided T-tests in SPM12, with results assessed at p < 0.001 after correction for multiple comparisons using family wise error correction. Age and gender were included in the analysis as covariates.
Grey matter analysis
A secondary voxel-level analysis was performed to examine patterns of grey matter volume loss in each group compared to controls. The custom template space grey matter segmentations created above were modulated and smoothed at 8 mm full width at half maximum. Voxel-level comparisons were performed using two-sided T-tests in SPM, with results assessed at p < 0.001 after correction for multiple comparisons using family wise error correction. Age and gender were included in the analysis as covariates.
Statistics
The statistical analyses of the ROI-level data were performed using R [37] version 3.4.1. Inter-group comparisons of tau SUVR, asymmetry scores, and clinical variables were performed using Mann-Whitney U tests and all p-values were reported after correction for false discovery rate (FDR). Group differences were summarized with the area under the receiver operating characteristic curve (AUROC). The AUROC is a non-parametric effect size estimate that does not depend on the scale of the measurement, thus allowing for a comparison of the strength of group discrimination across different neuroimaging metrics [38]. Finally, Spearman rank correlations were performed to correlate lobar SUVRs with age, disease duration and clinical test scores (MoCA, BNT, BDAE repetition, simultanagnosia, and VOSP letters) across all 37 subjects. Given that there is no consensus as to which method is preferred for tau-PET analysis, our analyses were performed using non partial volume corrected (PVC) tau-PET images but were also repeated using PVC tau-PET images.
RESULTS
Demographics
No differences were observed between PCA and lvPPA in age at scan or gender (Table 1). The two groups performed similarly on the MoCA, NPI-Q, MDS-UPDRS III, BNT, BDAE Sentence Repetition, and WMS-III VR% retention; PCA performed significantly worse on tests for simultanagnosia, optic ataxia, oculomotor apraxia, Gerstmann, VOSP incomplete letters, and Rey-O (Table 1).
Demographic and clinical features of the lvPPA and PCA groups
Data are shown as Median (Q1, Q3) or N (%); significant p-values are bolded. MoCA, Montreal Cognitive Assessment Battery; CDR, Clinical Dementia Rating; NPI-Q, Neuropsychiatric Inventory Brief Questionnaire; MSD-UPDRS III, Movement Disorder Society Unified Parkinson’s Disease Rating Scale Part III; BNT, Boston Naming Test; BDAE, Boston Diagnostic Aphasia Examination; VOSP, Visual Object and Space Perception battery; Rey-O MOANS, Rey Osterrieth Mayo Older American Normative scale; WMS-III VR% retention MOANS, Wechsler Memory Scale-III Visual Reproduction MOANS; PiB SUVR, Pittsburgh Compound B Standardized Uptake Value Ratio.
Group comparisons of tau uptake
Patients versus controls
The PCA group showed increased uptake bilaterally in the occipital, temporal and parietal lobes, with less striking uptake also observed in the frontal lobes (Figs. 1 and 2). In contrast, increased tau uptake was observed throughout the left hemisphere of the brain in lvPPA, particularly involving the lateral temporal lobe, but also the medial and lateral parietal and frontal lobes, with less striking involvement of the occipital lobe compared to controls (Figs. 1 and 2). Similar, although less severe, patterns of uptake were observed in the right hemisphere. The highest AUROCs discriminating PCA from controls were observed for left and right lateral occipital regions, while the highest AUROCs discriminating lvPPA from controls were observed for left lateral temporal and parietal regions (Fig. 3).

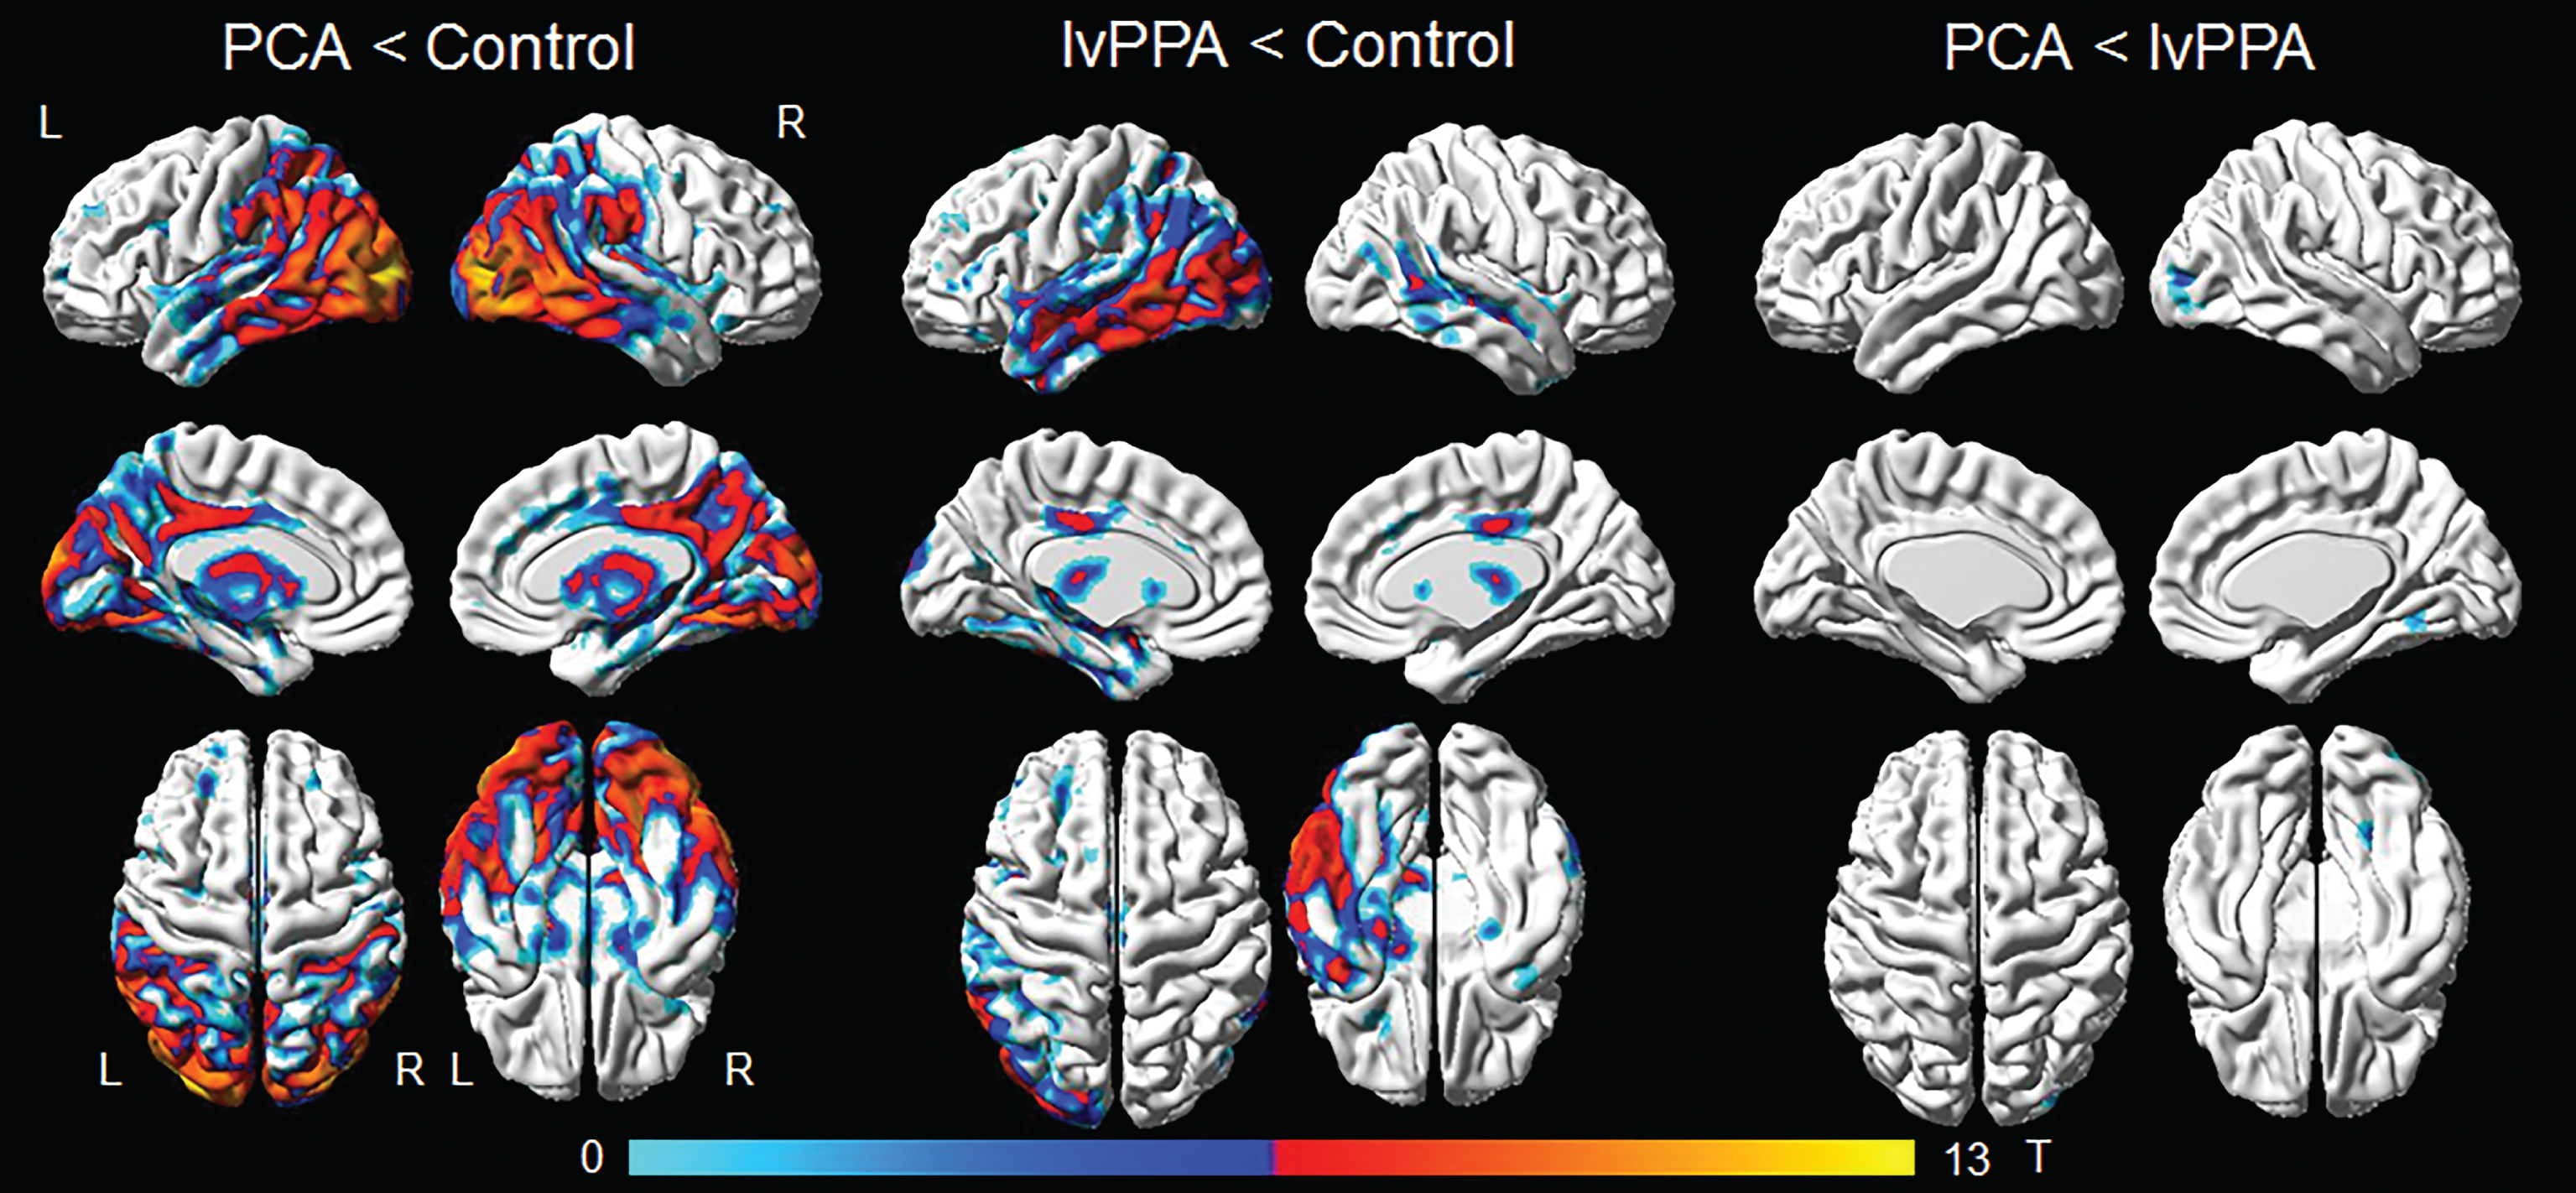
Voxel-level comparisons of tau PET uptake in PCA, lvPPA, and controls. Results are shown at p < 0.001 corrected for multiple comparisons using the family wise error correction.
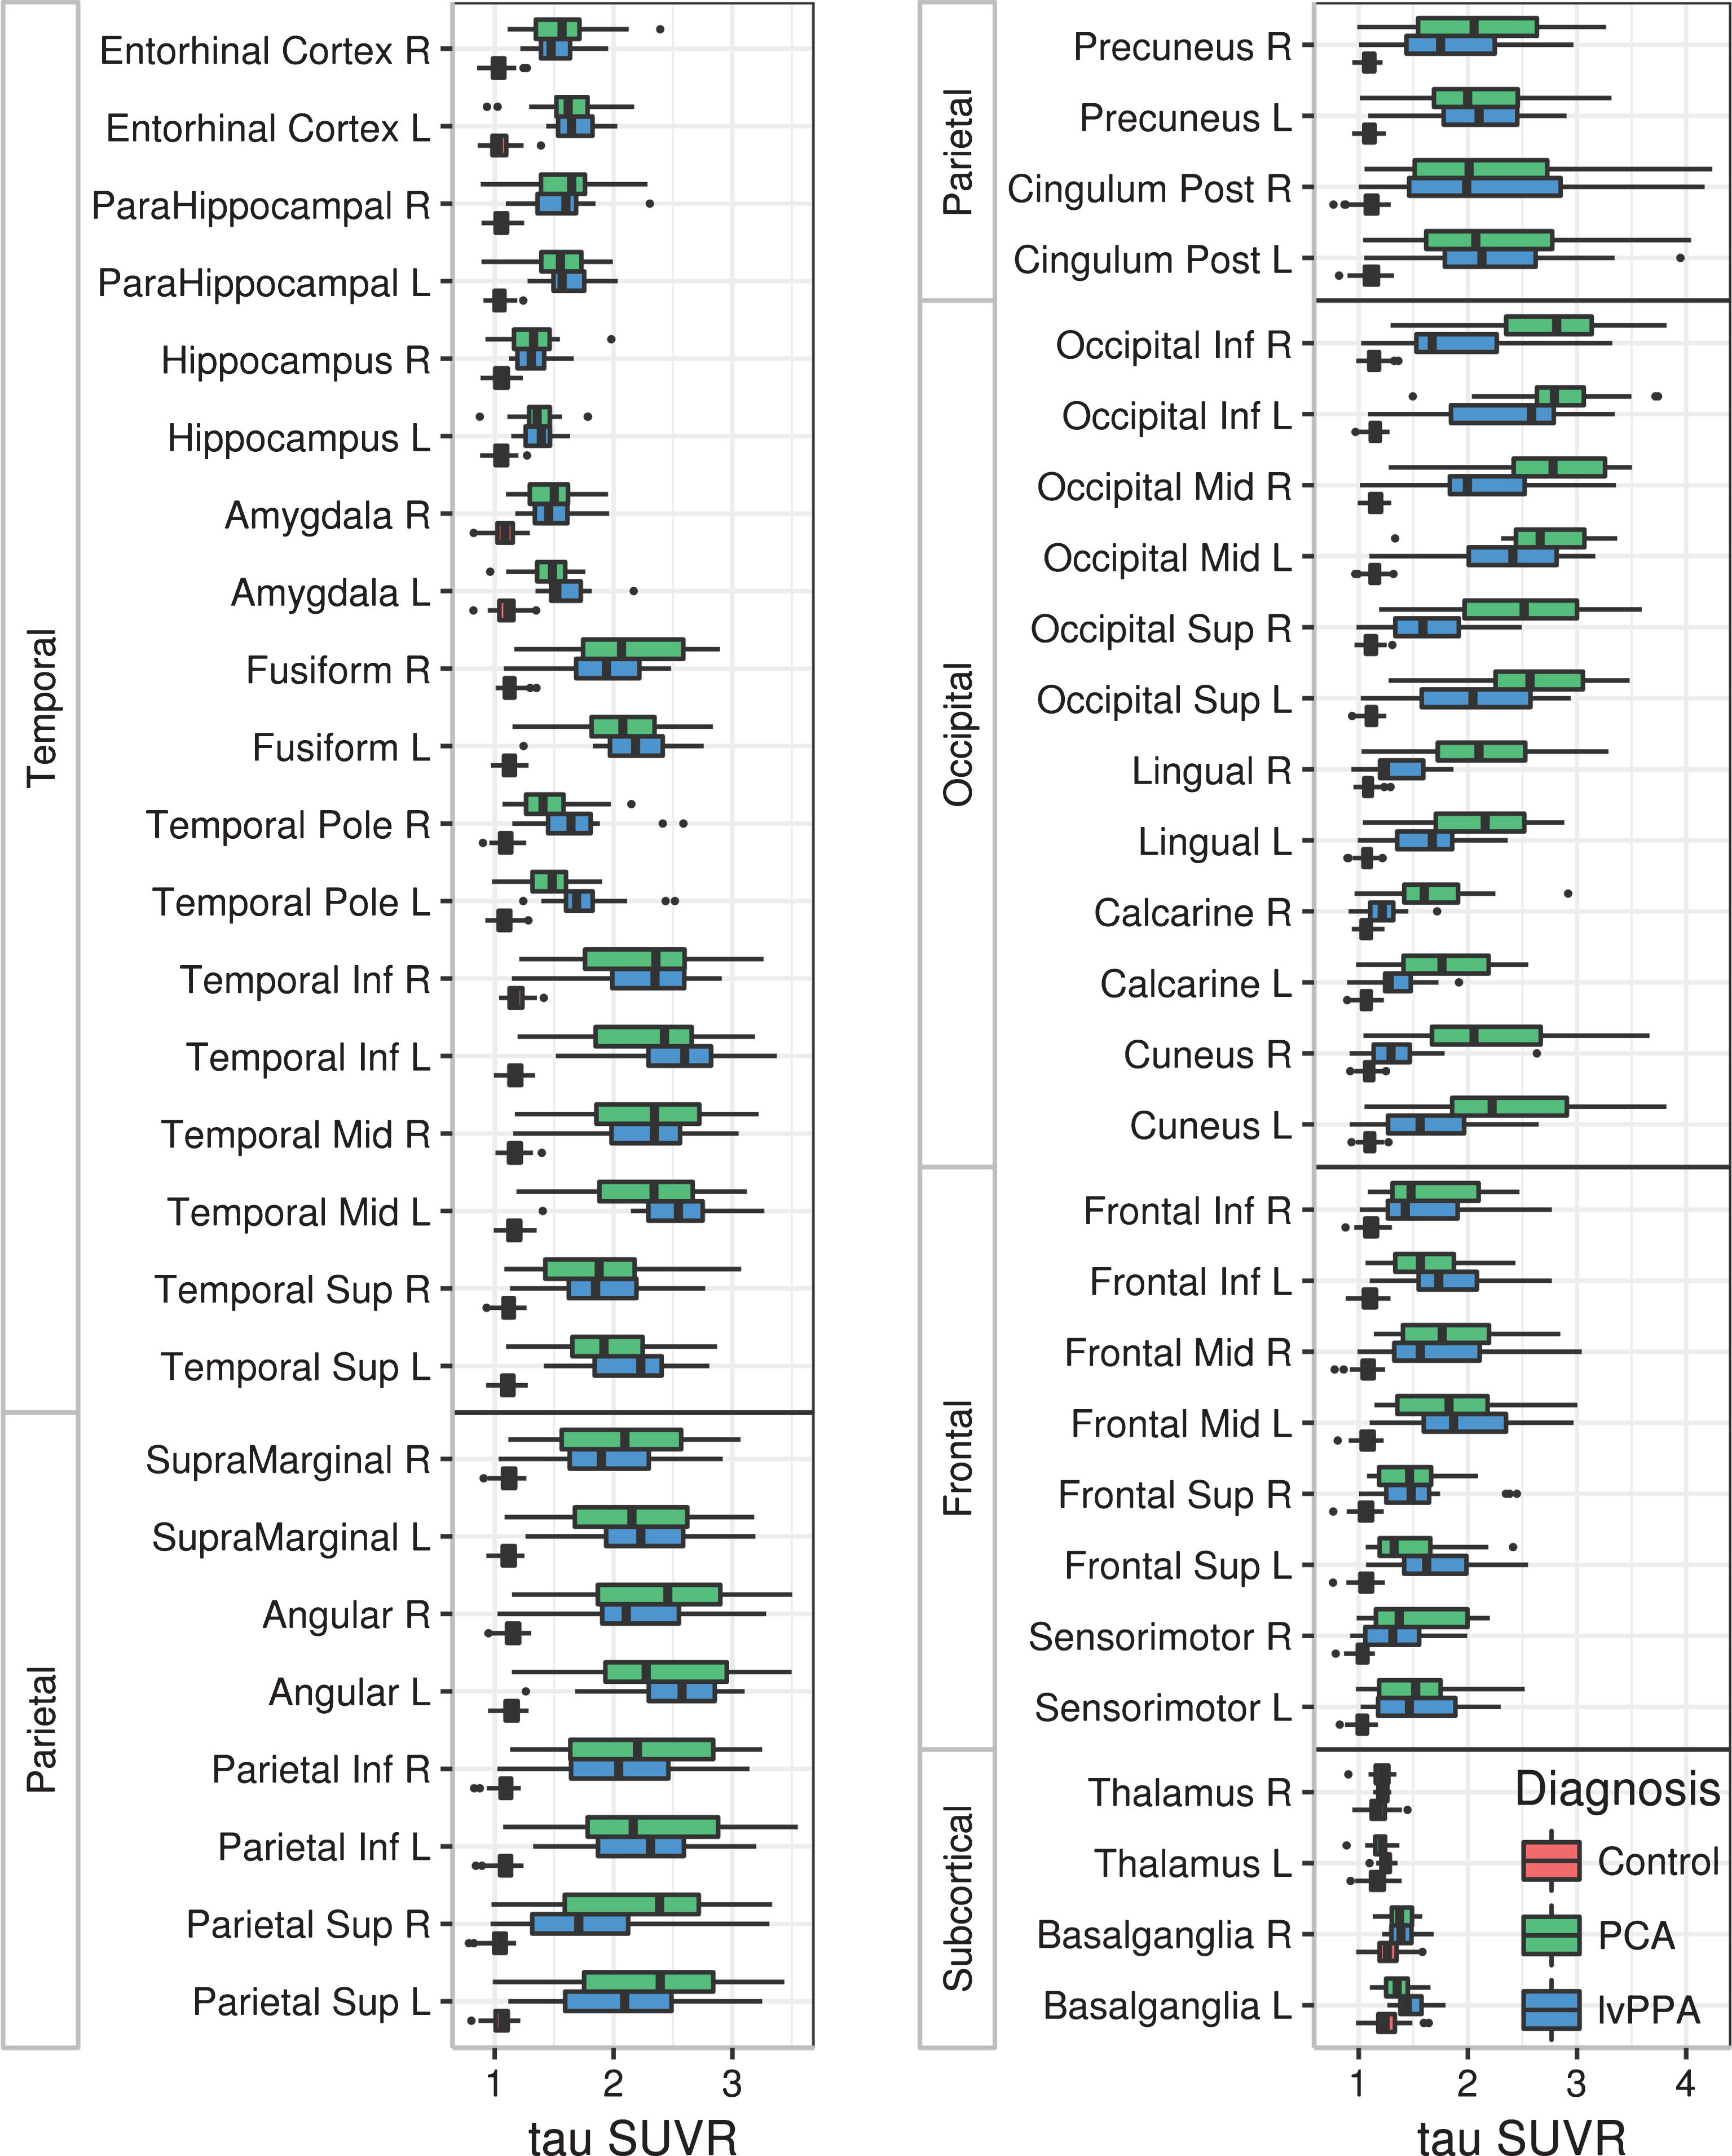
Box-plots showing regional tau SUVRs for PCA, lvPPA, and controls. Boxes represent median, 25th and 75th quartiles, and whiskers extend to 1.5 x the quartiles. Subject data points that are beyond the whiskers are shown.
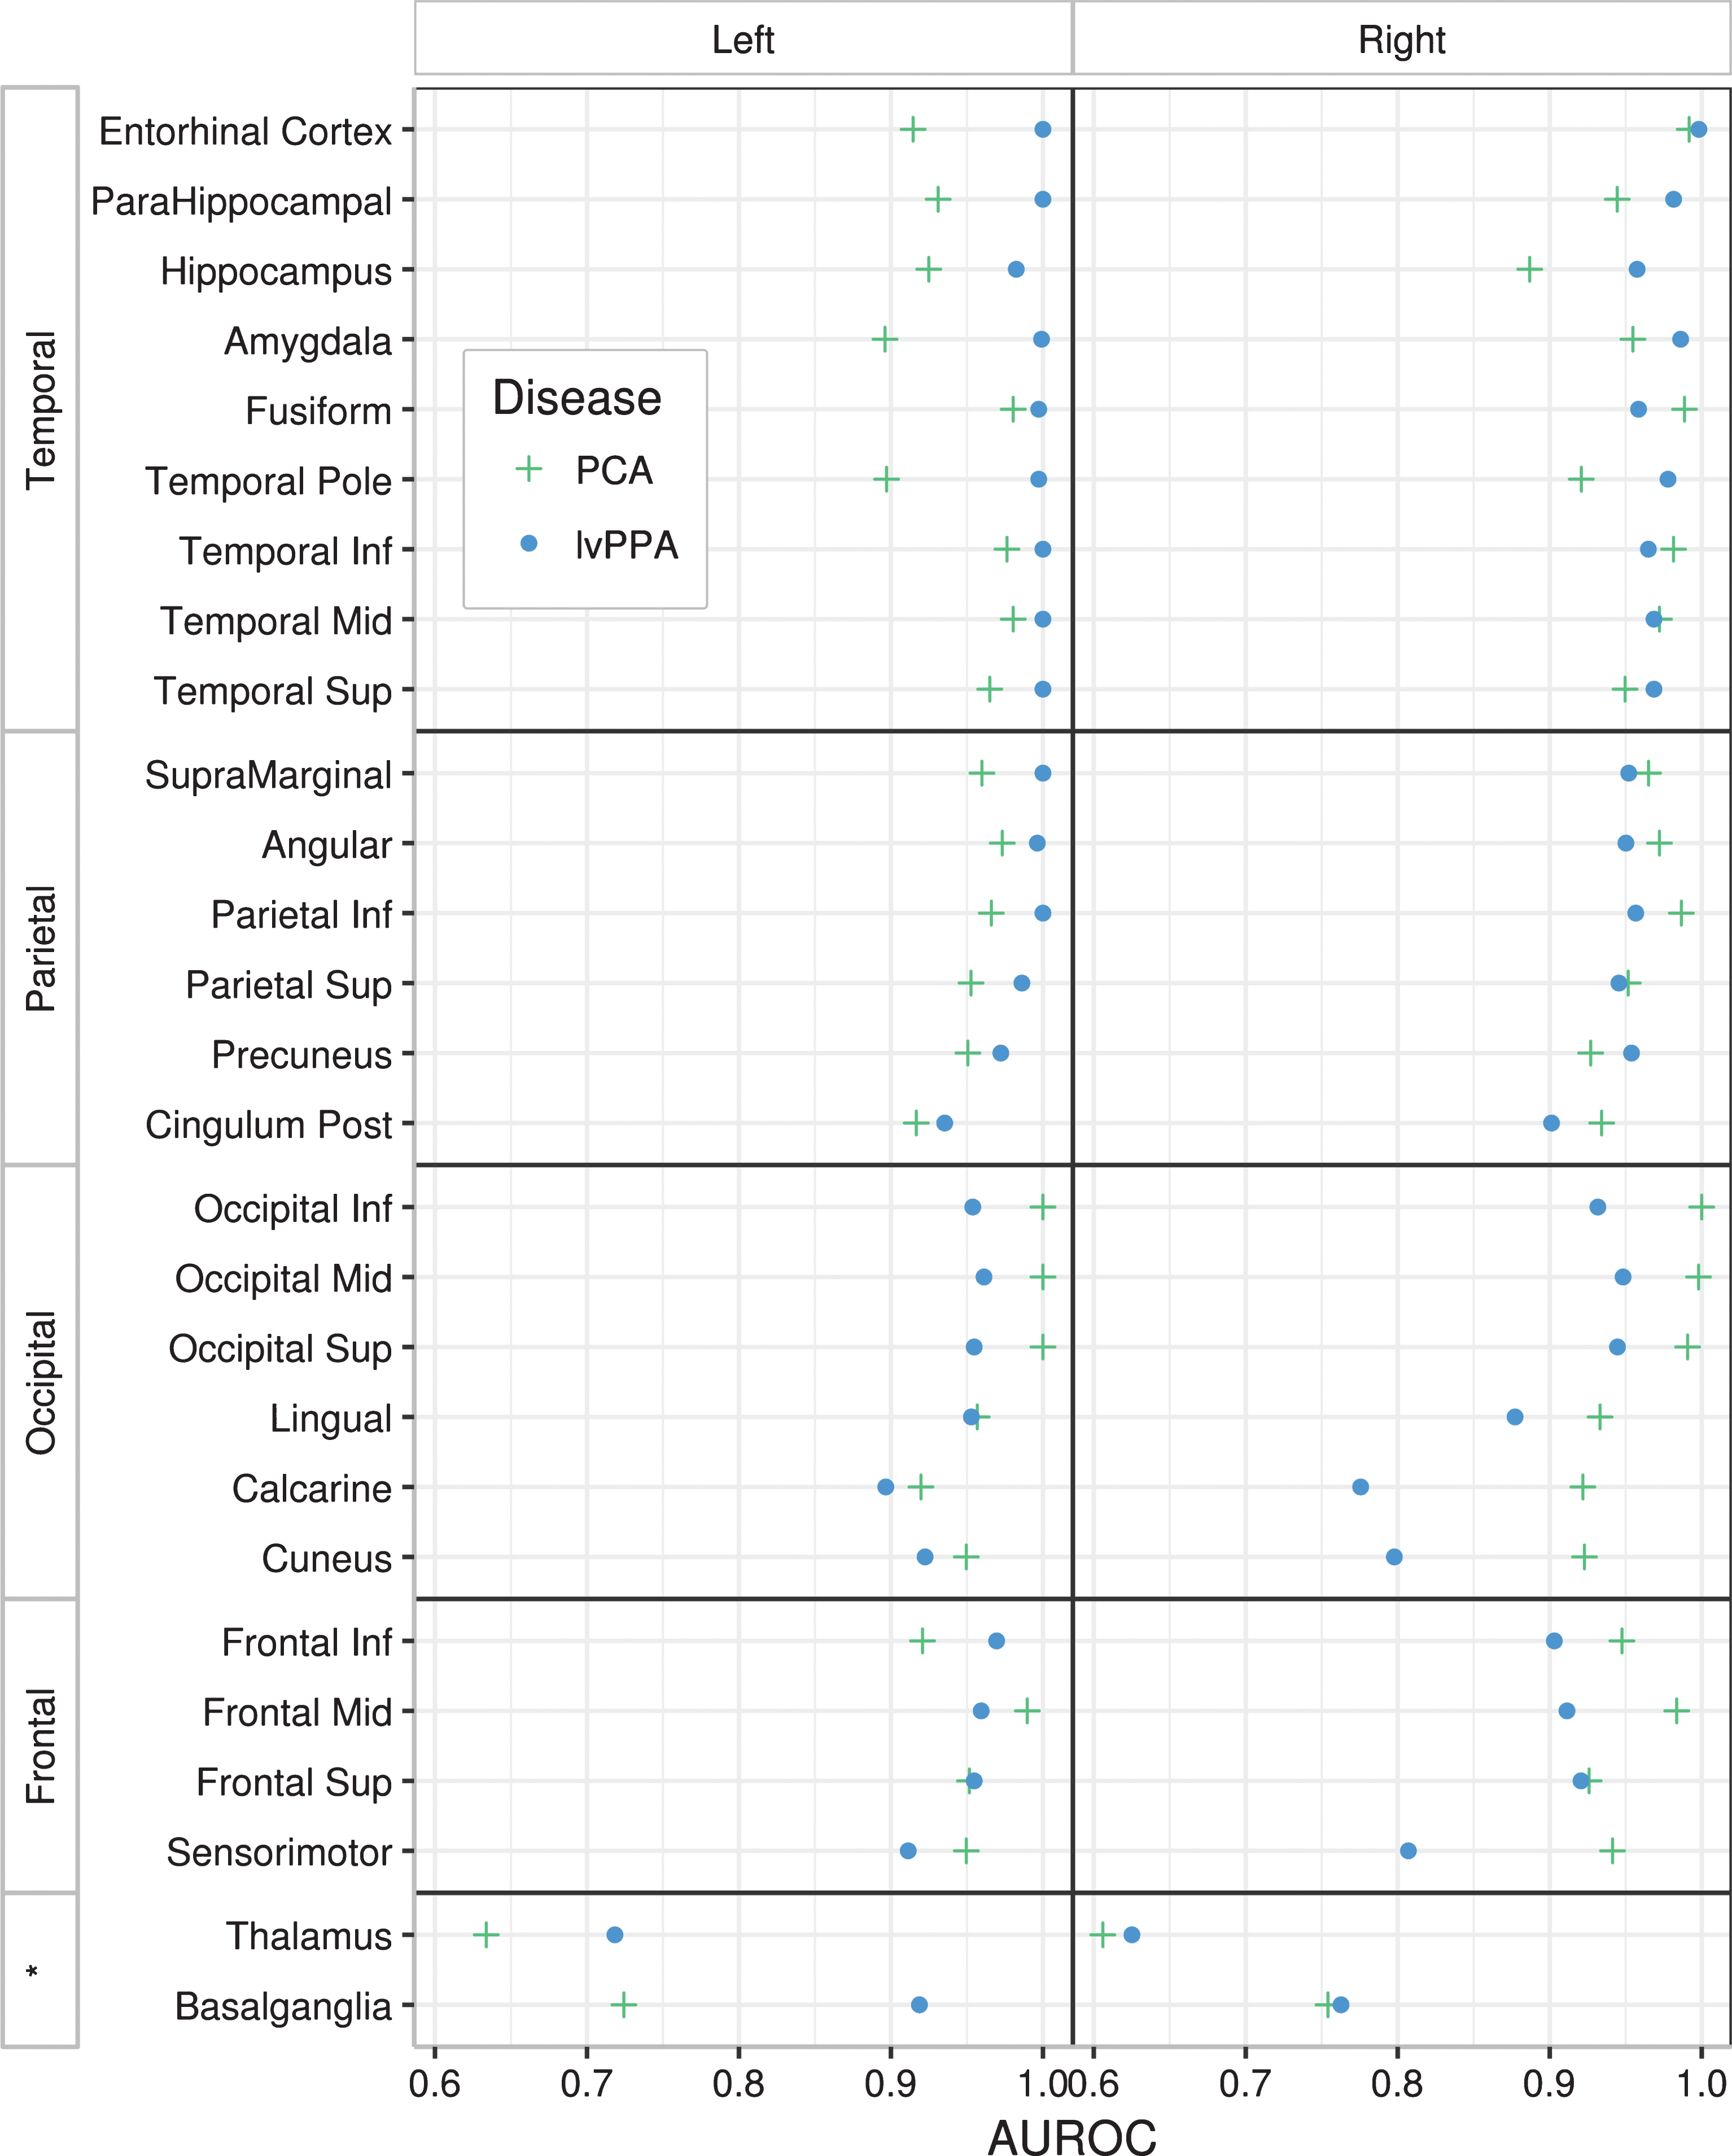
Plots showing AUROC values depicting how well tau SUVR in each region differentiates PCA from controls, and lvPPA from controls. AUROCs are shown separately for the left and right hemisphere. *indicates subcortical regions.
Increased tau uptake was also observed in left and right medial temporal regions, including hippocampus, parahippocampal gyrus, entorhinal cortex and amygdala, and temporal pole in both PCA and lvPPA compared to controls (Fig. 2), although these regions tended to have lower SUVRs compared to cortical regions (Fig. 2). The only regions that did not show bilaterally significant differences in tau uptake between both patient groups and controls were the thalamus and basal ganglia (Fig. 2).
PCA versus lvPPA
Comparing PCA and lvPPA directly revealed disease specific regions of tau deposition. On the voxel-maps, PCA showed increased tau uptake throughout the occipital lobe, bilaterally, but more so in the right hemisphere, compared to lvPPA (Fig. 1). lvPPA showed increased tau uptake in the left temporal lobe, particularly the temporal pole, and medial prefrontal cortex compared to PCA (Fig. 1).
In the ROI analysis, PCA showed significantly greater uptake bilaterally in the cuneus, calcarine, and lingual regions, as well as in right inferior, middle, and superior occipital lobe (FDR adjusted p < 0.05), compared to lvPPA. Conversely, lvPPA showed greater tau uptake in the left temporal pole (FDR adjusted p = 0.03) compared to PCA. These results were similar when using PVC tau-PET images, with the addition of the left basal ganglia uptake being significantly higher in lvPPA than PCA.
Tau asymmetry assessment
Both the PCA and lvPPA groups showed greater absolute asymmetry scores in all four lobes compared to controls (Table 2). lvPPA showed greater asymmetry in the parietal and occipital lobes compared to PCA (Table 2). Asymmetry of tau uptake was variable in PCA, with right-sided, left-sided, and bilateral patterns observed (Table 3). The majority of the lvPPA subjects showed left-sided asymmetry in all four lobes (Table 3).
A comparison of absolute lobar asymmetry scores across groups
Data are shown as Median (Q1, Q3); significant p-values are bolded.
Percent (%) of asymmetric subjects per clinical group
Clinical correlations with tau uptake
Regional tau uptake was correlated with some demographic and clinical variables across the PCA and lvPPA subjects (Table 4). Greater tau uptake in left and right frontal and parietal lobes, as well as left occipital and right temporal lobes, correlated with younger age at PET. Poorer performance on the BDAE Sentence Repetition test correlated with increased tau uptake in the left parietal lobe and bilaterally in the frontal and temporal lobes, with poorer performance on the BNT correlated with increased tau uptake in the temporal lobes. Increased severity of simultanagnosia and poorer performance on VOSP incomplete letters both correlated with increased tau uptake bilaterally in the occipital lobe. These correlations were also observed in the PVC analyses.
Spearman correlations between lobar tau uptake and clinical variables
p-values that were significant after a single FDR correction across all comparisons are bolded.
Group comparisons of grey matter volume
The PCA group showed volume loss bilaterally in the medial and lateral occipital and parietal lobes, lateral temporal lobes, posterior hippocampus, and parahippocampal gyrus compared to controls (Fig. 4). The lvPPA group showed volume loss predominantly in the left lateral temporal lobe, with less severe volume loss observed in the right lateral temporal lobe. On direct comparison, PCA showed greater volume loss in the right occipital lobe and fusiform gyrus compared to lvPPA. No regions showed greater loss in lvPPA compared to PCA.
Voxel-level comparisons of grey matter volume loss in PCA, lvPPA, and controls. Results are shown at p < 0.001 corrected for multiple comparisons using the family wise error correction.
DISCUSSION
We have shown that both PCA and lvPPA are characterized by widespread cortical tau deposition, although there was evidence for differences between the syndromes, with PCA showing greater uptake in the occipital lobe and lvPPA showing greater uptake in some left frontal and temporal regions; sub-cortical regions were less affected in both diseases. Both diseases were asymmetric in terms of tau uptake; however, lvPPA is strikingly left-predominant, while PCA is more variable. We also found evidence that regional tau deposition is associated with specific clinical features in these atypical AD syndromes.
The regional distribution of tau uptake we observed in both PCA and lvPPA fit well with the previously described patterns of neurodegeneration associated with these syndromes, as well as the distribution of tau pathology observed at autopsy [1, 39]. In line with studies that have looked at autopsy data, we found that tau uptake was greater in the cortex compared to the medial temporal lobes in both syndromes [40, 41], possibly reflecting the fact that non-memory symptoms dominate the clinical presentation in both syndromes. Another consistent feature was that PCA and lvPPA showed less elevated tau uptake in the thalamus and basal ganglia; a feature that could help differentiate these AD syndromes from other neurodegenerative diseases that target these regions, such as progressive supranuclear palsy [42]. Although patterns of tau uptake overlapped to a relatively large degree in lvPPA and PCA, we did find regions that differed between the syndromes. The most striking difference was the finding that PCA had greater tau uptake throughout the right occipital regions compared to lvPPA. Two previous group-level tau-PET studies have compared PCA and lvPPA, with both finding greater tau uptake in the medial parietal lobe in PCA [4, 43], and one finding greater involvement of the occipital lobe [4]. Discrepancies between these studies and with our findings may be due to the small number of subjects in the previous studies, which had sample sizes of n = 7 or less. We also found evidence that lvPPA has greater tau uptake compared to PCA in frontal and temporal regions, consistent with one previous study [43]. These group differences provide a potential biological explanation for the clinical differences observed between these two AD syndromes; a hypothesis that is supported by the correlations we observed between tau uptake and clinical performance that are discussed below.
Past studies have shown asymmetric patterns of FDG hypometabolism and grey matter atrophy in PCA and lvPPA cohorts. Cerebral atrophy and FDG hypometabolism in PCA has shown right-sided asymmetry, with the occipital lobe being the most affected [17, 44]. lvPPA, on the other hand, has been shown to have left-predominant asymmetry in both atrophy and FDG hypometabolism, primarily in the left posterior temporal, lateral temporal, inferior parietal, and inferior frontal regions [13, 45]. In this study, we have shown that both PCA and lvPPA can have asymmetric patterns of tau uptake. Tau uptake was relatively bilateral in the PCA cohort, especially in the occipital regions; nonetheless, PCA patients did commonly show right or left predominance. lvPPA showed left-sided asymmetry in all lobar regions, most prominently in the frontal, parietal, and occipital regions, with the majority of subjects showing left-sided asymmetric patterns. The temporal lobes also showed significant asymmetry but had the highest proportion of subjects with bilateral patterns. We could hypothesize that the lower degree of asymmetry in the temporal lobes may reflect the fact that tau deposition spreads to the right temporal lobe before other regions in the right hemisphere in lvPPA; a hypothesis that will need to be tested in longitudinal studies. These tau-PET findings of hemispheric asymmetry are particularly valuable because autopsy studies are typically performed with only one hemisphere, and hence do not allow the assessment of asymmetry in tau pathology. The fact that we looked at tau in both hemispheres, and that it seems to match asymmetry in grey matter atrophy and FDG hypometabolism, supports an association between tau deposition and cerebral atrophy [1–3, 46].
We also found evidence for a relationship between the degree of tau deposition and age at the time of the PET scan. Tau uptake in frontal and parietal lobes, bilaterally, showed a strong negative correlation with age, with weaker correlations in the occipital and temporal regions, such that younger patients had increased tau deposition. This mirrors findings in typical AD, where patients with early onset AD have increased cortical tau uptake compared to their late onset counterparts, specifically in parietal regions, which has been hypothesized to be a result of increased neuro-inflammation in the younger patients [47]. Our findings demonstrate that this age effect is present even within a relatively young cohort of only atypical AD subjects.
Strong negative correlations were also observed between tau uptake and clinical features in atypical AD suggesting a close relationship between tau deposition and clinical presentation. Tau uptake bilaterally in the frontal and temporal lobe was associated with deficits in sentence repetition, as well as in the left parietal region, likely reflecting disruption of the language network [48]. Tau uptake in both temporal lobes was also associated with poorer naming, concordant with the role of the temporal lobes in anomia and semantic processing [49]. Tau uptake bilaterally in the occipital lobe was related to severity of both simultanagnosia and visuoperceptual function, features which have previously been associated with dysfunction in the occipital lobe [4, 50–52]. Given that these tests evaluate clinical symptoms related to PCA and were negatively correlated with tau in the occipital regions, which was the most affected in this cohort, these exams may be good predictors of tau deposition. We did not observe any correlations between general cognitive ability measured on the MoCA and tau-PET uptake, perhaps suggesting that the MoCA is not anatomically specific.
Although this study was not designed to assess the topographic similarity in patterns of tau uptake and atrophy in our cohort, we did find that the pattern of tau uptake was similar to the pattern of grey matter loss in both PCA and lvPPA. Grey matter atrophy was, however, notably less severe and widespread than tau uptake, as others have noted [43]. For example, we observed elevated tau uptake, but very little atrophy, in the frontal lobes in both PCA and lvPPA, with atrophy in lvPPA mainly restricted to the lateral temporal lobes. This may have a biological explanation; possibly reflecting the fact that tau deposition likely precedes atrophy. However, it is unclear whether the same statistical threshold is appropriate for these different types of neuroimaging data, with different underlying properties, and hence one should be cautious in drawing conclusions from comparisons of thresholded maps.
Strengths of our study were that all subjects underwent identical clinical and imaging assessments, and we corrected the data for partial volume effects and showed that this correction did not significantly affect the findings. A limitation, however, was the relatively small number of subjects. While non-parametric statistical methods were used in the ROI-based analysis, the voxel-based analysis utilized parametric statistical tests which may have been biased by the small sample size. Another weakness was that the PCA cohort had a trend for longer disease duration than the lvPPA cohort (FDR p = 0.07). It is possible that we may have observed more regions with greater tau uptake in lvPPA compared to PCA, had the two disease groups had more similar durations. In addition, while tau-PET is relatively specific for AD neurofibrillary tangles, we have shown that tau-PET signal can be seen in off-target sites and other tauopathies, and these findings may need to be validated by autopsy studies [53]. All of our subjects showed Aβ deposition supporting an underlying AD pathology; future studies will be needed to determine whether tau PET uptake differs in PCA and lvPPA subjects without Aβ deposition.
In summary, this study demonstrates that tau is densely and diffusely present throughout the majority of cortical regions in both PCA and lvPPA. Even so, the findings of this study show that tau-PET scans have potential to distinguish different types of atypical AD variants. Particularly, PCA and lvPPA can be distinguished by the amount of tau uptake in the occipital regions, where PCA subjects have increased tau deposition compared to lvPPA subjects, particularly in the right hemisphere. We also provide evidence that tau deposition is closely related to clinical presentation in AD and that age plays an important role in determining the degree of cortical tau deposition.
Footnotes
ACKNOWLEDGMENTS
This study was funded by NIH grants R01-AG50603, R21-NS94684, and U01 AG006786 as well as The Elsie and Marvin Dekelboum Family Foundation. We would like to thank Drs. Ronald Petersen and David Knopman for providing data from the healthy control subjects. We would also like to thank AVID Radiopharmaceuticals for their support in supplying AV-1451 precursor, chemistry production advice and oversight, and FDA regulatory cross-filing permission and documentation needed for this work.