
Abstract
Health-care professionals, patients, and families seek as much information as possible about prognosis for patients with Alzheimer’s disease (AD); however, we do not yet have a robust understanding of how demographic factors predict prognosis. We evaluated associations between age at presentation, age of onset, and symptom length with cognitive decline as measured using the Mini-Mental State Examination (MMSE) and Clinical Dementia Rating sum-of-boxes (CDR-SOB) in a large dataset of AD patients. Age at presentation was associated with post-presentation decline in MMSE (p < 0.001), with younger patients showing faster decline. There was little evidence of an association with change in CDR-SOB. Symptom length, rather than age, was the strongest predictor of MMSE and CDR-SOB at presentation, with increasing symptom length associated with worse outcomes. The evidence that younger AD patients have a more aggressive disease course implies that early diagnosis is essential.
INTRODUCTION
Dementia is a syndrome affecting more than 35 million people worldwide, with numbers predicted to increase to more than 65 million by 2030 [1]. Alzheimer’s disease (AD) is the most common cause of dementia. Understanding the extent to which AD disease severity and progression vary with the age of the patient is important. Elucidating age-related associations not only aids understanding of the disease, but also allows clinicians and patients to have more precise and accurate information regarding prognosis.
There is a suggestion that younger onset AD or all-cause dementia patients have a higher rate of disease progression measured using neuropsychological test changes over time [2–5]. However, severity at clinical assessment varies, with most studies showing no association with age and three reporting worse cognition in younger cases compared with older cases [6–8].
Different age variables (age at presentation, at diagnosis, at symptom onset, at cognitive decline) can be used in studies investigating associations between age and disease progression, presenting challenges both when designing studies and when performing statistical analysis. Age at presentation and/or age at diagnosis are usually accurately recorded in prospective studies, while ages at symptom onset (age at decline) is often based on patient or caregiver’s recall in discussion with a clinician. Clinical associations with each of these various ages can potentially be different, particularly if symptom length (which can be expressed as time from symptom onset to either age at presentation or age at diagnosis) is a strong predictor of disease progression. Additionally, interpretation of each of these age associations is changed if symptom length is used as a covariate in the analysis.
In the dataset used in this study, age at presentation and recalled age at onset (age at decline) were available. Symptom length was computed as the difference between these ages. Our primary aim was to investigate the associations between these variables (age of onset, presentation, and symptom length) and disease progression (change in cognitive status scores) over time. Our secondary aim was to understand whether similar associations were found with disease severity (cognitive status scores) at presentation. We hypothesized that younger age of presentation or onset would be associated with greater decline in cognitive status scores.
MATERIALS AND METHODS
Subjects
We used data from AD patients collected by the National Alzheimer’s Coordinating Center (NACC, n = 7154). NACC developed and maintains a database of standardized clinical research data from individuals with normal cognition, mild cognitive impairment, and degenerative diseases collected from 34 past and present NIA-funded ADCs from across the USA. The study was approved by an institutional review board at each institution and is in line with the Helsinki Declaration of 1975. NACC recruitment and data collection has been described previously [9]. Data included patients seen at ADCs from the beginning of data collection in 2005 and June 2012. Subjects included in our study had to have dementia and a diagnosis of probable or possible AD according to standard diagnostic criteria [10] at first NACC visit. We only included subjects who had a recorded age of onset, Mini-Mental State Examination (MMSE) at baseline, and educational attainment. Notably, only a subset of subjects had follow-up visits (approximately half) and so progression of disease was only measurable in these subjects.
Variables
We used the following variables in our analyses: age at first NACC clinic presentation, age of onset (age of decline) defined as a clinician’s estimate of the age at which cognitive decline began (prior to NACC presentation), length of symptoms (calculated as age of first NACC clinic presentation minus age of onset), ADC, MMSE, Clinical Dementia Rating sum-of-boxes (CDR-SOB), gender, years of education, first predominant cognitive symptom, and apolipoprotein E (APOE) ɛ4 genotype.
The timing of collection of variables was as follows: age at presentation was the age of the patient at first NACC visit; NACC visits can sometimes follow an initial clinical assessment visit either at an ADC or another center dependent on each center’s recruitment practice. Age of onset and first predominant cognitive symptom was recorded at first visit by the clinician. First predominant cognitive symptom was based on the clinician’s opinion following discussion with the patient and caregiver and review of the cognitive profile. Testing for cross-sectional MMSE and CDR-SOB scores occurred at the first NACC visit. The longitudinal annualized differences in MMSE and CDR-SOB scores were calculated from the difference between scores recorded at first and second visits for those subjects with follow up.
MMSE and CDR-SOB at first NACC visit were used as measures of cognitive status. ADC was included as a covariate in all analyses to attempt to allow for the fact that there may be variation in the recording of age of onset across centers [11] or scheduling of patients for first NACC visit. Gender and years of education were used in analyses of cognitive status variables to allow for differences in scores attributable to these potential confounders. We excluded subjects from the longitudinal analyses who had an interval of <180 days between their first two visits in order to minimize practice effects. Notably, some subjects who had a repeat CDR-SOB did not have a repeat MMSE and therefore numbers of subjects included varied between these analyses. Since change in cognitive status scores over time might be related to baseline score, we included baseline score as a covariate in these longitudinal analyses.
Statistical analysis
In order to examine whether the age of onset or that at presentation, or the difference between the two (symptom length), was most important we first separately assessed these before then fitting a model with both age of presentation and symptom length as predictors (age at onset then being omitted as it can be derived from the other two). To investigate potential non-linear associations between the variables investigated, we used generalized additive models using the gam function in the mgcv package in R. These permit flexible estimation and testing of non-linear associations [12].
For longitudinal analyses separate generalized additive regression models relating annualized change in MMSE score to each of 1) age at presentation, 2) age of onset, and 3) symptom length were fitted. The associations of these ages and symptom length variables with change in MMSE were modelled non-linearly using default thin plate regression splines, with the smoothing parameter estimated using generalized cross-validation. Models including both age at presentation and symptom length as covariates were also fitted. Gender and years of education were included as linear covariates, and MMSE score at the first NACC visit was included non-linearly using a thin plate spline. Random ADC effects were included for all models. Analogous models for the annualized CDR-SOB change, with gender, years of education, and the CDR-SOB score at the first NACC visit as covariates were also fitted. To aid interpretation of differences between younger and older onset cases, similar analyses using a binary <65 years versus ≥65 years age at presentation cut-off were also fitted. Further models with change in MMSE as the outcome variable were fitted in subjects who performed above floor (0) at first and second NACC visit, and again re-fitted in subjects who had a first NACC visit score of >9, to assess whether results were influenced by those who fall to floor or who were severe at baseline. Similarly, we fitted further CDR change models excluding those who were at floor (18) at either first NACC visit and second NACC visit and then again excluding those with a first NACC visit score >14. These cut-off scores for MMSE and CDR-SOB are arbitrary but should reduce the chances of results being materially influenced by those whose score reductions are less than they would be were there no floor effects.
Similarly, for cross-sectional analyses separate generalized additive regression models relating each of first visit MMSE score and first visit CDR-SOB to each of 1) age at presentation, 2) age of onset, and 3) symptom length were fitted. Models including both age at presentation and symptom length as predictors were also fitted. Gender and years of education (linearly) were included in all these models. Again, additional models were also fitted with age at presentation, dichotomized at 65 years, to assess differences between older and younger presenting cases.
To assess whether our results were affected by disease presentation, as this has been shown to be associated with age of presentation [13], we refitted all models adjusting additionally for first cognitive symptom where this was known (categories: memory; judgment and problem solving; language; visuospatial function; attention/concentration; “other”; fluctuating cognition; no symptom). Similarly we refitted all models adjusting for APOE ɛ4 status in the subset of patients in which this was tested.
For the results of all analyses, plots showing predicted values of each dependent variable against either age at presentation or symptom length are shown. Predictions are for individuals with values of other covariates that are typical of those in the dataset, and with the ADC (mean zero) random effect set to zero. The plots include 95% pointwise confidence intervals and p-values testing the null hypothesis that age at presentation or symptom length has no independent association with the dependent variable are provided. We note that as described by Wood [12], both the confidence intervals and p-values are approximate, since their derivations ignore uncertainty induced through selection of the smoothing parameter.
RESULTS
∧data available in 3,816; #data available in 7,134 for cross-sectional analysis and 3,955 for longitudinal; ¥data available in 4,885 for cross-sectional analysis and 3,052 for longitudinal; N/A, not applicable.
Figures 1A-C illustrate the estimated relationships between rates of change in MMSE between NACC visits 1 and 2 and ages of presentation and onset and symptom length. The predictions and confidence intervals shown relate specifically to a female with 14 years of education, an MMSE at presentation of 20, from an ADC with random effect equal to zero; altering one or more of these choices will change all of the predictions by a constant amount but leave the form of the relationship unchanged. There was strong evidence (p < 0.001) that the rate of change (adjusted for sex, years of education and baseline MMSE) depends on age at presentation with the greatest rates of decline seen at younger ages. The rates of decline decrease with increasing age up to around age 80, then appear to plateau. There was no evidence that symptom length was related to the rate of change in MMSE when considered alone (p = 0.11) or after adjustment for age at presentation (p = 0.29, Fig. 1E). As a consequence of this, the association with age of onset was similar to that with age of presentation (p < 0.001) and adjustment for symptom length had little impact on the association with age at presentation (Fig. 1D). Coefficients of gender and (linear) education are shown in Supplementary Table 1 for these models assessing ages and symptom length as continuous variables. From the model where age at presentation was dichotomized it was estimated that after adjustment for symptom length, gender, education, baseline MMSE and ADC, those presenting below the age of 65 years declined by 0.69 (95% CI 0.37 to 1.02, p < 0.001) points per year more than those presenting at age 65 or above.
Plots of predicted change in MMSE (points per year) with 95% pointwise confidence intervals with predictors being: A) age of presentation, B) age of onset, C) symptom length, D) age of presentation adjusted for symptom length, and E) symptom length adjusted for age of presentation. Predictions are for a female subject, with 14 years of education, and a MMSE at presentation of 20. In plot D, the prediction is for a patient with symptom length 5 years. In plot E, the prediction is for a patient with age of presentation 75 years. Plots of the predicted change in CDR-SOB (points per year) with 95% pointwise confidence intervals with predictors being: A) age of presentation, B) age of onset, C) symptom length, D) age of presentation adjusted for symptom length, and E) symptom length adjusted for age of presentation. Predictions are for a female subject, with 14 years of education, and a CDR-SOB at presentation of 7. In plot D, the prediction is for a patient with symptom length 5 years. In plot E, the prediction is for a patient with age of presentation 75 years.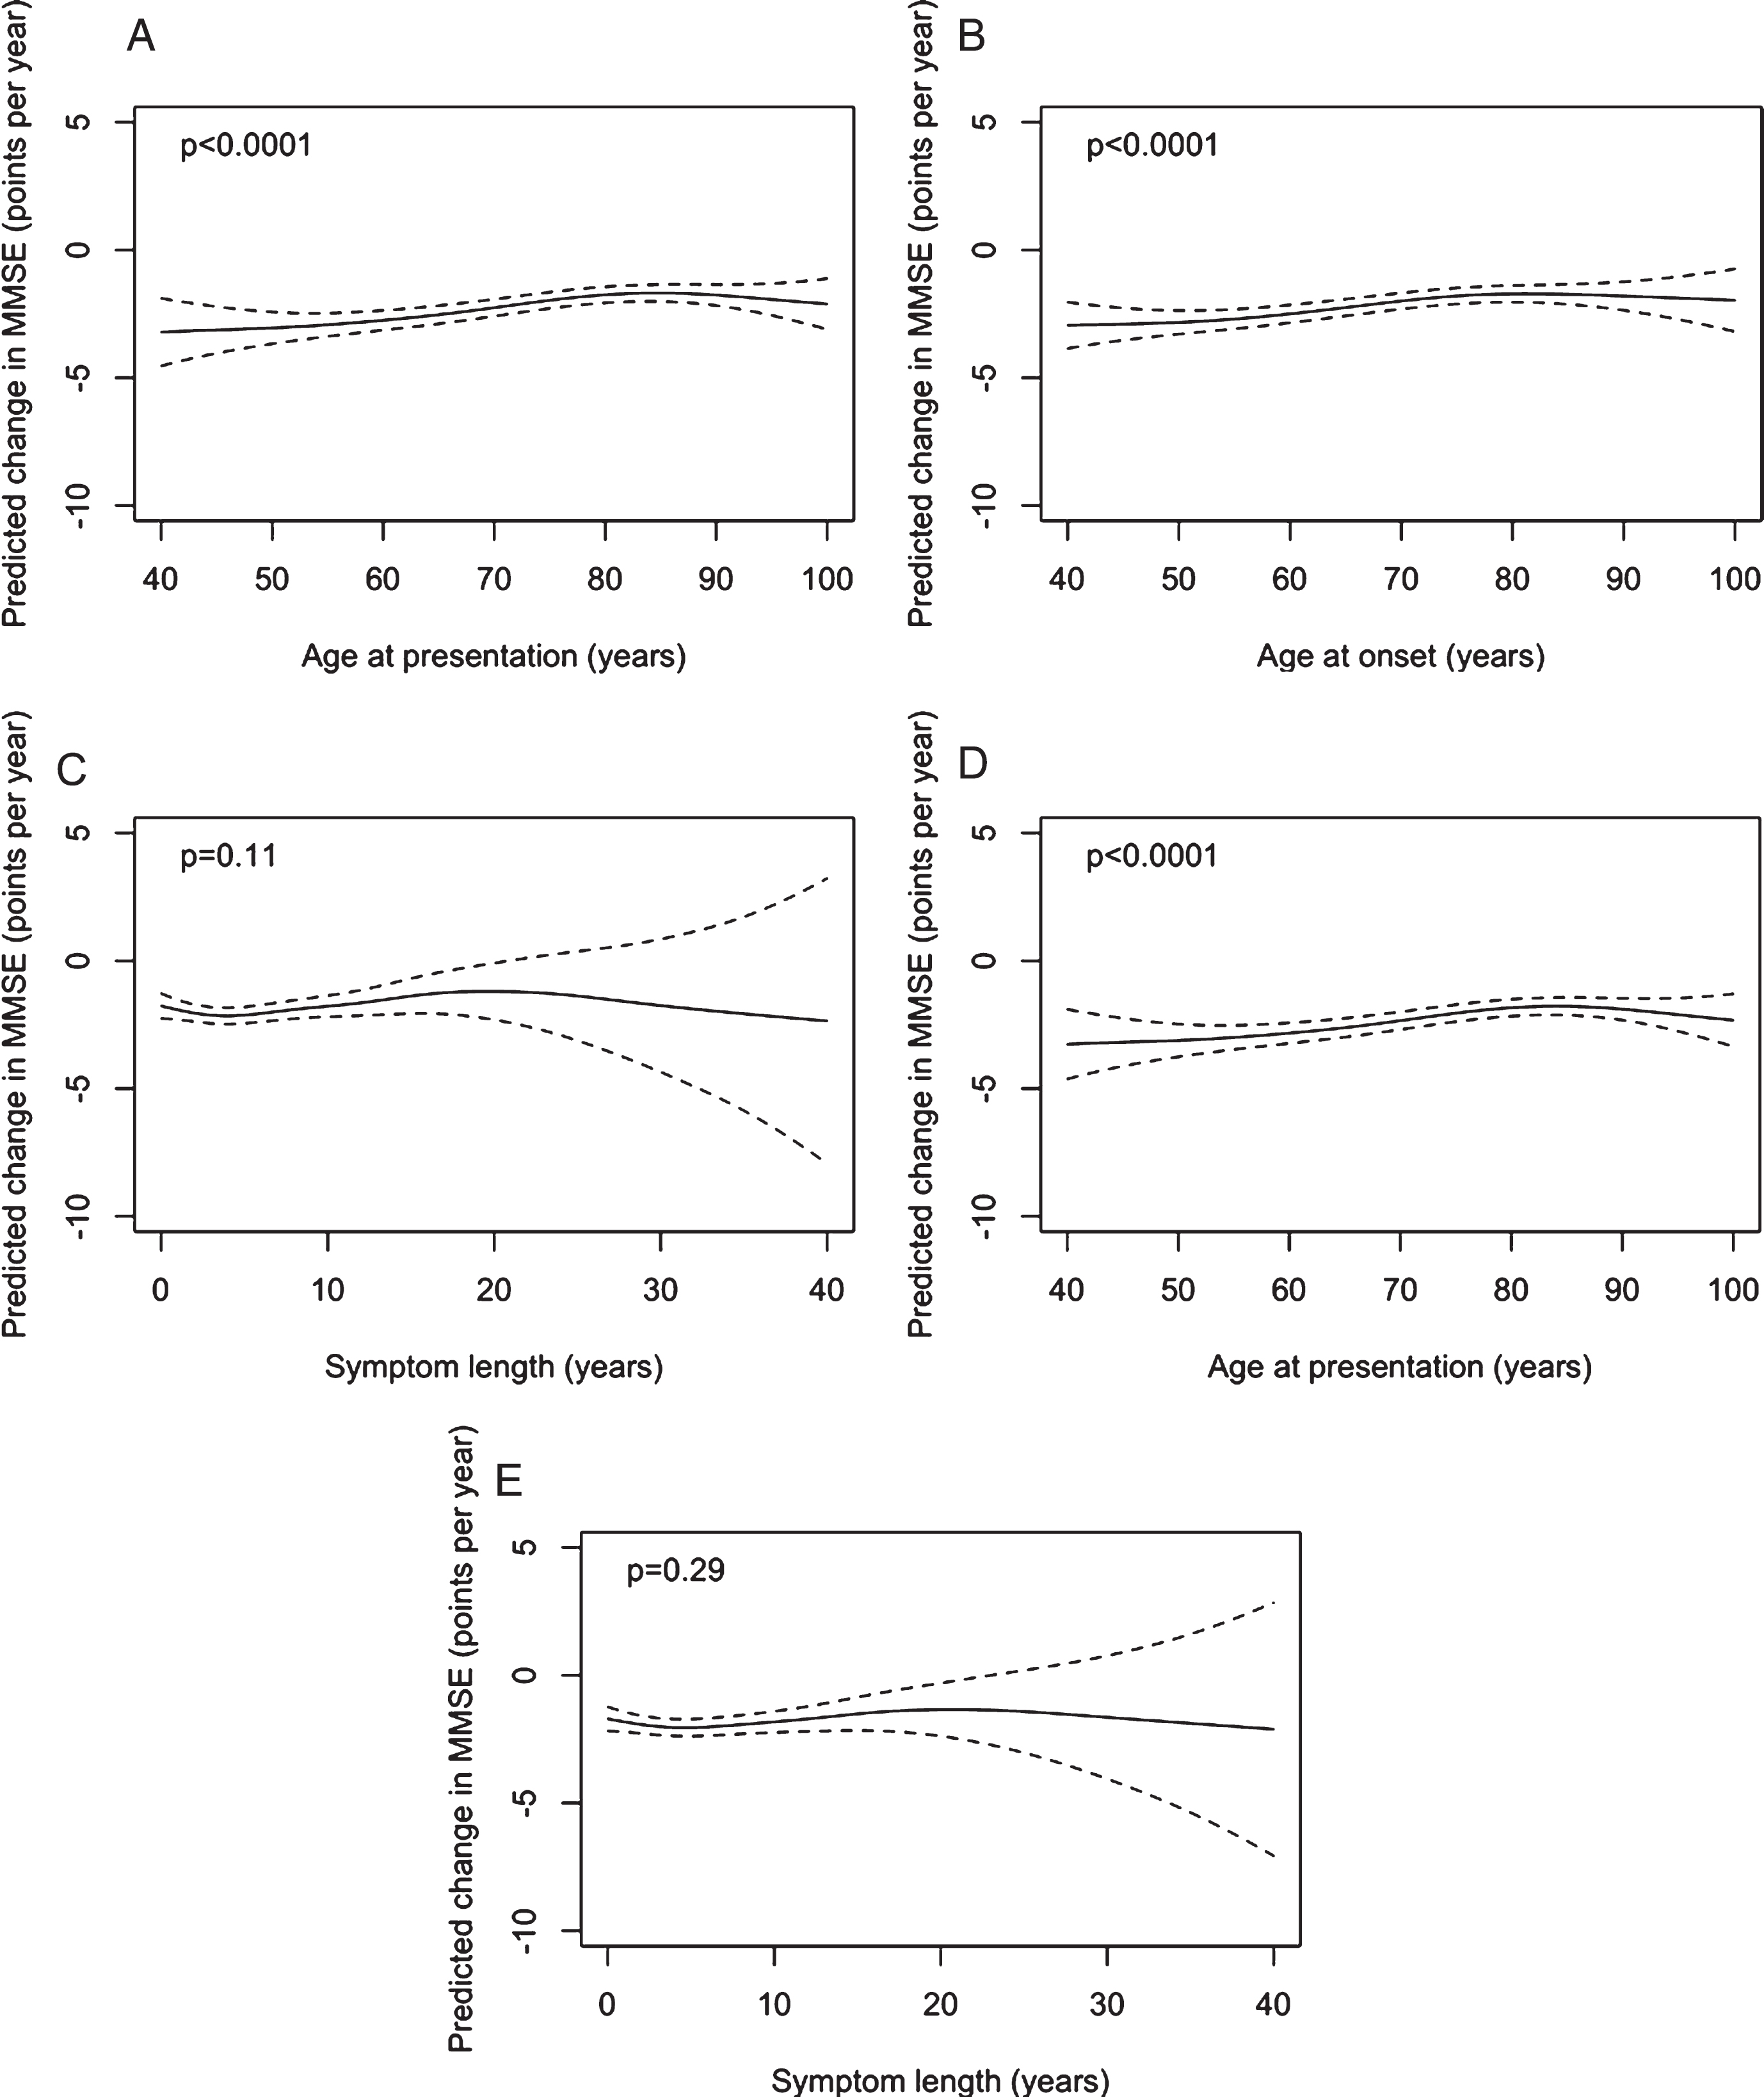
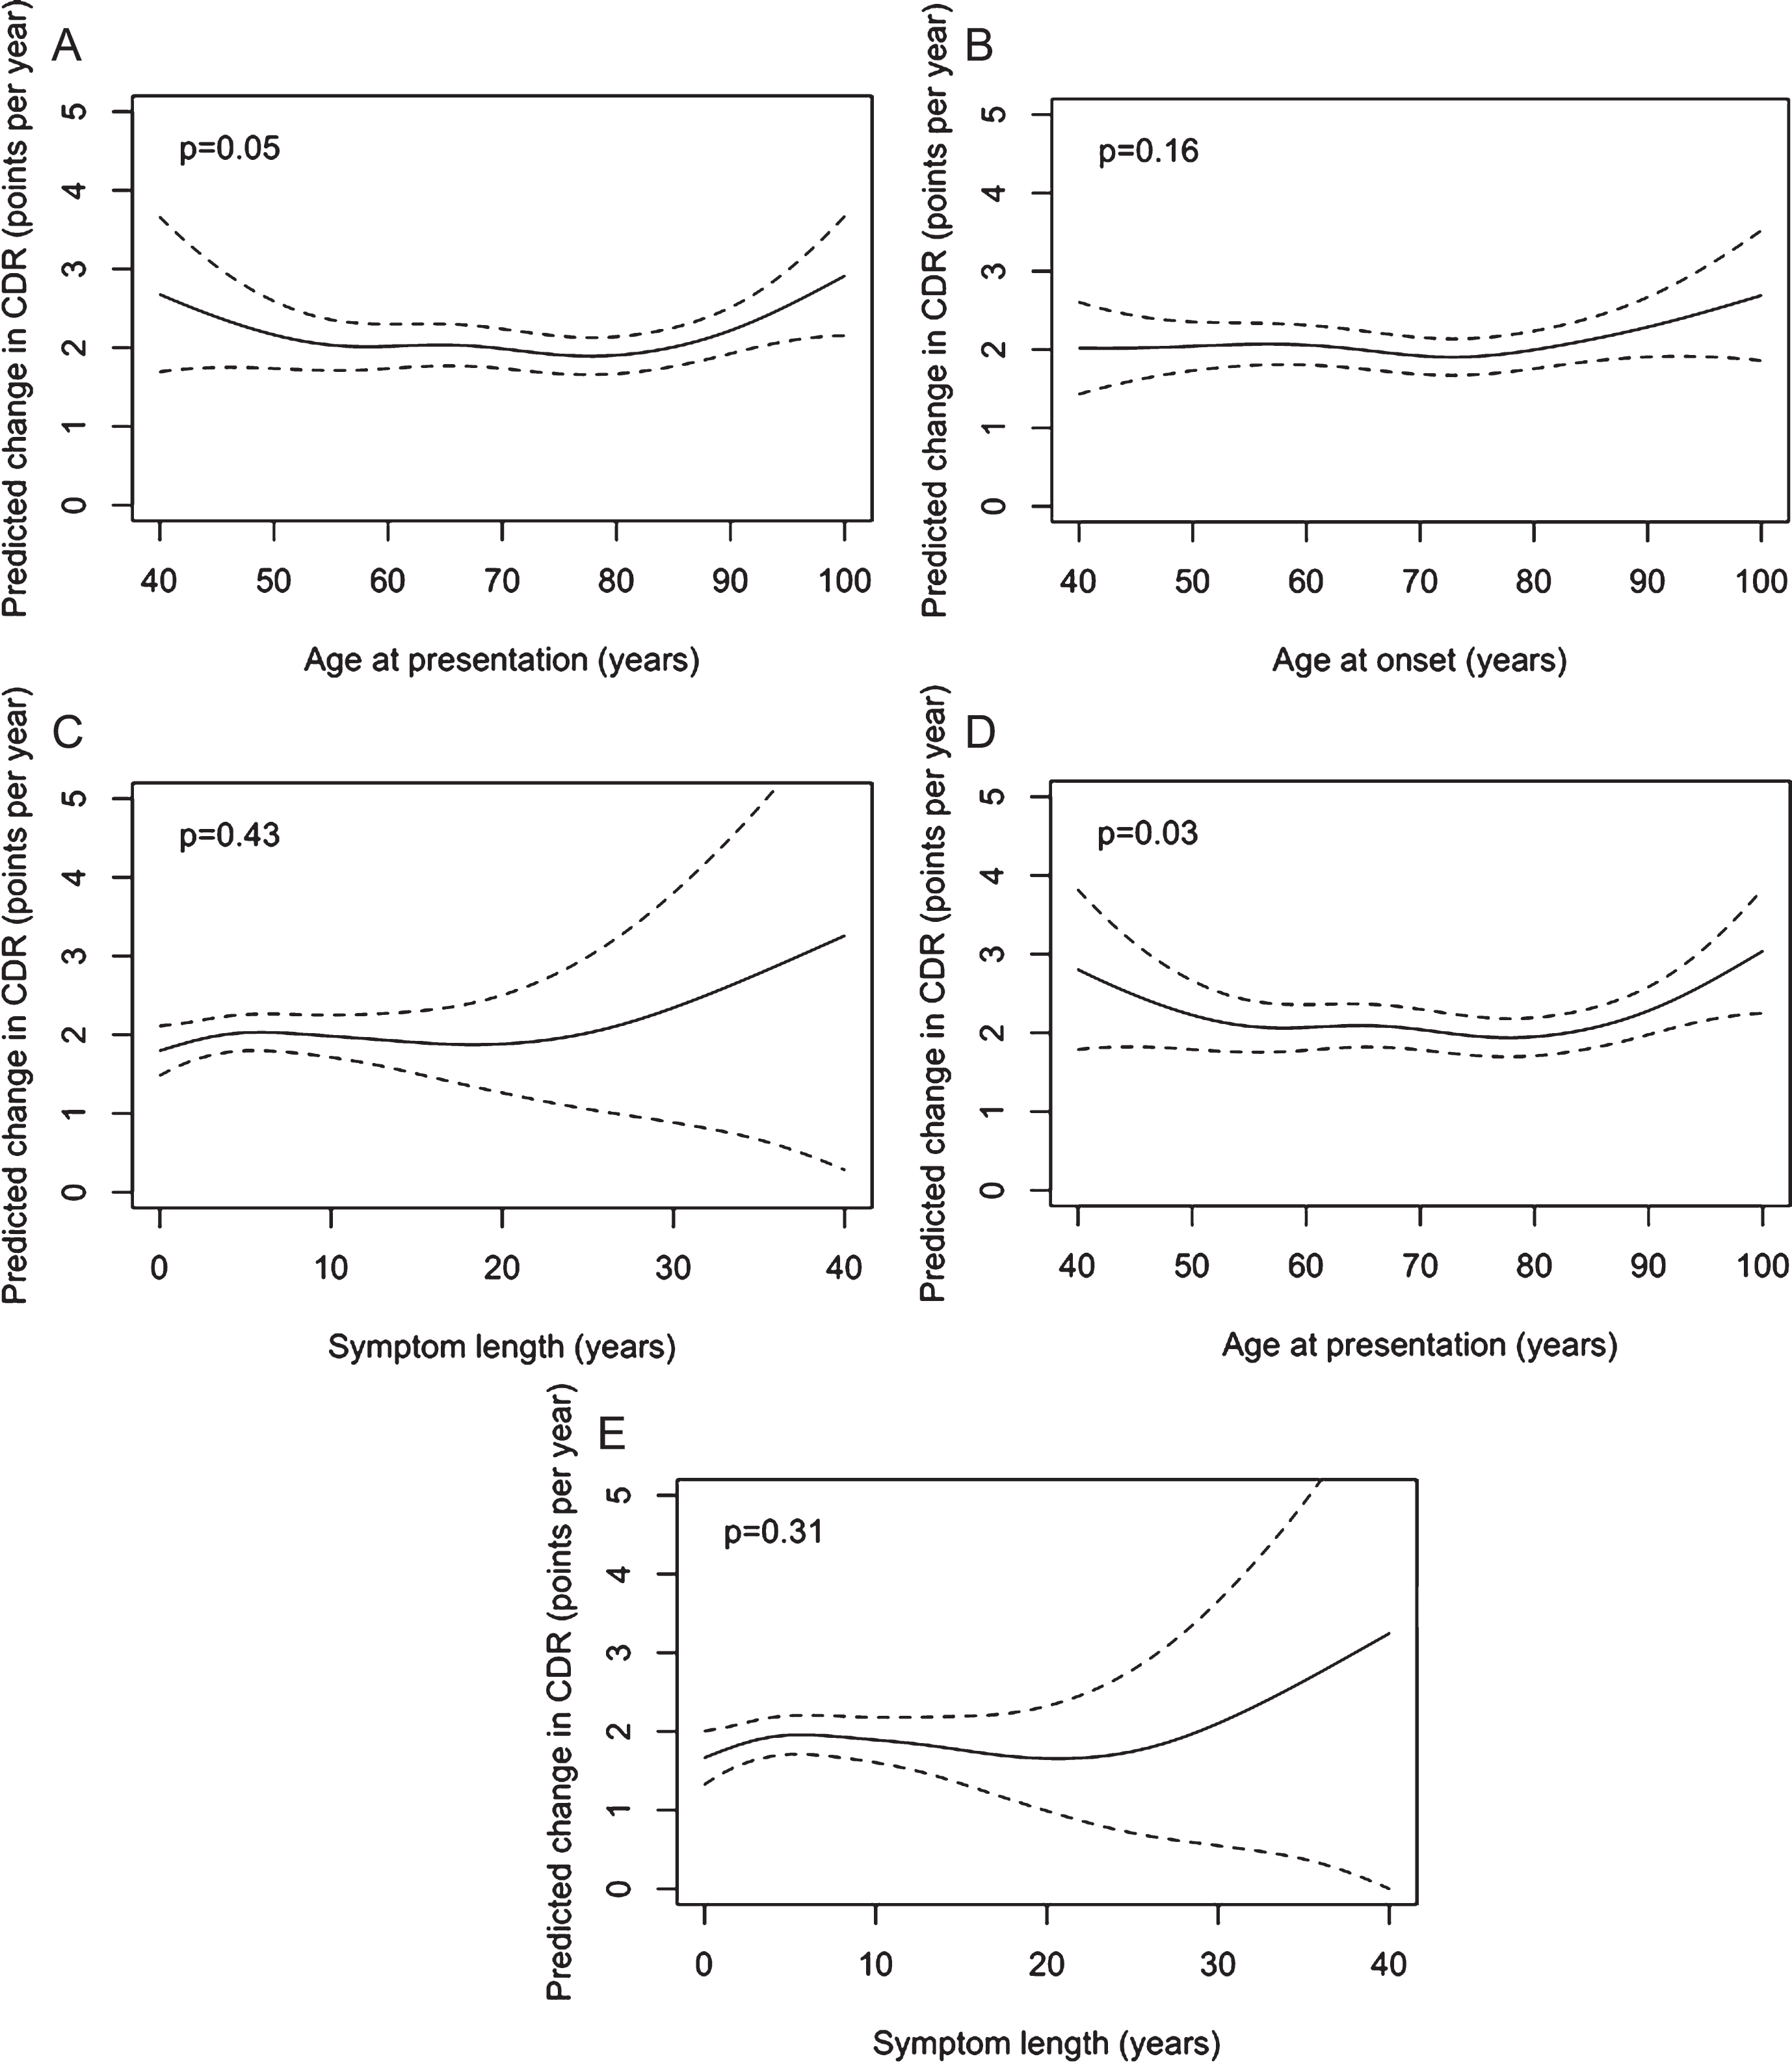
From analogous models for rates of change in CDR-SOB (see Figure 2) there was borderline statistically significant evidence of an association (adjusted for sex, years of education, and baseline CDR-SOB) between age at presentation and rate of change in CDR-SOB (p = 0.05, and p = 0.03 with additional adjustment for symptom length). The observed relationship was approximately “u”-shaped in form with the youngest and oldest presenting cases having the largest rates of change. There was no evidence of an association between CDR-SOB change and age at onset (p = 0.16) or symptom length (p = 0.43). From the dichotomized model, after adjustment for symptom length, gender, education, baseline CDR-SOB and ADC, there was no evidence (p = 0.92) that change in CDR-SOB differed between those presenting below the age of 65 and those presenting at age 65 or above.
Figures 3A-C show the relationships between MMSE at first visit and age of presentation, onset and symptom length. The predictions and confidence intervals shown relate specifically to a female with 14 years of education and ADC random effect equal to zero; as above, altering one or both of these choices will change all of the predictions by a constant amount but leave the form of the relationship unchanged. Figures 3D and 3E show the mutually adjusted associations with age at presentation and symptom length. There was evidence of an association between age at presentation and MMSE when analyzed in the separate model with the relationship a shallow inverted “u” (Fig. 3A, p < 0.001). There was a positive relationship between age of onset and MMSE (Fig. 3B, p < 0.001). The relationship between symptom length and MMSE was “u” shaped, although the predictions of MMSE for large symptom lengths were imprecise due to the limited number of patients with such long symptom lengths (Fig. 3C, p < 0.001). The co-adjusted relationships between age of presentation and symptom length with MMSE at baseline remained significant and similar in form (Fig. 3D, E, both p < 0.001). Coefficients for the effects of gender and education for these models where ages and symptom length are analyzed as continuous variables are shown in Supplementary Table 1. From the model where age at presentation was dichotomized it was estimated that after adjustment for symptom length, gender, education and ADC, those with an age at presentation of 65 years or above had a mean MMSE at first visit 1.37 (95% CI 0.95 to 1.78, p < 0.001) points higher than those presenting below 65 years.
Plots of predicted MMSE at first visit with 95% pointwise confidence intervals with predictors being: A) age of presentation, B) age of onset, C) symptom length, D) age of presentation adjusted for symptom length, and E) symptom length adjusted for age of presentation. Predictions are for a female subject with 14 years of education. In plot d) the prediction is for a patient with symptom length 5 years. In plot E, the prediction is for a patient with age of presentation 75 years.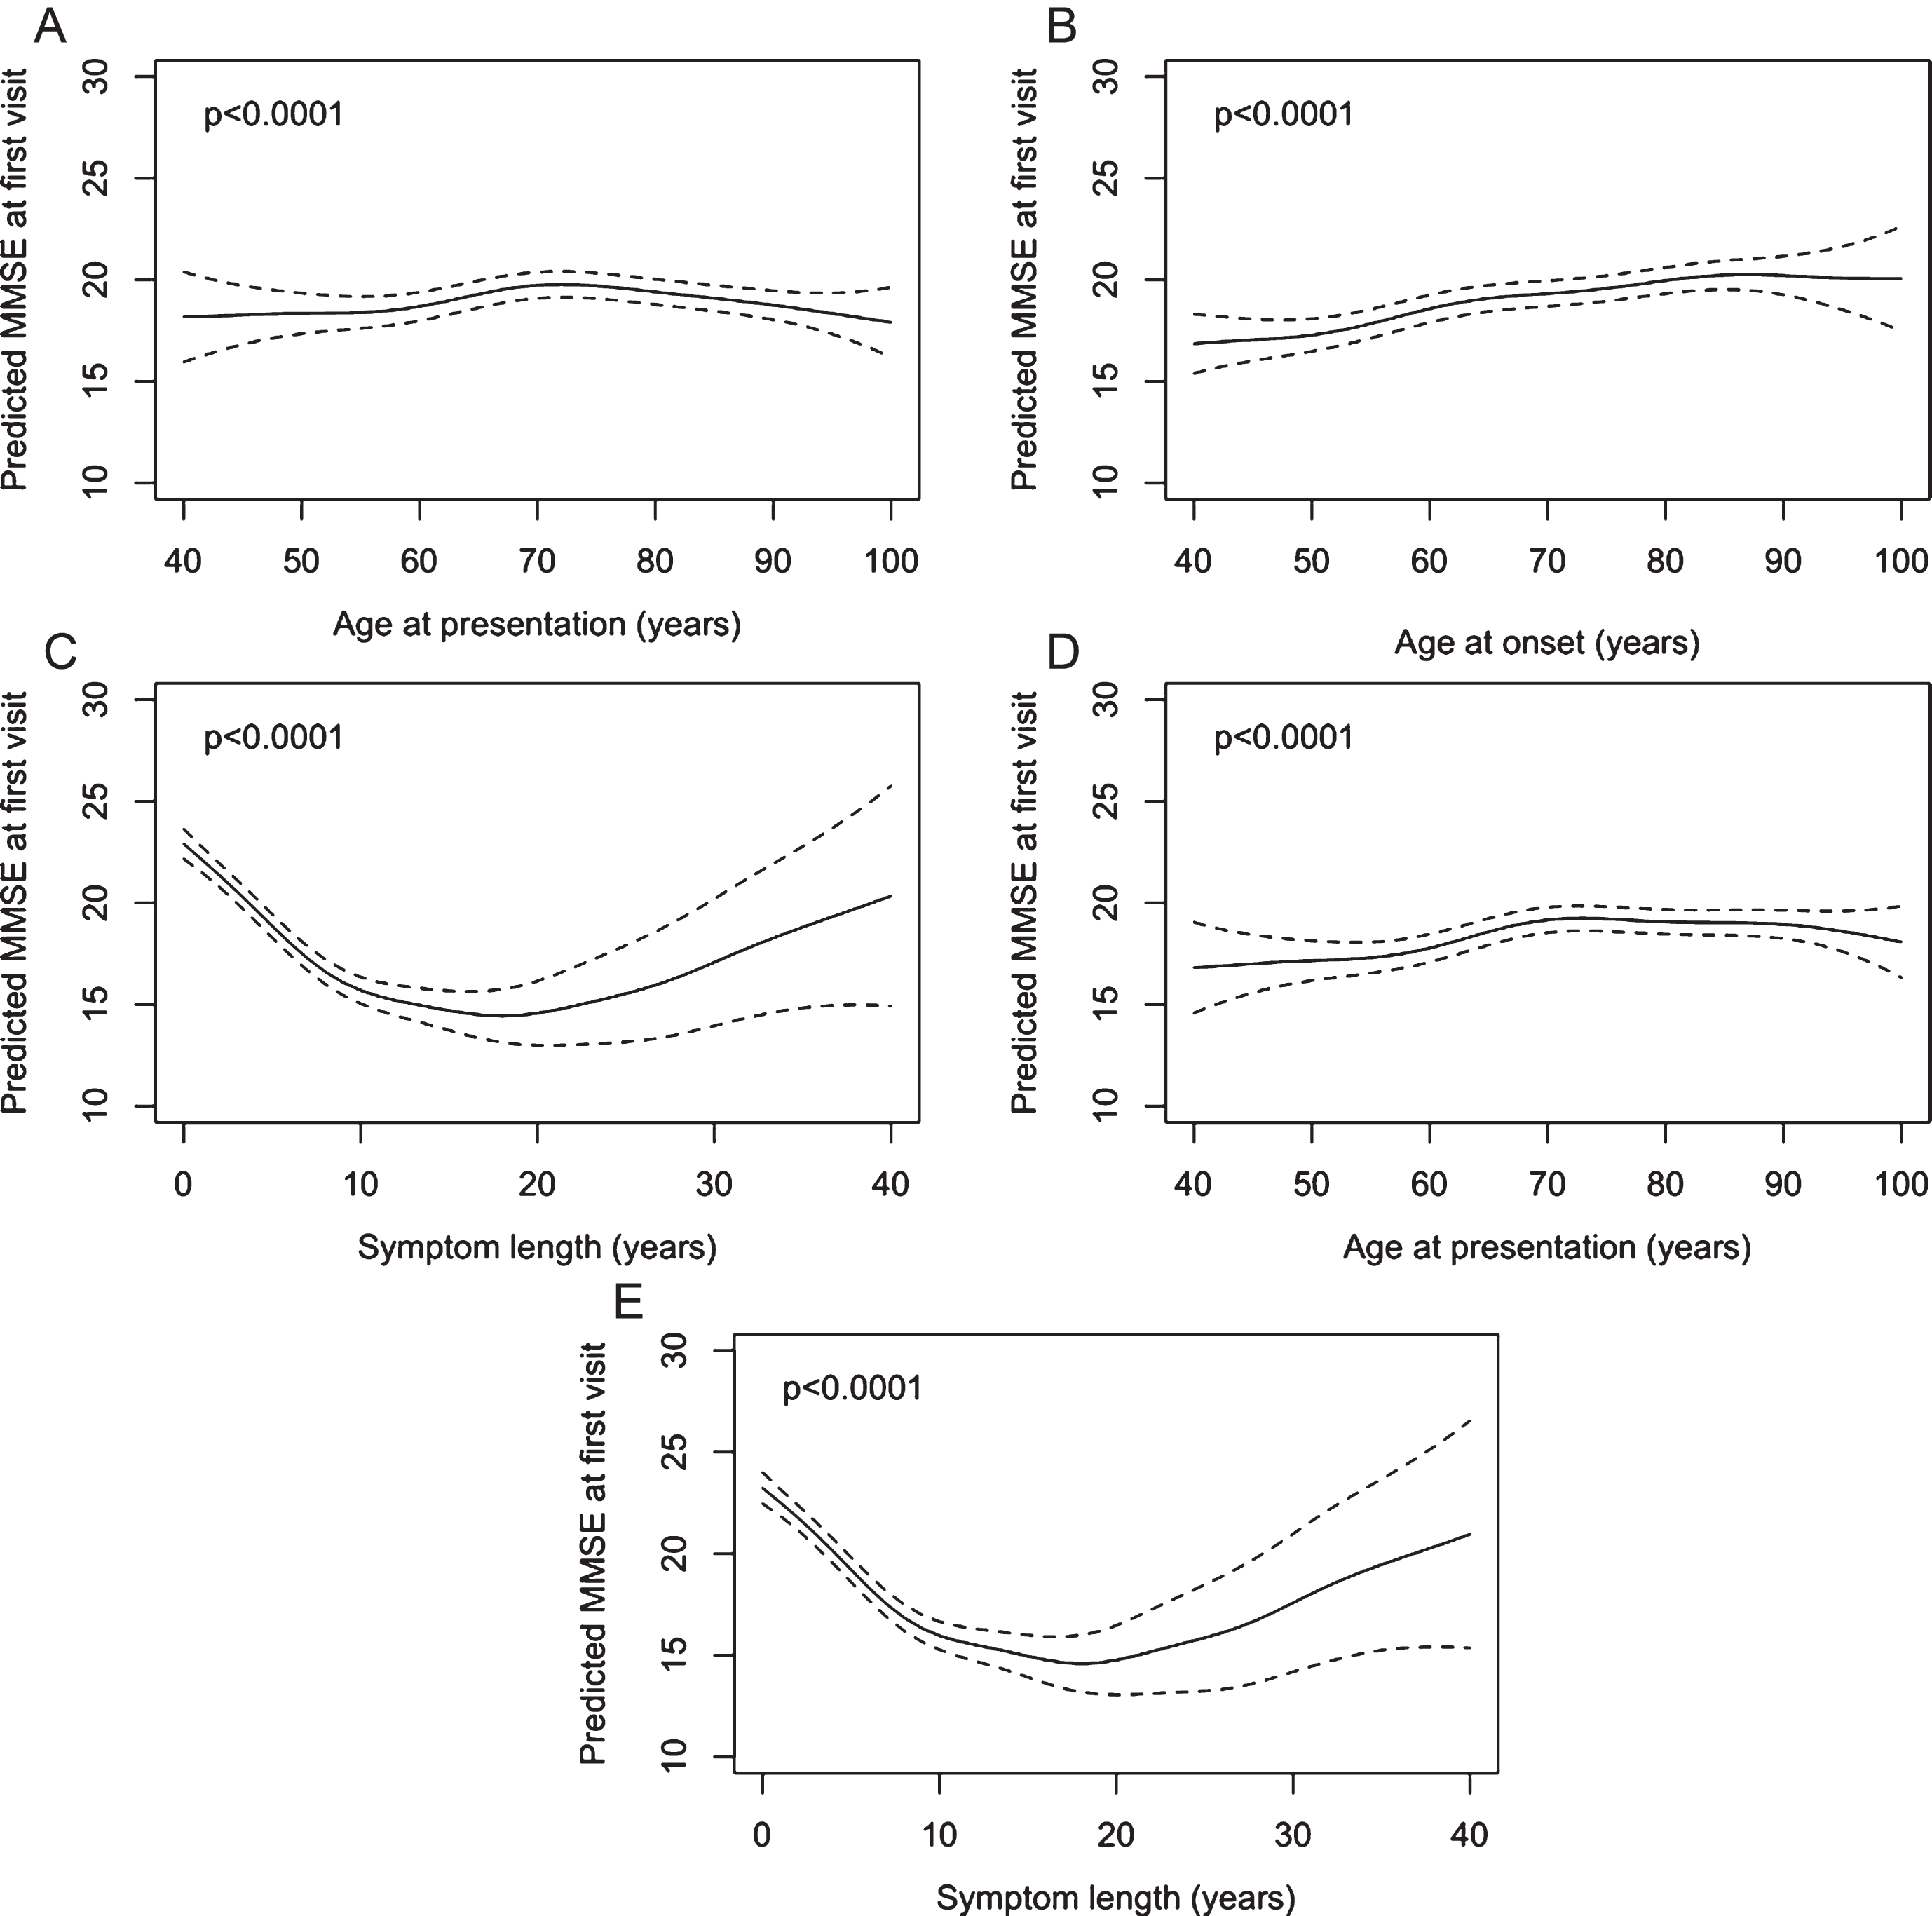
There was evidence of an association between age at presentation and CDR-SOB (see Fig. 4A, p < 0.001); little relationship was discernable until 70 years from which point an older age of presentation was associated with poorer scores. There was a small association of age of onset with CDR-SOB, with older ages associated with better scores (see Fig. 4B, p = 0.02). Symptom length showed an inverted “u” shaped relationship with CDR-SOB (see Fig. 4C, p < 0.001). The associations between CDR-SOB with age at presentation and symptom length in the co-adjusted model remained significant (Fig. 4D, E, p < 0.001 both tests), with their independent associations remaining largely unchanged. From the dichotomized model, after adjustment for symptom length, gender, education and ADC, those presenting at 65 years and above had CDR-SOB at first visit 0.11 lower (95% CI – 0.14 to 0.35, p = 0.40).
Plots of predicted CDR-SOB at first visit with 95% pointwise confidence intervals with predictors being: A) age of presentation, B) age of onset, C) symptom length, D) age of presentation adjusted for symptom length, and E) symptom length adjusted for age of presentation. Predictions are for a female subject with 14 years of education. In plot d) the prediction is for a patient with symptom length 5 years. In plot E, the prediction is for a patient with age of presentation 75 years.
Adjusting for APOE ɛ4 meant that the relationship between symptom length and MMSE change became borderline significant in the separate model (p = 0.03, see Supplementary Figure 1); this relationship was not significant when additionally adjusting for age of presentation (p = 0.09). For CDR-SOB change, excluding those who scored at floor at either timepoint or those who scored >14 at baseline or adjusting for APOE ɛ4 meant the borderline significant result between age of presentation and score change became non statistically significant in individual models (p > 0.05, all tests) as well as the model for APOE ɛ4 additionally adjusted for symptom length (p = 0.3). In all other analyses where poor performers were excluded or models were adjusted for APOE ɛ4 or first predominant cognitive symptom, results did not materially change.
DISCUSSION
We found strong evidence that the AD subjects who presented at younger ages subsequently progressed faster with respect to MMSE. For CDR-SOB, those who presented at younger ages progressed more quickly, as did those at the oldest ages; across the middle of the age range the relationship appeared quite flat. There was no evidence that symptom length was associated with MMSE or CDR-SOB progression with or without adjustment for age at presentation. Little influence of gender was seen in these longitudinal analyses; higher educational attainment was associated with greater cognitive decline (Supplementary Table 1).
Analysis of first visit results revealed that increased age at presentation was associated with better MMSE scores up to about 70 years. From 70 years an increase in age was associated with both poorer MMSE and CDR scores. Symptom length had a strong relationship with both MMSE and CDR-SOB with a longer symptom length (up to 20 years) associated with poorer scores. In the co-adjusted models, a higher age of presentation was associated with better scores on both tests until 70 years. From that point an increase in age was associated with poorer scores. A higher age of onset was associated with better MMSE and CDR scores. The differing forms of the relationships with age at presentation and age at onset are linked to the effect of symptom length. The down turn in the association with age at presentation at older ages being a reflection of the fact that those with the oldest presentations are likely to have long symptom lengths (associated with worse outcomes) despite their likely late age at onset (associated more weakly with better outcomes). Women tended to perform more poorly than men on MMSE and CDR-SOB allowing for educational attainment; greater education was associated with better baseline cognitive performance (Supplementary Table 1).
Longitudinal results show earlier-presenting AD cases are associated with more aggressive disease progression. Longitudinal CDR-SOB results also suggest that later presenting cases from the 10th decade onwards may experience more aggressive disease progression. This latter association may be due to fact that older patients are more likely to be frail and have comorbid conditions which are associated with more rapid decline. Cross-sectional results are more complicated with increased symptom length (up to around 15 years) being a predictor of poorer cognitive status at baseline. Earlier age of presentation before 70 years and later age after 70 years was associated with more severe disease at baseline. The effect prior to 70 may again be explained by a more aggressive disease at earlier ages. The effect after 70 years may be in part due to bias: older patients are more likely to have memory deficits (at least at first) and older patients may expect memory to decline with age and therefore it may take them longer to seek help and obtain an appointment. The fact that higher educational attainment was associated with greater decline (see Supplementary Table 1), but better cognitive status at baseline, may be related to increased cognitive reserve in those with more education [14].
Other biases are important to consider when interpreting these results, in particular inaccuracies in recording of ages at presentation and symptom length. There will be inaccuracy in symptom length due to inaccurate recall of age of onset [11]. Additionally, if some patients have appointments postponed and others do not, or if some patients have easier access to medical care whilst others do not, then this will impact on with age at presentation. It is plausible that at least some of the between-subject variability in ages at presentation and symptom lengths will be due to factors unrelated to the disease and so these effects will be akin to those induced by random measurement error in predictor variables in regression models. It is known that such measurement error induces bias [15]: in simple linear regression models the true effect is always attenuated (hence the bias is sometimes termed regression dilution bias [16]), but in multiple regression models this need not be the case. Here, where errors due to presentation variability and inaccurate recall variability are likely to have different magnitudes it is difficult to anticipate the impact. This means that associations of small magnitude in particular need to be interpreted cautiously.
Previously only relatively small and often single-site studies have investigated relationships between age and features of AD such as progression and cognitive status. Different definitions of symptom length, age of onset and age of presentation have been used across studies and the age variable used in analyses to dichotomize subjects or used as a continuous predictor varies also. The type and structure of healthcare systems from which patient data are derived may also influence results. Our results presented here may indicate that studies assessing change in cognitive status score are more robust to the choice of age variable used as a predictor compared with those assessing relationships between baseline cognitive status and age. We also found that associations of scores with age and symptom length are largely non-linear. This means that the range of ages included in studies as well as the distribution of ages will affect associations seen.
A number of studies have found evidence using serial neuropsychology that the rate of progression decreased with increased age of symptom onset or age at assessment [2–4, 17–22]. One study reported older age to be associated with greater decline [23]. One early study showed rate of progression in a dementia ratings scale to be higher in older onset cases [24].
Two studies have found that longer symptom lengths are associated with poorer cognitive function at assessment [18, 22]. A number of studies have found no evidence of a relationship between MMSE (including modified versions) and age of symptom onset, disease onset, caregiver-noted substantive change, or diagnosis [3, 25–31]; whereas others found lower MMSE at first time-point in younger diagnosed, assessed or symptom onset cases [6–8], in keeping with our own findings. Two studies of the same patients reported CDR-SOB and found no evidence of a difference according to age of symptom onset [19, 28]. All of these studies either dichotomized subjects, placed them into tertiles or performed linear analyses. The nature of the relationships we found between presentation age and cognitive scores may partly explain the apparent discrepancies amongst the literature, particularly if different ranges and distributions of ages are included.
Imaging studies have demonstrated that AD or mild cognitive impairment patients who progress to AD have lower rates of tissue loss at older ages [32, 33]. Further, another study has revealed younger cases having greater progressive cortical thinning in association cortices, whereas only a small area of the medial temporal lobe was thinning more quickly in older cases [19]. In addition, increased subcortical structural decline has been demonstrated in younger as opposed to older cases [28]. EEG analysis has demonstrated that younger cases have more severe slowing of spontaneous oscillatory activity than older cases [31] as well as more common focal and diffuse EEG abnormalities [7]. Cerebrospinal fluid analysis has also demonstrated younger cases having more amyloid pathology (as well as being more severe according to MMSE) [6]. These findings together with our own provide multiple lines of evidence of a differing and more aggressive course in younger onset patients. Interestingly, results did not greatly change when adjusting for APOE ɛ4. Since APOE ɛ4 is not only associated with greater risk of AD but also with earlier age of onset, this means there are likely other genes or variables which are associated with earlier age of onset and increased rate of decline. These other variables might be co-morbidities [34] and/or identified risk factors such as low education in early life, hypertension and obesity in midlife or smoking, depression or social isolation in late life [35]. Other predictors, such as subtle atrophy patterns in the posterior of the brain, may also indicate faster decline [36]. Clinically, this means that younger onset patients would benefit from early diagnosis, in order that they gain key prognostic information and can make appropriate plans, before they become severely affected.
The major strengths of this study are the multi-site and systematic nature of data collection, combined with the assessment of two commonly used methods to assess cognitive status (CDR and MMSE). One limitation with this study is that we only had evidence for change in cognitive status measures in a subset of the subjects owing to the nature of the clinical data collection. It may be that those subjects with second NACC visit neuropsychology are different to those who are not followed, which may bias results if the probability of having a second visit is related to change in cognitive status score. Other work using linear regression models has shown that changes in scores such as MMSE are variable amongst AD patients; 95% of patients have changes between – 7.15 and +0.33 points per year and with test-retest differences over a 1 month interval ranging from +7 points to – 8 points. This means that on an individual level, MMSE may not be appropriate to track changes in cognition, particularly over short intervals [23]. Other cognitive tests are available from NACC [9]. We did not investigate the effects of both age variables and symptom length on all tests available although this may be an avenue of future research. Further we did not include neuropathological information in these subjects in order to be as inclusive as possible of the subjects seen at ADCs; it is possible that neuropathological data are biased towards more atypical cases of AD. In addition, many of these patients may have presented earlier to a specialist, but then were referred to an ADC due to interest in research. This procedure may differ across ADCs and be a source of noise in the dataset. However, we adjusted for ADC in our analyses and for symptom length, which should allow for some aspects of this confounding issue. This is also why we use the term “age at presentation” rather than “age at diagnosis”. NACC co-ordinates academic AD centers which may have more difficult and complex cases compared with community-based AD clinics, thus limiting generalizability of our findings to the wider AD population. Finally, using the analytical approach we chose, the derived confidence intervals understate uncertainty which may mean significance (p-values) is overstated.
In summary, our study demonstrates in a large AD cohort that differences exist in disease course according to age at presentation and onset. We found the strongest predictor of progression was age rather than symptom length (younger age associated with quicker progression and therefore implying more aggressive disease) and that the strongest predictor of disease severity at first visit was symptom length rather than age (longer symptom length up to two decades associated with greater severity). Understanding the course of AD and those variables that can influence this course is extremely important and may influence clinical services. The finding that younger AD patients have a more aggressive disease course implies that early diagnosis is essential.
Footnotes
ACKNOWLEDGMENTS
J. Barnes is funded by an Alzheimer’s Research UK Senior Fellowship. The Dementia Research Centre is supported by Alzheimer’s Research UK, Brain Research Trust, and The Wolfson Foundation. This work was supported by the NIHR Queen Square Dementia Biomedical Research Unit and the National Institute for Health Research Biomedical Research Centre (BRC). The NACC database is funded by NIA/NIH Grant U01 AG016976. NACC data are contributed by the NIA-funded ADCs: P30 AG019610 (PI Eric Reiman, MD), P30 AG013846 (PI Neil Kowall, MD), P50 AG008702 (PI Scott Small, MD), P50 AG025688 (PI Allan Levey, MD, PhD), P50 AG047266 (PI Todd Golde, MD, PhD), P30 AG010133 (PI Andrew Saykin, PsyD), P50 AG005146 (PI Marilyn Albert, PhD), P50 AG005134 (PI Bradley Hyman, MD, PhD), P50 AG016574 (PI Ronald Petersen, MD, PhD), P50 AG005138 (PI Mary Sano, PhD), P30 AG008051 (PI Thomas Wisniewski, MD), P30 AG013854 (PI M. Marsel Mesulam, MD), P30 AG008017 (PI Jeffrey Kaye, MD), P30 AG010161 (PI David Bennett, MD), P50 AG047366 (PI Victor Henderson, MD, MS), P30 AG010129 (PI Charles DeCarli, MD), P50 AG016573 (PI Frank LaFerla, PhD), P50 AG005131 (PI James Brewer, MD, PhD), P50 AG023501 (PI Bruce Miller, MD), P30 AG035982 (PI Russell Swerdlow, MD), P30 AG028383 (PI Linda Van Eldik, PhD), P30 AG053760 (PI Henry Paulson, MD, PhD), P30 AG010124 (PI John Trojanowski, MD, PhD), P50 AG005133 (PI Oscar Lopez, MD), P50 AG005142 (PI Helena Chui, MD), P30 AG012300 (PI Roger Rosenberg, MD), P30 AG049638 (PI Suzanne Craft, PhD), P50 AG005136 (PI Thomas Grabowski, MD), P50 AG033514 (PI Sanjay Asthana, MD, FRCP), P50 AG005681 (PI John Morris, MD), P50 AG047270 (PI Stephen Strittmatter, MD, PhD).