
Abstract
Background:
Current evidence suggests physical activity (PA) and sleep are important for cognitive health; however, few studies examining the role of PA and sleep for cognitive health have measured these behaviors objectively.
Objective:
We cross-sectionally examined whether 1) higher PA is associated with better cognitive performance independently of sleep quality; 2) higher sleep quality is associated with better cognitive performance independently of PA; and 3) whether higher PA is associated with better sleep quality.
Methods:
We measured PA, subjective sleep quality using the Pittsburgh Sleep Quality Index (PSQI), and objective sleep quality (i.e., fragmentation, efficiency, duration, and latency) using the MotionWatch8© in community-dwelling adults (N = 137; aged 55+). Cognitive function was indexed using the Alzheimer’s Disease Assessment Scale-Plus. Correlation analyses were performed to determine relationships between PA, sleep quality, and cognitive function. We then used latent variable modelling to examine the relationships of PA with cognitive function independently of sleep quality, sleep quality with cognitive function independently of PA, and PA with sleep quality.
Results:
We found greater PA was associated with better cognitive performance independently of 1) PSQI (β= –0.03; p < 0.01); 2) sleep fragmentation (β= –0.02; p < 0.01); 3) sleep duration (β= –0.02; p < 0.01); and 4) sleep latency (β= –0.02; p < 0.01). In addition, better sleep efficiency was associated with better cognitive performance independently of PA (β= –0.01; p = 0.04). We did not find any associations between PA and sleep quality.
Conclusions:
PA is associated with better cognitive performance independently of sleep quality, and sleep efficiency is associated with better cognitive performance independently of PA. However, PA is not associated with sleep quality and thus PA and sleep quality may be related to cognitive performance through independent mechanisms.
INTRODUCTION
Maintaining older adult cognitive health is a prominent public health challenge of the 21st century, as one new case of dementia is detected every 4 seconds [1]. Age is the number one risk factor for dementia [2], and as the aging population grows [3], so too will the number of dementia cases. While there is not yet a pharmaceutical cure for dementia, non-pharmaceutical approaches may help reduce dementia risk [4]. As such, lifestyle and behavioral strategies are an important line of scientific inquiry for maintaining older adult cognitive health [5].
One strategy is increasing older adult physical activity (PA), which has positive benefits on both physical and cognitive health [6]. Importantly, strong evidence suggests regular PA of ≥3.0 metabolic equivalents (METs) can reduce the risk of dementia by up to 28% [7]. While it is promising that meeting current PA guidelines of ≥150 minutes/week may help maintain cognitive health throughout life [8], most older adults fall short of these recommendations [9]. Thus, increasing older adult PA has become a growing public health priority since it could help prevent up to 18% of all Alzheimer’s disease (AD) cases [10].
Current evidence suggests PA can impact cognitive health through multiple mechanisms; however, strong empirical evidence suggests regular PA causes neurogenesis (i.e., the creation of new neurons) and cerebral angiogenesis (the creation of new blood vessels in the brain) [11]. The precise physiological mechanism by which PA improves cognitive health is still under investigation, but it is clear that PA increases cellular proliferation, dendritic complexity, and dendritic spine density in the dentate gyrus of the hippocampus [12–15]. These adaptations in cytoarchitecture also occur in older animals [16–19], suggesting the importance of PA for cognitive health throughout life. In addition to the benefits of PA for maintaining cognitive health, animal models have also experimentally shown that PA down-regulates inflammatory factors which are associated with the progression of AD [20, 21]. Specifically, transgenic mice given access to a running wheel have significantly reduced amyloid-β protein (Aβ) levels in their frontal cortex [20] and reduced pro-inflammatory markers IL-1β and TNF-α [21]. Both of these inflammatory markers are associated with increased Aβ load and have been linked to AD progression[22, 23].
Another promising strategy for cognitive health is improving older adult sleep quality. Sleep complaints are common among older adults, with more than half of adults over 65 years reporting at least one chronic sleep complaint—the most common being the inability to stay asleep at night [24]. Changes in sleep quality are a normal consequence of aging [25]; however, poor sleep is prevalent and predictive of cognitive decline in older adults [26]. Unfortunately, while effective cognitive-behavioral interventions are available for poor sleep [27, 28], few people utilize these treatments [29].
Strong evidence suggests poor sleep can have serious consequences on cognitive function [30]. The observed neurocognitive impairments which are a consequence of poor sleep are attributable to suboptimal prefrontal cortical functionality [31, 32]. Importantly, the prefrontal cortex is the principal cortical area involved with higher-order cognitive function [33–35]. Coupled with these data suggesting poor sleep can impair cognitive function is the growing body of evidence that poor sleep is not only more prominent among individuals with AD, but also increases the risk of developing AD [36]. Animal models have experimentally shown 1) increasing cortical Aβ, a key indicator of AD pathophysiology, increases sleep fragmentation [37]; 2) decreasing sleep quality and increasing wake-time escalates Aβ production and corresponding cortical deposition [38]; and 3) sleep promotes the clearance of extracellular Aβ which accumulates during wake-time [39]. Collectively, these results suggest sleep is a critical pathway through which the brain appears to maintain cognitive health. When this pathway is disrupted, a vicious cycle of accelerating AD progression may occur—wherein poor sleep quality causes an increase in AD progression, and vice-versa [40].
Importantly, PA has long been thought to help improve poor sleep [41]. Epidemiological studies have consistently found people believe PA improves their sleep, and people with greater PA report sleeping better compared to more sedentary individuals [42]. While the reasons for why PA and sleep are related are still unclear, current evidence suggests three possible explanations [42, 43]. One theory suggests that since negative affective states (i.e., depressive symptoms and anxiety) contribute to poor sleep [28], the antidepressant and anxiolytic effects of PA explain the relationship between sleep and PA [44, 45]. Another hypothesis suggests better weight regulation through increased PA may be associated with better sleep quality [46], since obesity is related to poorer sleep quality [47]. A third hypothesis suggests that since poor physical function is associated with poorer sleep quality in older adults [48], and PA is associated with improved physical function [49], PA may be related to better sleep quality through its effect on physical function.
While these preliminary hypotheses are interesting, the current evidence for a relationship between PA and sleep quality is largely based on self-reported PA and sleep quality [41, 42], which can yield vastly different measurements from objective reality [50, 51]. Since PA and sleep quality may be associated with each other and with cognition, investigating the relationships PA and sleep quality have with cognitive function should not be performed in isolation. For example, it is plausible that PA does not independently predict cognitive function but influences cognition through sleep (or vice-versa). In order to address these questions regarding the independent associations of PA and sleep quality with older adult cognitive function, and the relationship of PA with sleep quality, it is necessary to examine objective PA and objective sleep quality concomitantly [52, 53].
This study therefore addresses the current gaps in the literature by examining whether 1) PA is associated with better cognitive performance independently of sleep quality; 2) sleep quality is associated with better cognitive performance independently of PA; and 3) whether PA is associated with sleep quality.
METHODS
Ethical approval for this study was obtained from the Vancouver Coastal Health Research Institute and the University of British Columbia’s Clinical Research Ethics Board (H14-01301). All participants provided written informed consent.
Protocol
For this cross-sectional study, we recruited and collected data between August 27, 2014 and April 27, 2016. At study entry, we ascertained general health, demographics, socioeconomic status, and education by questionnaires. During this initial session, we measured subjective sleep quality using the Pittsburgh Sleep Quality Index (PSQI) [54]. Participants’ PA and sleep quality were then observed for 14 days using the MotionWatch8© wrist-worn actigraphy unit ([MW8] camntech; Cambridge, United Kingdom). Following MW8 observation, we measured cognitive function using the Alzheimer’s Disease Assessment Scale Plus (ADAS-Cog Plus) [55].
Participants
Participants were recruited from Vancouver, British Columbia by advertisements placed in local community centers, newspapers, and word of mouth referrals. Participants were included if they met the following criteria: 1) men and women 55+ years of age living in the Metro Vancouver area; 2) scored >24/30 on the Mini-Mental State Examination (MMSE) [56]; and 3) able to read, write, and speak English with acceptable visual and auditory acuity. Participants were excluded if: 1) diagnosed with dementia of any type; 2) diagnosed with another neurodegenerative or neurological condition; 3) taking medications which may negatively affect cognition; 4) planning to participate or currently enrolled in a clinical drug trial; or 5) unable to speak as judged by an inability to communicate by phone.
Subjective measurement of sleep quality
We measured subjective sleep quality using the PSQI [54]. This 19-item questionnaire assesses sleep quality using subjective ratings for 7 different components (i.e., sleep quality; sleep latency; sleep duration; habitual sleep efficiency; sleep disturbance; use of sleep medication; and daytime dysfunction). Participants answer the questionnaire retrospectively, as the questionnaire surveys sleep components spanning the previous month. The questionnaire has good evidence of validity and reliability [57, 58].
Objective measurement of PA and sleep quality
We measured PA and sleep quality using MW8, a uni-axial, wrist-worn accelerometer with evidence of validity and reliability for use among older adults [52, 53]. For the current study, we used 60 second epochs which is consistent with current guidelines for estimating both PA and sleep quality [59, 60], and the capabilities of the MW8 to measure sleep and PA concurrently. Participants were fitted with the MW8 actigraphy unit and provided detailed information on its features (i.e., the light sensor, event marker button, and status indicator). Participants were instructed to press the event marker button each night when they started trying to sleep; and again each morning when they finished trying to sleep. Consistent with established protocol for wrist-worn actigraphy, participants wore the MW8 on the non-dominant wrist for a period of 14 days [61].
Participants were also given the 9-item Consensus Sleep Diary (CSD; [62]) and asked to complete it each morning upon waking. The responses from the CSD were used to confirm sleep windows identified by participants, as determined by the time stamped event markers. In cases where the event marker and CSD entry disagreed for the start time of the sleep window, we used light sensor data to determine “lights out”. Similarly, when the event marker and CSD entry disagreed for the end of the sleep window, we used “lights on” and activity onset to determine the end of the sleep window. Each day of PA consisted of when the participant reported being awake and out of bed (as per responses to the CSD and confirmed via event marker time stamps from MW8). If responses from the CSD entry disagreed with the event markers entered by participants as the start of the day, we used light sensor data and activity onset to determine the start of the day. Similarly, when the event marker and CSD entry disagreed for the end of day (i.e., time spent trying to sleep), we used the light sensor data to determine the end of the day.
Data reduction
Details of our data reduction procedure can be found elsewhere [51, 53]. Briefly, data were analyzed using MotionWare 1.0.27 (camntech). Data prior to recorded wake-time on the first full day of recording were manually removed in order to only investigate full 24-hour recordings of activity. Each day of activity consisted of when the participant self-reported being awake and out of bed. Participant self-report was confirmed via event marker time stamps from MW8.
The MotionWare software was used to estimate different parameters of sleep quality including: fragmentation index, sleep efficiency (time asleep expressed as a percentage of time in bed), sleep duration (total time spent sleeping), sleep latency (time between “lights out” and falling asleep), and number of awakenings (number of times the participant woke up during the sleep period). Briefly, fragmentation index is defined by MotionWare as the sum of 1) the total time spent sleeping categorized as mobile in the epoch-by-epoch mobile/immobile categorization expressed as a percentage of the time spent asleep; and 2) the number of immobile bouts which were ≤1minute in length expressed as a percentage of the total number of immobile bouts during time spent sleeping. The MW8 estimates of sleep quality have evidence of validity and reliability [63].
A Microsoft Excel macro written by RSF (Supplementary Material 1) was used to reduce PA data to daily calculations of time spent in moderate-to-vigorous PA (>3.0 METs) [52]. We then calculated the percent of each day spent in PA (% PA). For example, if for a given day a participant was asleep from 12:00-6:00 AM, and went to bed the following evening at 10:00 PM, then we assumed that the participant spent 8 hours sleeping in a 24-hour period (i.e., 480 minutes). If this individual engaged in 100 minutes of PA, then the estimated % PA for that day would be:
The benefit of this approach is that it controls for differences in time which participants spent awake and out of bed.
We determined non-wear time MW8 using the criterion of Hutto and colleagues [64]. Briefly, this criterion suggests periods of consecutive zero counts ≥120 minutes in length be considered as non-wear time. Only two participants had periods of non-wear time (total non-wear times of 126 minutes and 278 minutes, respectively) according to this criterion. Thus, we assumed participants did not remove the MW8 during observation.
Cognitive function
We used the ADAS-Cog Plus as a global measure of cognitive function [55]. The ADAS-Cog Plus uses a multidimensional item response theory model which can flexibly utilize item scores from multiple cognitive assessment instruments to generate a global cognitive function score and standard error of measurement for that score. Higher scores indicate poorer cognitive performance. The ADAS-Cog plus score was computed using the 13-item AD Assessment Scale [65], Montreal Cognitive Assessment (MoCA) [66], Trail Making Test A and B [67], Digit Span Forward and Backward [68], and verbal fluency [67]. Detailed descriptions of the procedures used for these tests can be found in Supplementary Material 2.
Statistical analyses
We performed all of our statistical analyses using R version 3.3.1 using the lavaan 0.5–22 package. Our statistical code can be found in Supplementary Material 3. Because MW8 requires 14 days of continuous observation in order to provide a reliable estimate of both PA and sleep quality [53], we needed to exclude 11 participants with incomplete data. We also excluded 9 participants from our analyses because they each had extreme outlier scores on variables of interest (i.e., >3 SD from the mean). Two participants had extreme average % PA (32.2% and 38.6% of day spent in PA), four participants had extreme average fragmentation indices (range: 66.14–71.85) and two had extreme average sleep latency (42 minutes and 72 minutes). In addition, we removed one participant from our analyses due to an extreme ADAS-Cog Plus score (1.52), which suggested possible severe cognitive impairment (MMSE = 25; MoCA = 17). Structural equation modeling is based on the general linear model, which assumes the data has a normal distribution; including these data would skew the distribution of our data and increase type I error [69]. Thus, our final sample size was 137.
Greater numbers of nocturnal awakenings decrease the accuracy of actigraphy [70], and this inaccuracy mostly affects measures of wakefulness during the night and sleep latency [71, 72]. As such, we included as a covariate the number of awakenings each night for each of our analyses of sleep efficiency (r = –0.62; p < 0.01), sleep fragmentation (r = 0.58; p < 0.01), and sleep latency (r = 0.20; p < 0.01) in an effort to reduce error variance. Controlling for the number of awakenings also intuitively seems appropriate for determining the most accurate estimates of sleep fragmentation and sleep efficiency. For example, an individual could have 100 separate 1-minute bouts of wakefulness over the course of 8 hours spent in bed, or one bout of 100 minutes of wakefulness. Not controlling for the number of awakenings would provide identical estimates for sleep efficiency despite very different sleep architectures between these two hypothetical individuals. We expect there to be a similar example for sleep fragmentation, and thus controlling for the number of awakenings potentially provides the most accurate estimates of sleep fragmentation and sleep efficiency.
Preliminary analyses
We calculated mean % PA, PSQI score, fragmentation index, sleep efficiency, sleep duration, and sleep latency over 14 days and then estimated bivariate correlations between all variables. Given our sample size of 137 participants and a two-tailed α= 0.01, we had 80% power to detect a two-tailed correlation with a small effect size (|ρ| = 0.28) [73].
Main analyses
Our main analyses used latent variable modeling to examine whether 1) PA is associated with cognitive performance independently of sleep quality (i.e., PSQI score, fragmentation index, sleep efficiency, sleep duration, and sleep latency); 2) sleep quality is associated with cognitive function independently of PA; and 3) PA is associated with better sleep quality. The strength of this approach is that it allows researchers to examine latent variable models which provide separate estimates of relations of the latent construct with the measured variables used to estimate the latent construct (i.e., the measurement model), and the relationships of the different latent constructs with each other, or with other outcome variables (i.e., the structural model) [74]. This allows examination of the relations among latent constructs which are corrected for biases attributable to random error and construct-irrelevant variance.
Our model is described in Fig. 1. Briefly, we generated four separate models which each concomitantly examined:
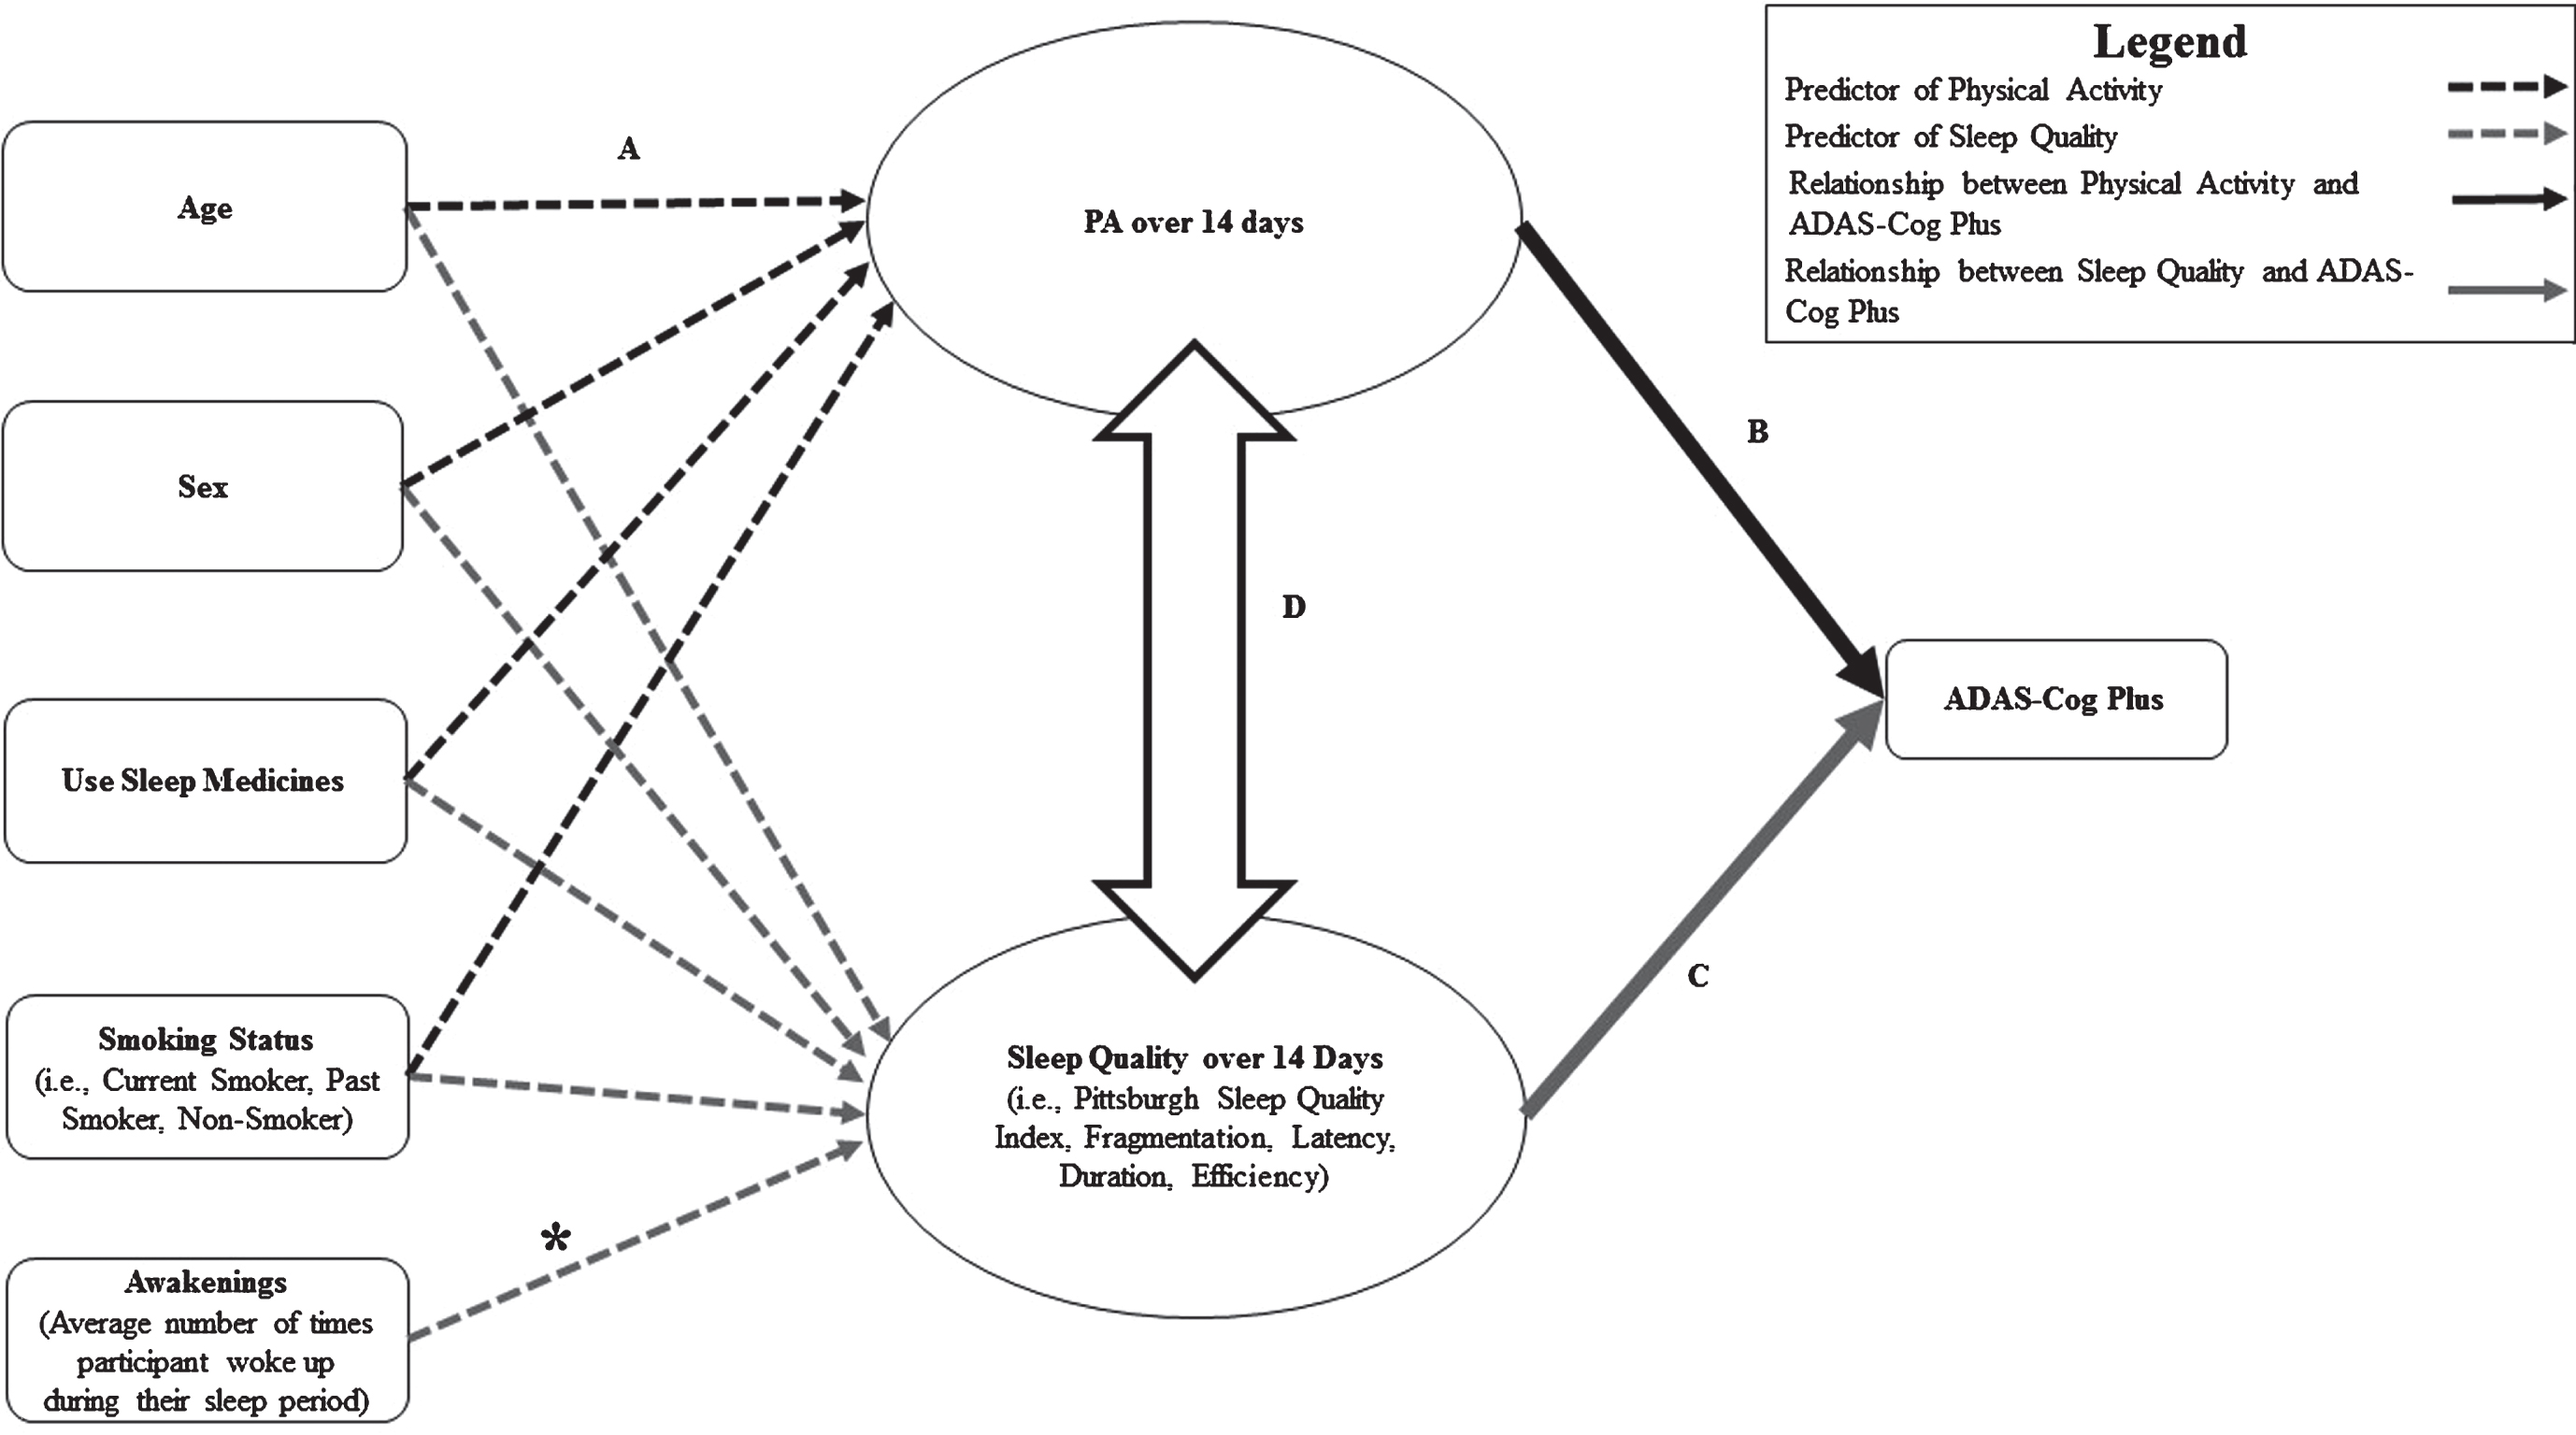
Hypothesized relationship between physical activity (PA) and sleep quality. Path A: Black dotted lines represent the relationship between covariates and PA, grey dotted lines represent relationship between covariates and sleep quality. Path B: Black line represents the relationship between PA and cognitive performance on the Alzheimer’s Disease Assessment Scale Plus (ADAS-Cog Plus). Path C: Grey line represents the relationship between sleep quality and cognitive performance on the ADAS-Cog Plus. Path D: Outlined double-arrow represents relationship between PA and sleep quality. *Note: Models examining the relationship of PA with 1) sleep fragmentation; 2) sleep efficiency; and 3) sleep latency were adjusted for the number of awakenings each night. Awakenings was included as a predictor of sleep quality, and as a covariate for the relationship between sleep quality and cognitive function.
The predictors of the latent construct of PA and the predictors of the specified latent construct of sleep quality (i.e., PSQI score, sleep fragmentation, sleep duration, sleep efficiency, or sleep latency). The relationship of the latent construct of PA with cognitive function, independently of the specified construct of sleep quality. The relationship of the specified latent construct of sleep quality with cognitive function, independently of latent construct PA The relationship of latent construct PA with the specified construct of sleep quality.
Latent construct PA was estimated from each daily estimate of % PA. We separately estimated latent constructs of sleep quality for PSQI score, sleep fragmentation, sleep efficiency, sleep duration, and sleep latency from daily estimates for the given measure of sleep quality. For example, the latent construct of sleep fragmentation was estimated from each daily estimate of fragmentation index over the 14-day measurement period. Manifest indicators for each daily estimate of % PA and/or sleep quality were fixed such that each day contributed an equal loading on the latent variable. In order to improve model fit, each daily estimate of % PA was allowed to correlate with the previous day’s estimate. Thus, % PA on the third day of measurement was allowed to correlate with % PA on the fourth day of measurement. We also used the same approach to improve model fit for each given measure of sleep quality, such that each daily estimate for a given measure of sleep quality was allowed to correlate with the previous day’s estimate. For example, sleep duration on the third day of measurement was allowed to correlate with sleep duration on the fourth day. In order to maintain parsimony and clarity, we generated a separate model for each sleep quality measure.
Each model thus concomitantly estimated the relationship of 1) PA and the specified latent construct of sleep quality from age, sex, use of sleep medication, and smoking status (Fig. 1, Path A); 2) PA and ADAS-Cog Plus score controlling for age, sex, education, and the specified latent construct of sleep quality (Fig. 1, Path B); 3) the specified latent construct of sleep quality and ADAS-Cog Plus score controlling for age, sex, education, and PA (Fig. 1, Path C); and 4) PA and the specified latent construct of sleep quality (Fig. 1, Path D). We generated model fit statistics for each of our four separate models (Supplementary Material 4). Acceptable goodness-of-fit (i.e., RMSEA <0.10 and SRMR <0.08) was determined using the criteria of Hooper, Coughlan and Mullen [75].
Participant characteristics (N = 137)
aAdjusted for average awakenings each night.
RESULTS
Correlation matrix
Note: PSQI, Pittsburgh Sleep Quality Index; ADAS-Cog Plus, Alzheimer’s Disease Assessment Scale Plus; % PA, Percent of the day spent in physical activity. *p < 0.05; **p < 0.01; aAdjusted for number of awakenings each night.
Structural Equation Model Estimates±s.e.
Note: ADAS-Cog Plus, Alzheimer’s Disease Assessment Scale Plus. *p < 0.05; **p < 0.01.
Participant characteristics
Table 1 provides participant characteristics. The mean age was 71.22 years (SD = 7.23 years) and 67.9% were female. Mean % PA was 9.91 (SD = 5.84), mean PSQI score was 7.29 (SD = 3.99), and mean sleep duration was 402.41 minutes (SD = 46.90).
Preliminary analyses
Bivariate and partial correlations are described in Table 2. Greater age was significantly associated with poorer ADAS-Cog Plus performance (r = 0.36; p < 0.01), less % PA (r = –0.31; p < 0.01), more fragmented sleep (r = 0.31; p < 0.01), and longer sleep duration (r = 0.18; p = 0.04). Better ADAS-Cog Plus performance was associated with higher % PA (r = –0.28; p < 0.01). However, ADAS-Cog Plus was not significantly associated with any measure of sleep quality. In addition, % PA was not significantly associated with any measure of sleep quality.
Main analyses
The results of our latent variable analyses are described in Table 3 and Figs. 2–6. All models achieved acceptable levels of fit [75]. Model fit statistics can be found in Supplementary Material 5.
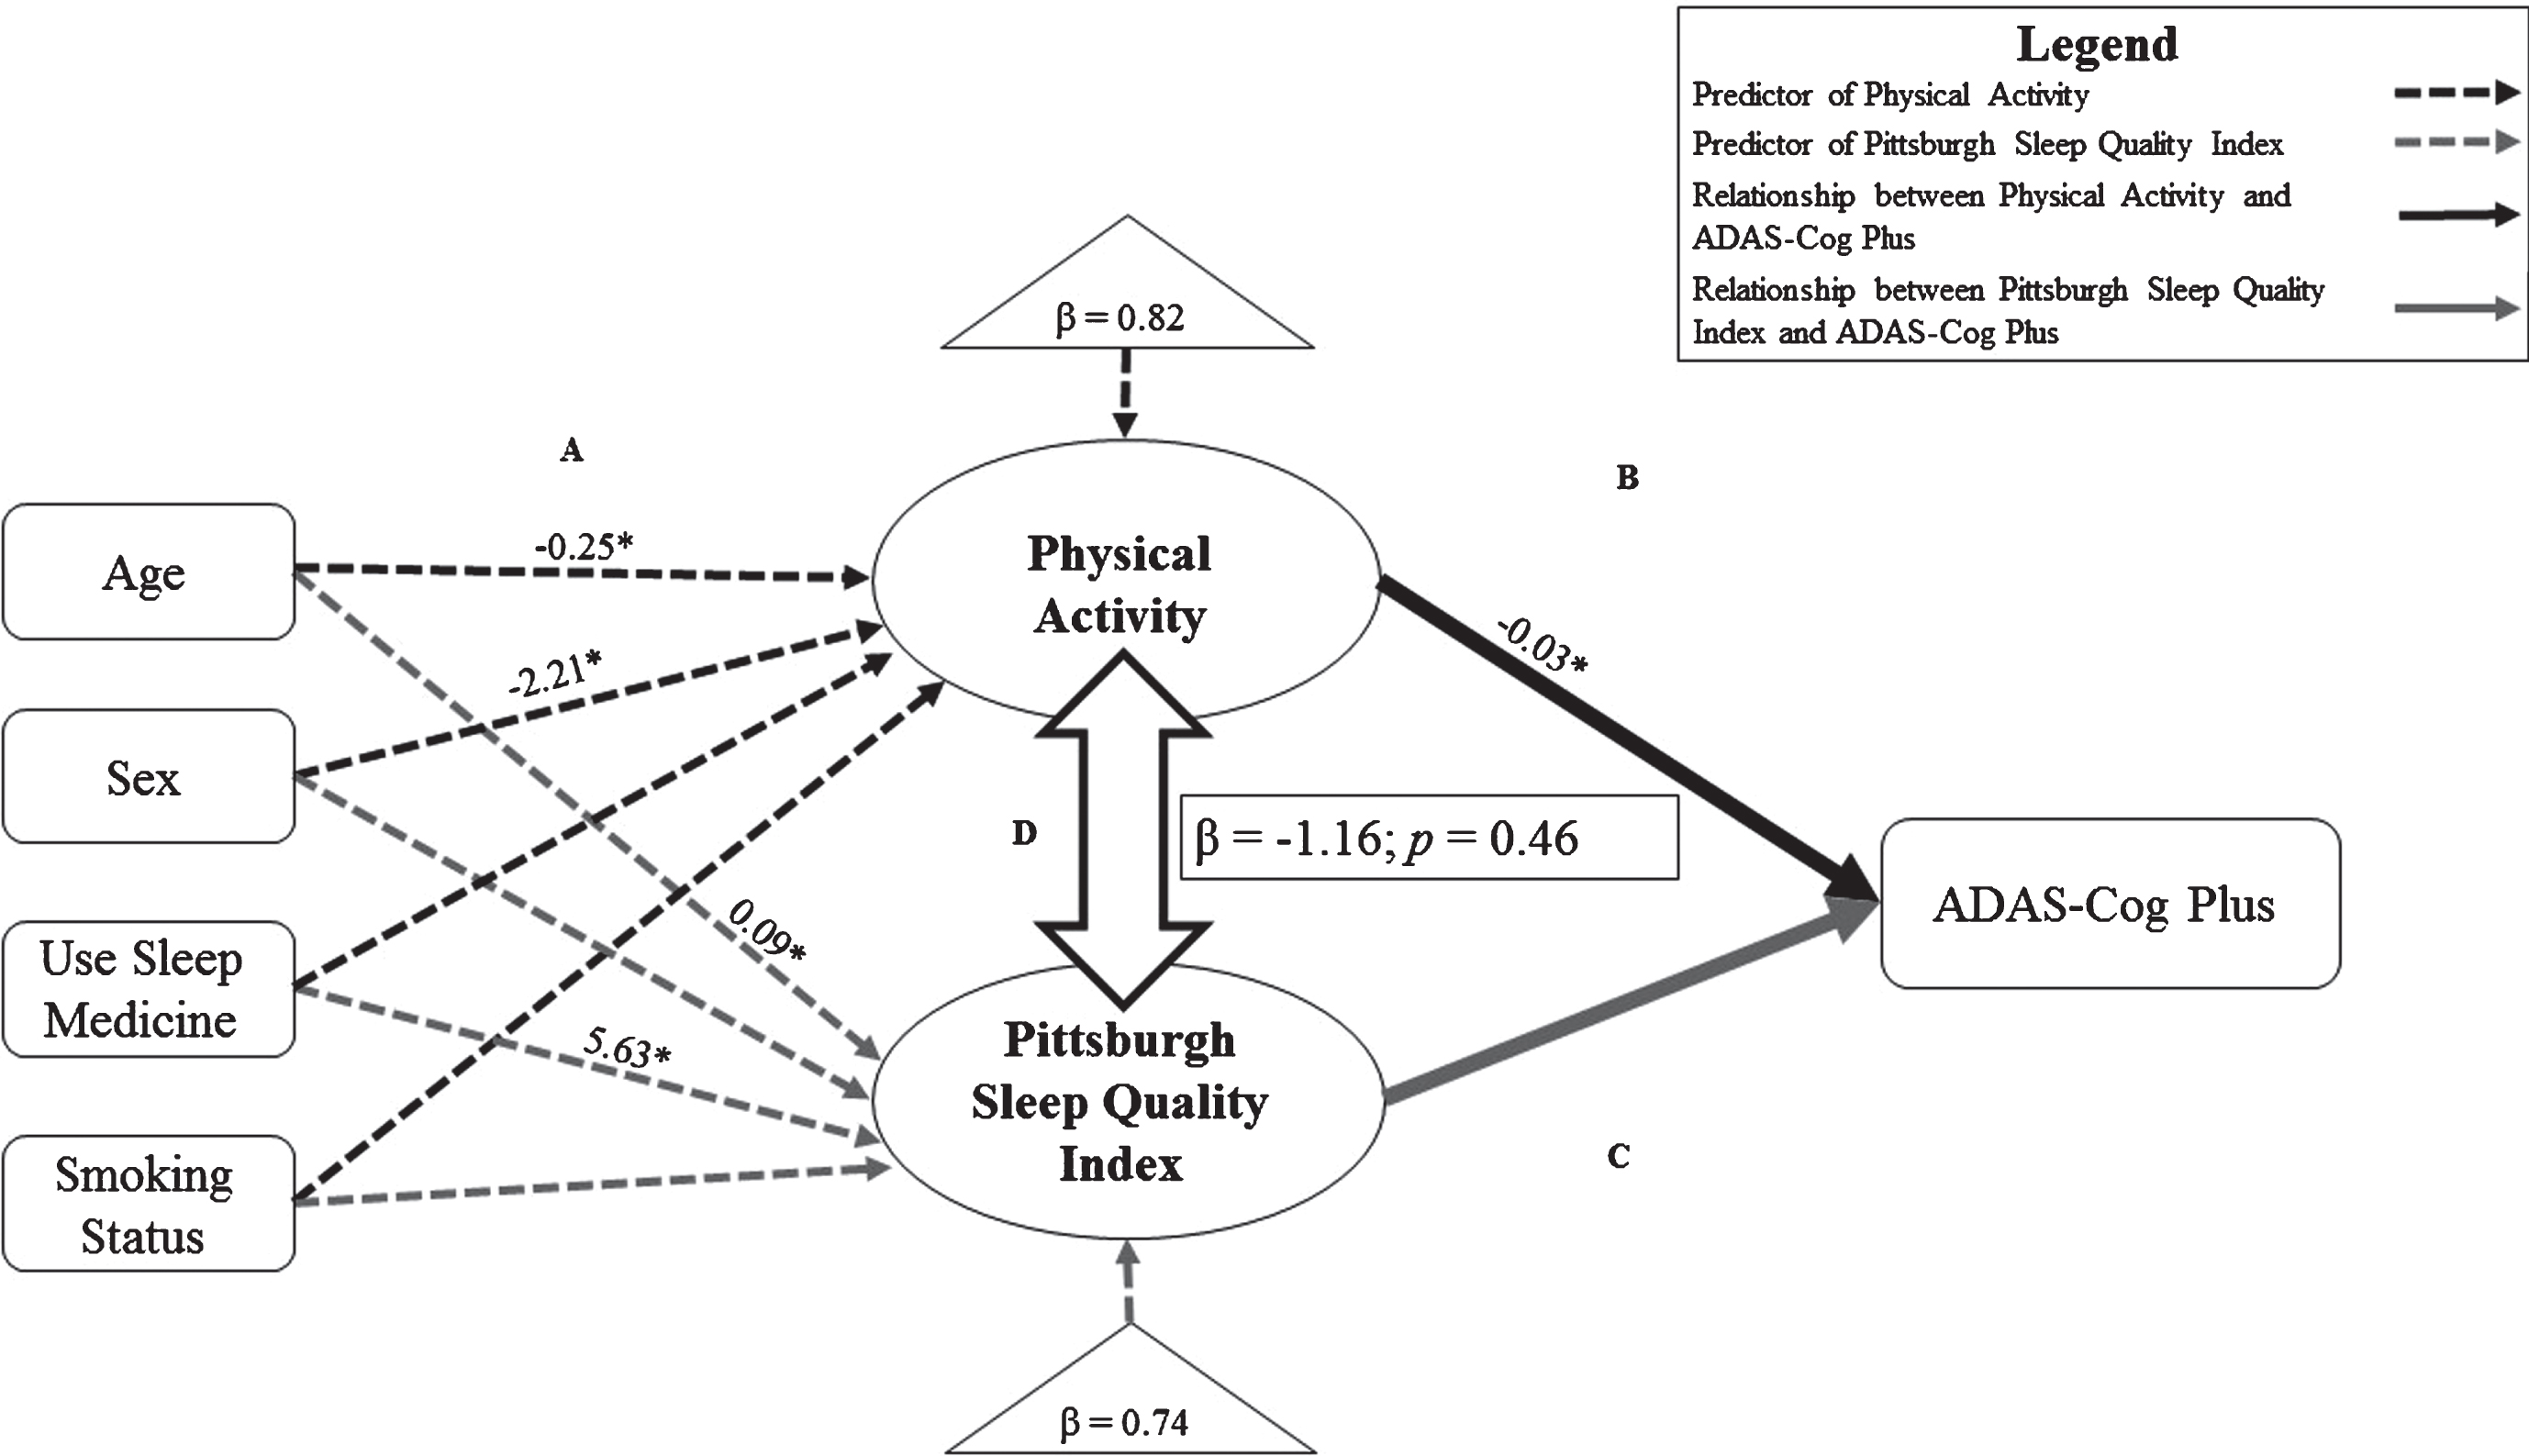
Structural equation models exploring the relationship of physical activity (PA) with Pittsburgh Sleep Quality Index. Significant relationships and standardized estimates (p < 0.05; *p < 0.01) are displayed. Models have been simplified for clarity. Path A: Black dotted lines represent predictors of PA over 14 days. Grey dotted lines represent predictors of Pittsburgh Sleep Quality Index score. Path B: Black solid line represents the relationship of PA with cognitive performance on the Alzheimer’s Disease Assessment Scale Plus (ADAS-Cog Plus); controlling for age, sex, education, and Pittsburgh Sleep Quality Index score. Path C: Grey solid line represents the relationship of Pittsburgh Sleep Quality Index score with cognitive performance on the ADAS-Cog Plus; controlling for age, sex, education and PA. Path D: Outlined double-arrows represent the relationship between PA and Pittsburgh Sleep Quality Index score; standardized-betas and p-values are shown in box.
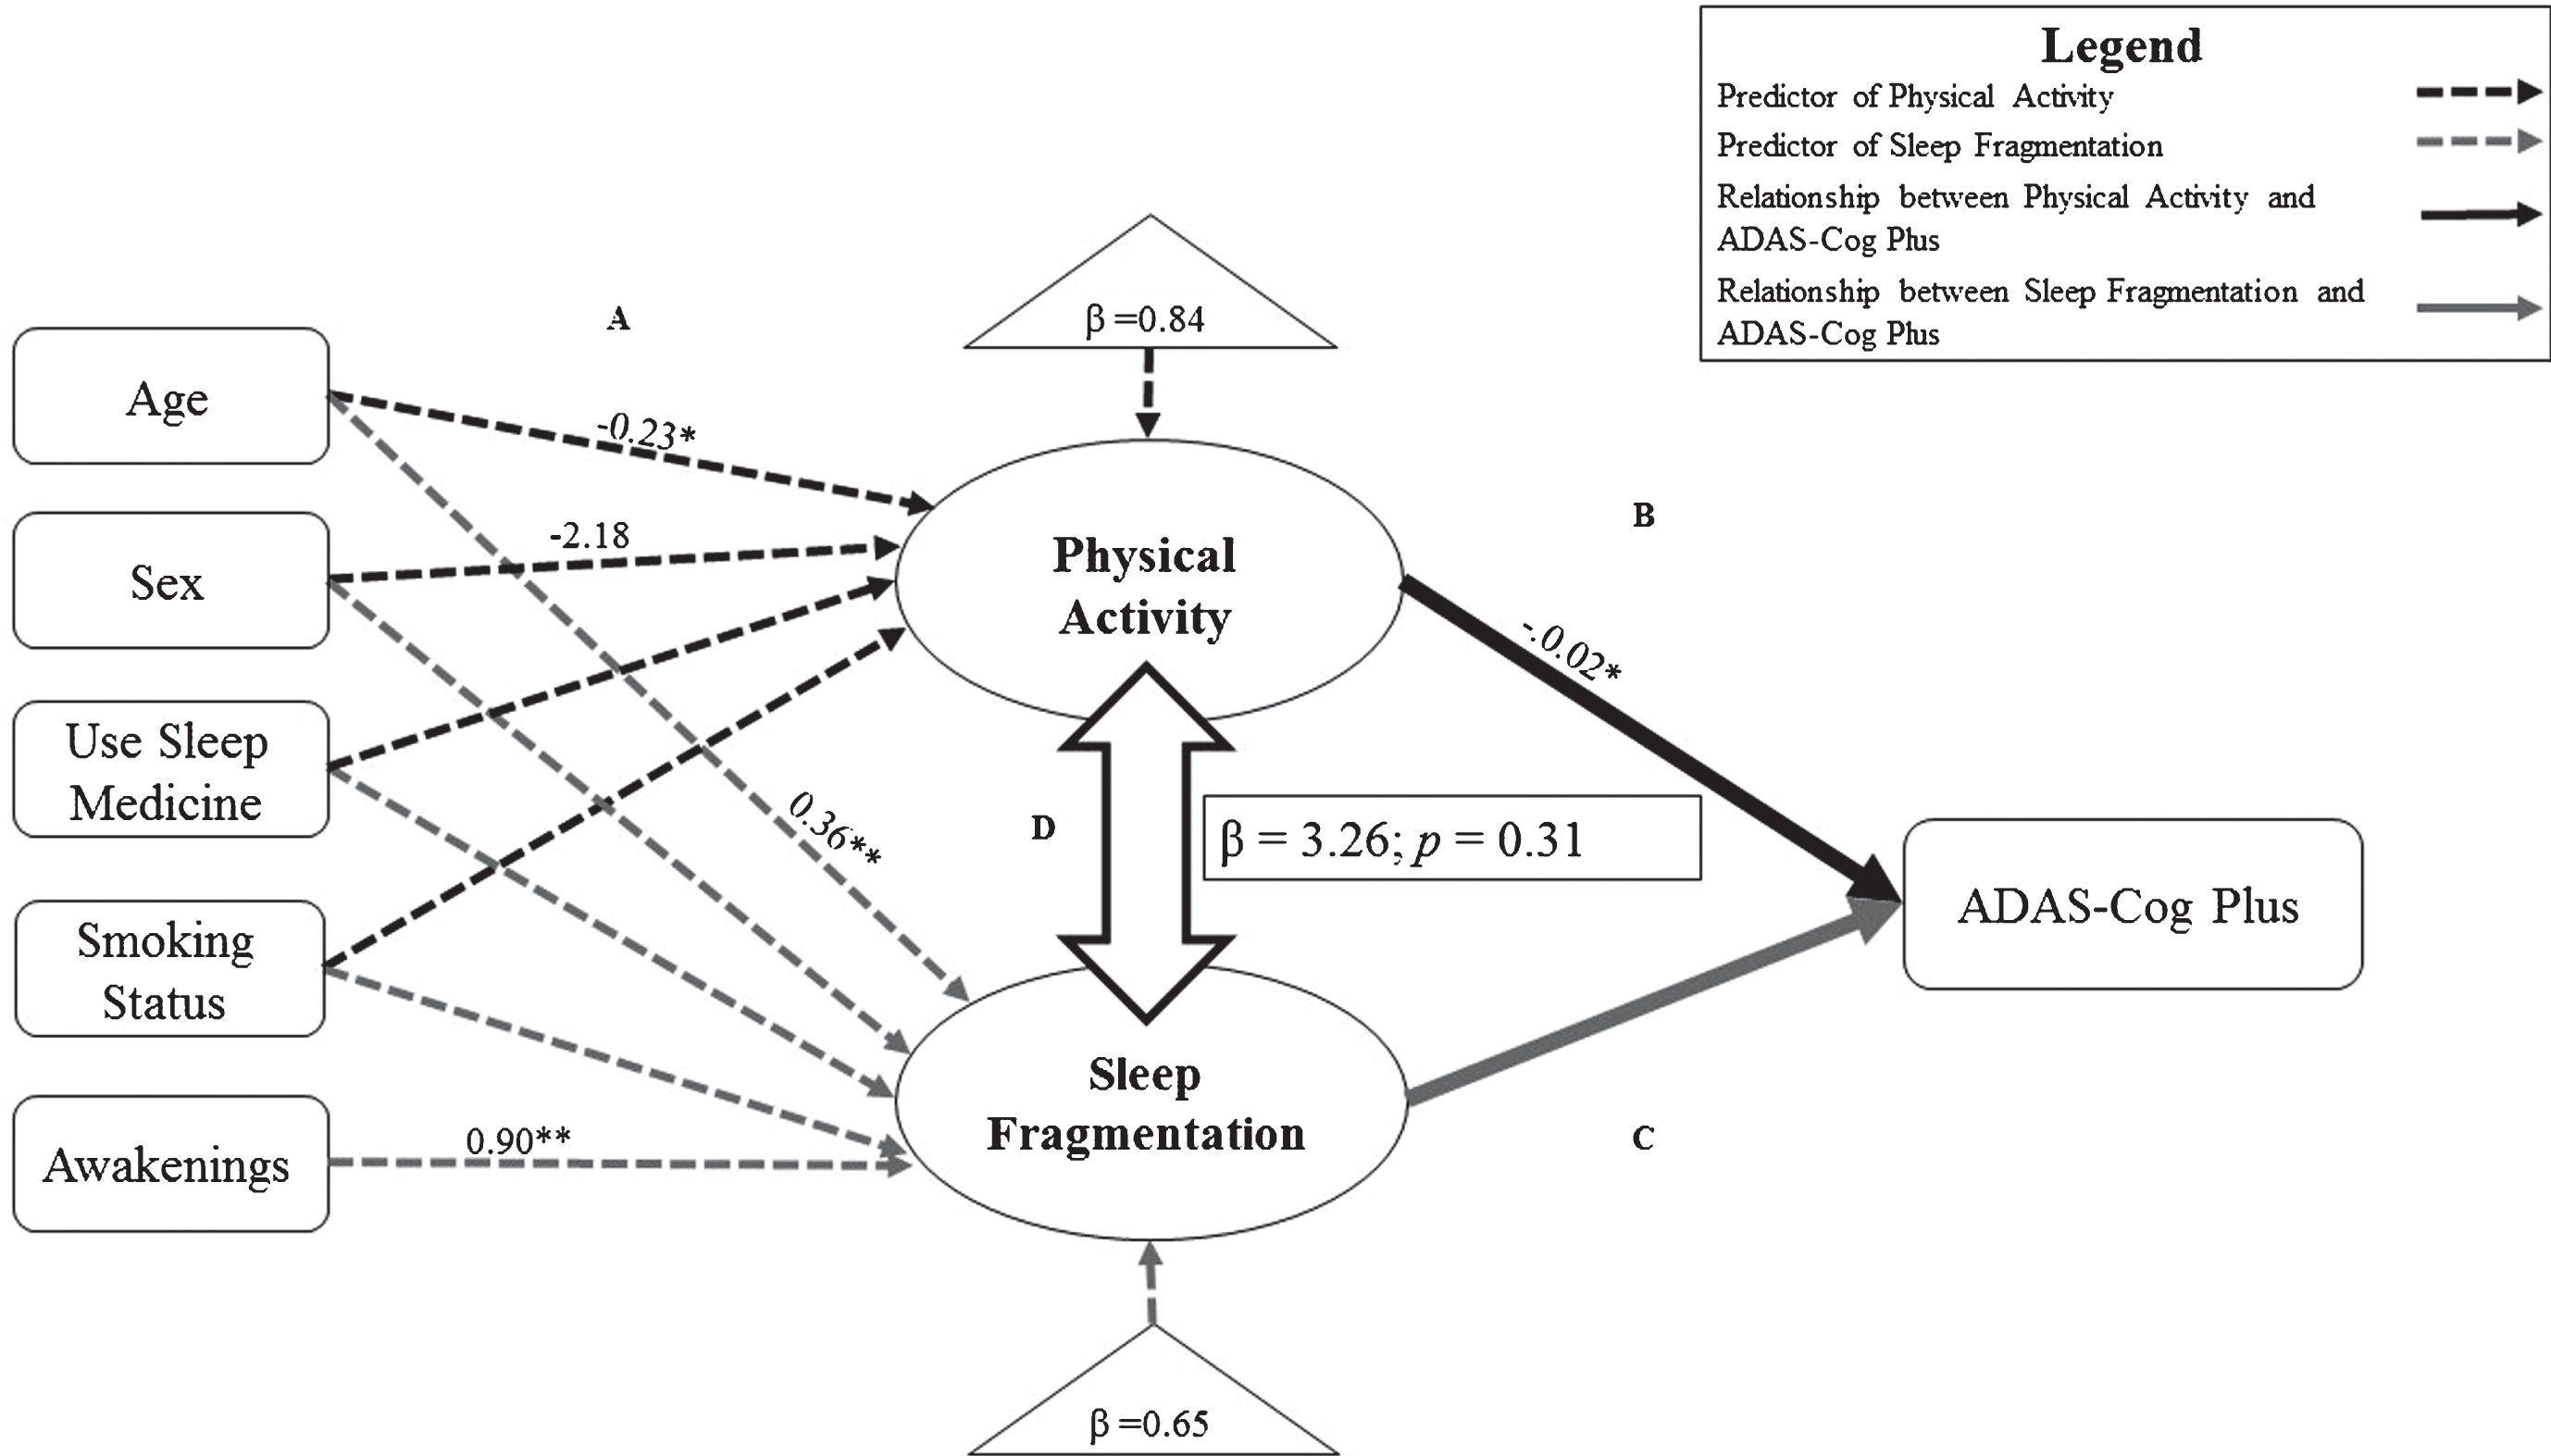
Structural equation models exploring the relationship of physical activity (PA) with sleep fragmentation. Significant relationships and standardized estimates (p < 0.05; *p < 0.01) are displayed. Models have been simplified for clarity. Path A: Black dotted lines represent predictors of PA over 14 days. Grey dotted lines represent predictors of sleep fragmentation over 14 days. Path B: Black solid line represents the relationship of PA with cognitive performance on the Alzheimer’s Disease Assessment Scale Plus (ADAS-Cog Plus); controlling for age, sex, education, and sleep fragmentation. Path C: Grey solid line represents the relationship of sleep fragmentation with cognitive performance on the ADAS-Cog Plus; controlling for age, sex, education, awakenings, and PA. Path D: Outlined double-arrows represent the relationship between PA and sleep fragmentation; standardized-betas and p-values are shown in box.

Structural equation models exploring the relationship of physical activity (PA) with sleep efficiency. Significant relationships and standardized estimates (p < 0.05; *p < 0.01) are displayed. Models have been simplified for clarity. Path A: Black dotted lines represent predictors of PA over 14 days. Grey dotted lines represent predictors of sleep efficiency over 14 days. Path B: Black solid line represents the relationship of PA with cognitive performance on the Alzheimer’s Disease Assessment Scale Plus (ADAS-Cog Plus); controlling for age, sex, education, and sleep efficiency. Path C: Grey solid line represents the relationship of sleep efficiency with cognitive performance on the ADAS-Cog Plus; controlling for age, sex, education, awakenings and PA. Path D: Outlined double-arrows represent the relationship between PA and sleep efficiency; standardized-betas and p-values are shown in box.
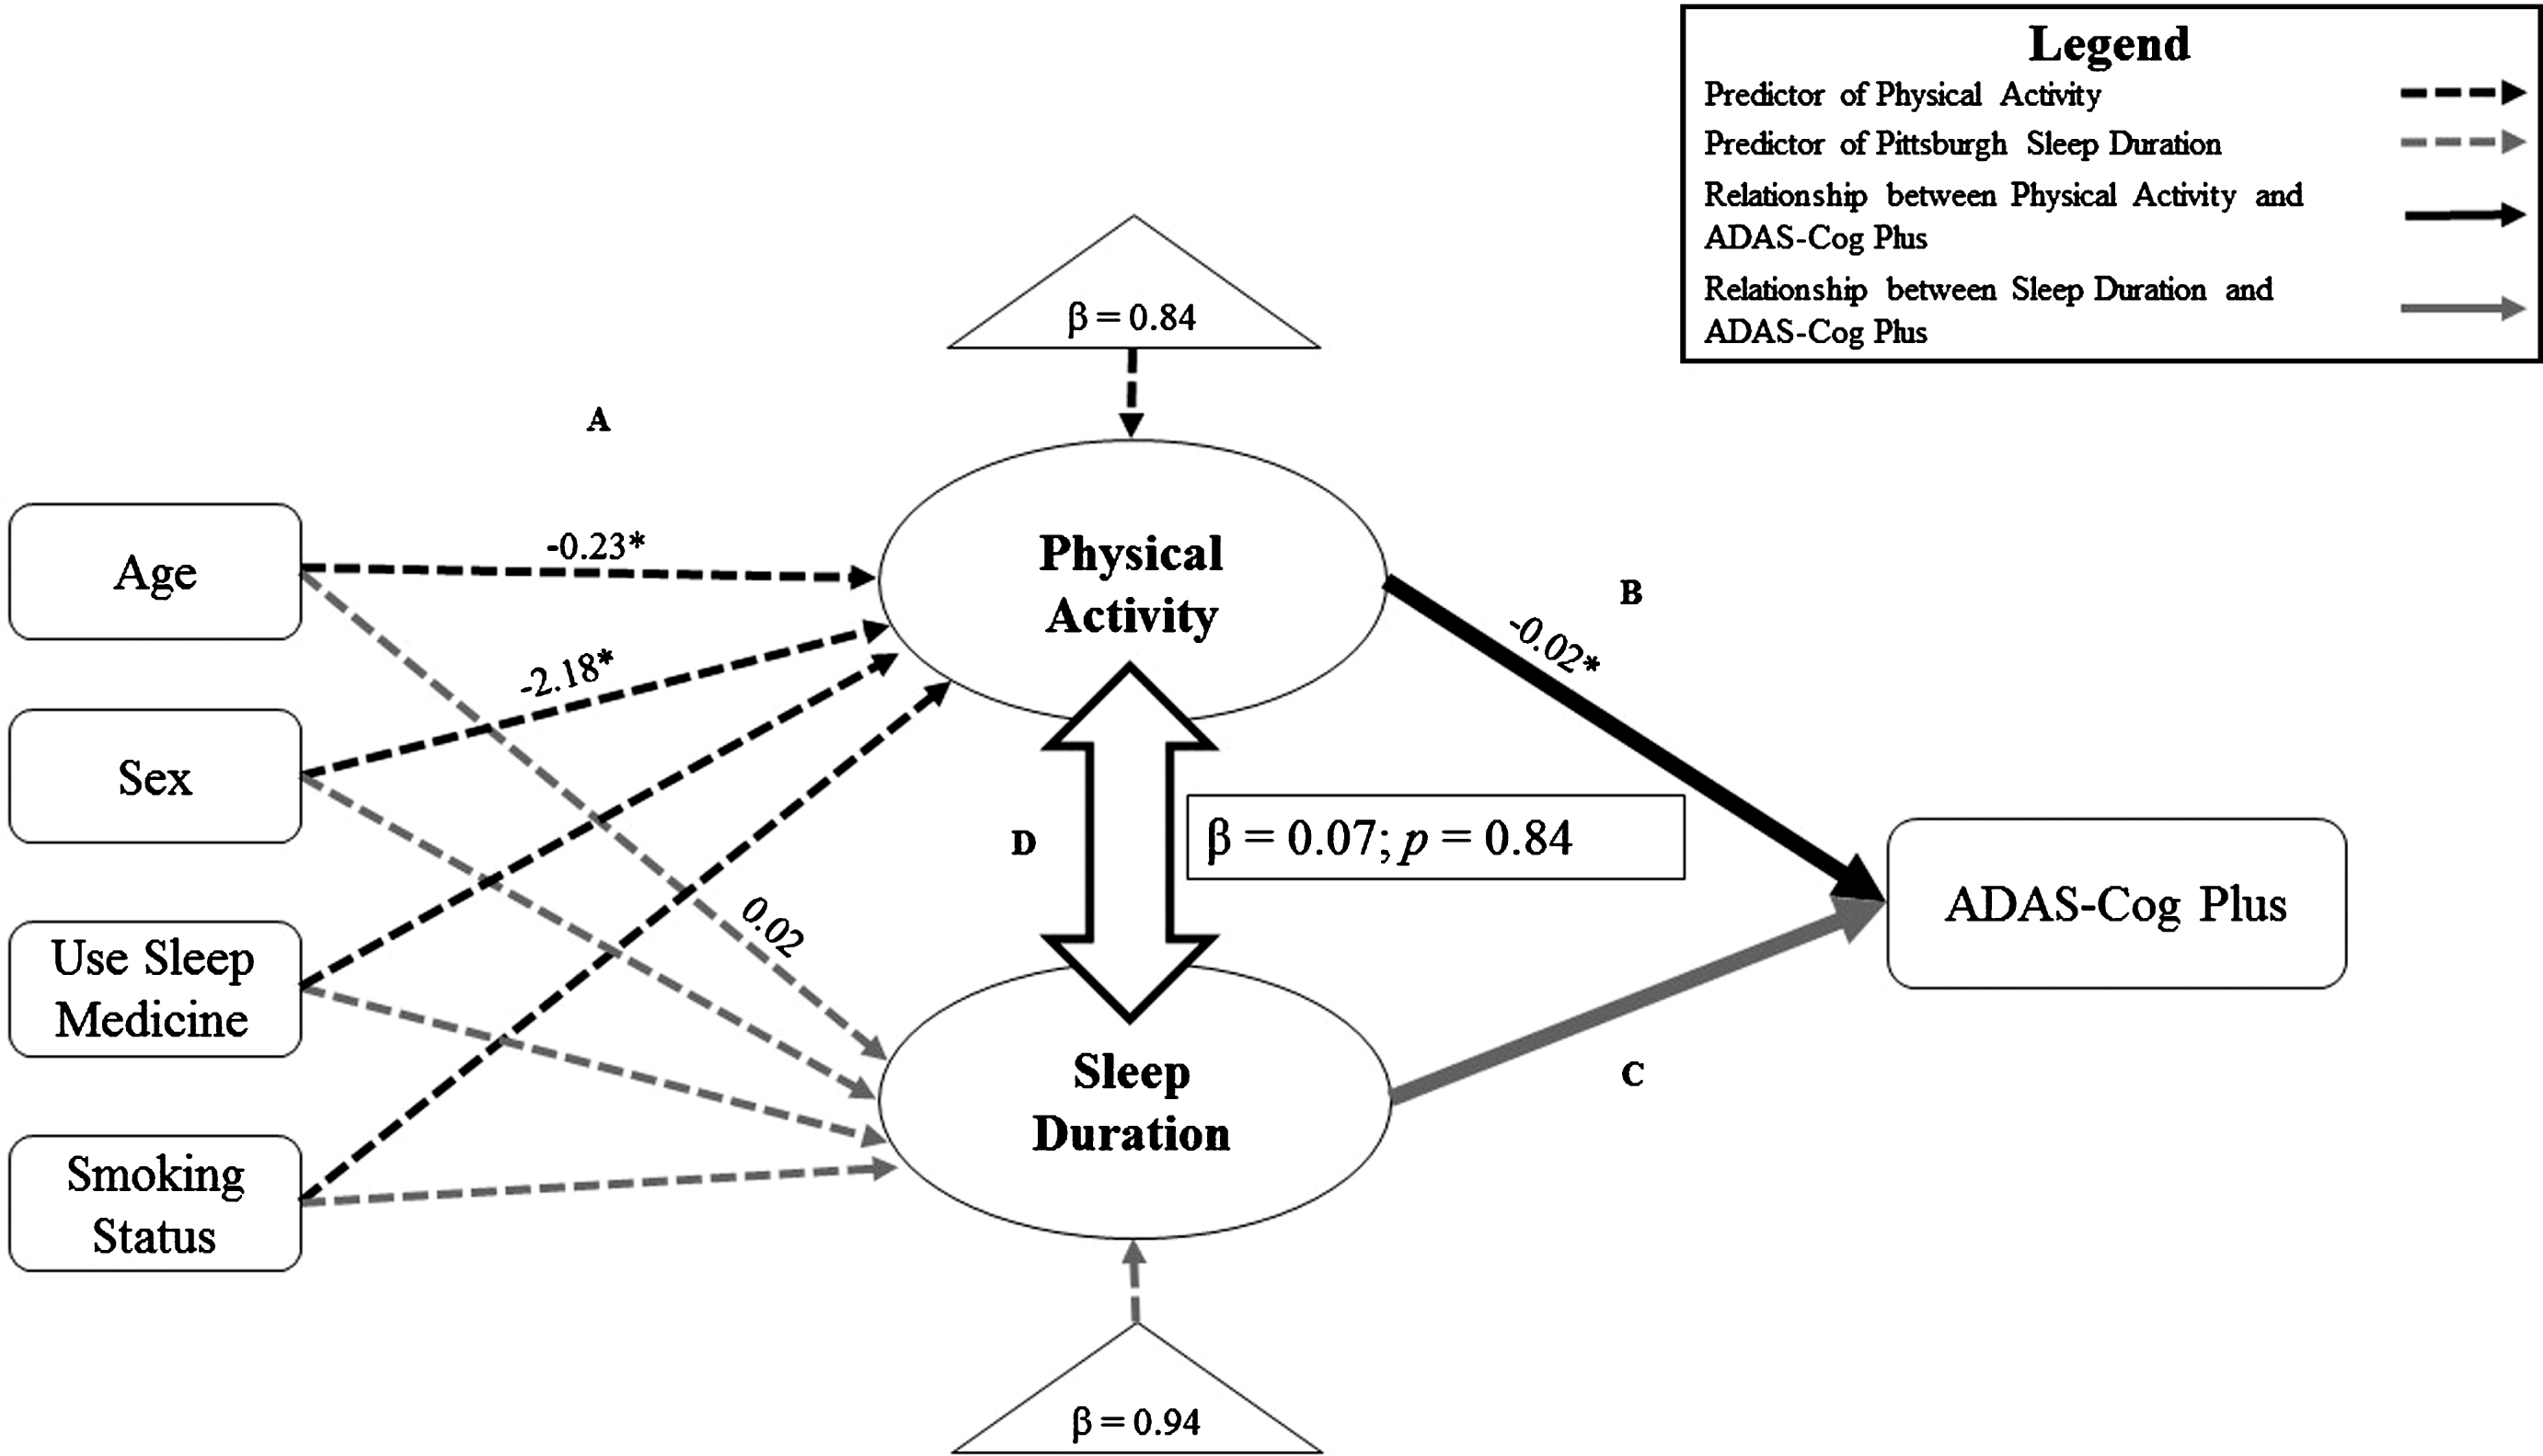
Structural equation models exploring the relationship of physical activity (PA) with sleep duration. Significant relationships and standardized estimates (p < 0.05; *p < 0.01) are displayed. Models have been simplified for clarity. Path A: Black dotted lines represent predictors of PA over 14 days. Grey dotted lines represent predictors of sleep duration over 14 days. Path B: Black solid line represents the relationship of PA with cognitive performance on the Alzheimer’s Disease Assessment Scale Plus (ADAS-Cog Plus); controlling for age, sex, education, and sleep efficiency. Path C: Grey solid line represents the relationship of sleep duration with cognitive performance on the ADAS-Cog Plus; controlling for age, sex, education and PA. Path D: Outlined double-arrows represent the relationship between PA and sleep duration; standardized-betas and p-values are shown in box.
Association of PA, PSQI, and ADAS-Cog Plus
Predictors of our latent variable PA and latent variable PSQI are described in Fig. 2A. Predictors for latent variable PA explained 18% of the variance, with greater age (β= –0.25; p < 0.01) and female sex (β= –2.21; p = 0.02) associated with lower PA. Predictors for latent variable of PSQI explained 26% of the variance, with age (β= 0.09; p < 0.01) and use of sleep medication (β= 5.63; p < 0.01) being associated with poorer sleep quality. Figure 2B describes the relationship between PA and cognitive performance, wherein greater PA was associated with better ADAS-Cog Plus Score independently of PSQI (β= –0.03; p < 0.01). PSQI was not associated with ADAS-Cog Plus performance independently of PA (Fig. 2C). In addition, there was no significant relationship between PA and PSQI (Fig. 2D).
Association of PA, sleep fragmentation, and ADAS-Cog Plus
Figure 3A describes the predictors for latent variable PA and latent variable sleep fragmentation. Predictors for latent variable PA explained 16% of the variance, with greater age (β= –0.23; p < 0.01) and female sex (β= –2.18; p = 0.02) associated with lower PA. Predictors for our latent variable of sleep fragmentation explained 45% of the variance, with age (β= 0.36; p < 0.01) and average number of awakenings (β= 0.90; p < 0.01) being associated with greater sleep fragmentation. Figure 3B illustrates the relationship between PA and cognitive performance, wherein greater PA was associated with better ADAS-Cog Plus Score independently of sleep fragmentation (β= –0.02; p < 0.01). Figure 3C illustrates that there was no significant relationship between sleep fragmentation and ADAS-Cog Plus performance independently of PA. There was also no significant relationship between PA and sleep fragmentation (Fig. 3D).
Association of PA, sleep efficiency, and ADAS-Cog Plus
In Fig. 4A, we describe the predictors for latent variable PA and sleep efficiency. Briefly, predictors for PA explained 16% of the variance, with greater age (β= –0.23; p < 0.01) and female sex (β= –2.18; p = 0.02) associated with lower PA. Predictors for sleep efficiency explained 33% of the variance, with average number of awakenings (β= –0.49; p < 0.01) being associated with poorer sleep quality; female sex (β= 1.63; p = 0.03) and smoking status (β= 1.28; p = 0.05) were associated with higher sleep efficiency. Figure 4B illustrates that higher PA was marginally associated with better performance on ADAS-Cog Plus independently of sleep efficiency (β= –0.02; p = 0.06). Figure 4C describes the relationship between sleep efficiency and cognitive performance, where greater sleep efficiency was significantly associated with better performance on ADAS-Cog Plus independently of PA (β= –0.01; p = 0.04). However, there was no significant relationship between PA and sleep efficiency (Fig. 4D).
Association of PA, sleep duration, and ADAS-Cog Plus
Figure 5A describes the predictors for latent variable PA and latent variable sleep duration. Predictors for latent variable PA explained 16% of the variance, with greater age (β= –0.23; p < 0.01) and female sex(β= –2.18; p = 0.02) associated with lower PA. Predictors for latent variable of sleep duration explained 6% of the variance with greater age associated with longer sleep duration (β= 0.02; p = 0.03). Figure 5B illustrates the relationship between PA and cognitive performance, wherein higher PA was significantly associated with better performance on ADAS-Cog Plus independently of sleep duration (β= –0.02; p < 0.01). Sleep duration was not significantly associated with ADAS-Cog Plus performance independently of PA (Fig. 5C), and there was no significant relationship between PA and sleep duration (Fig. 5D).
Association of PA, sleep latency, and ADAS-Cog Plus
Figure 6A describes the predictors of latent variable PA and latent variable sleep latency. Predictors for latent variable PA explained 16% of the variance, with greater age (β= –0.23; p < 0.01) and female sex (β= –2.18; p = 0.02) associated with lower PA. Predictors for our latent variable of sleep latency explained 14% of the variance with sleep medication use (β= 2.28; p = 0.03) and average number of awakenings (β= –2.15 p < 0.01). Figure 6B describes the relationship between PA and cognitive performance, wherein higher PA was significantly associated with better performance on ADAS-Cog Plus independently of sleep latency (β= –0.02; p < 0.01). Figure 6C shows that sleep latency was not significantly associated with ADAS-Cog Plus performance independently of PA. We found that there was no significant relationship between PA and sleep latency (Fig. 6D).
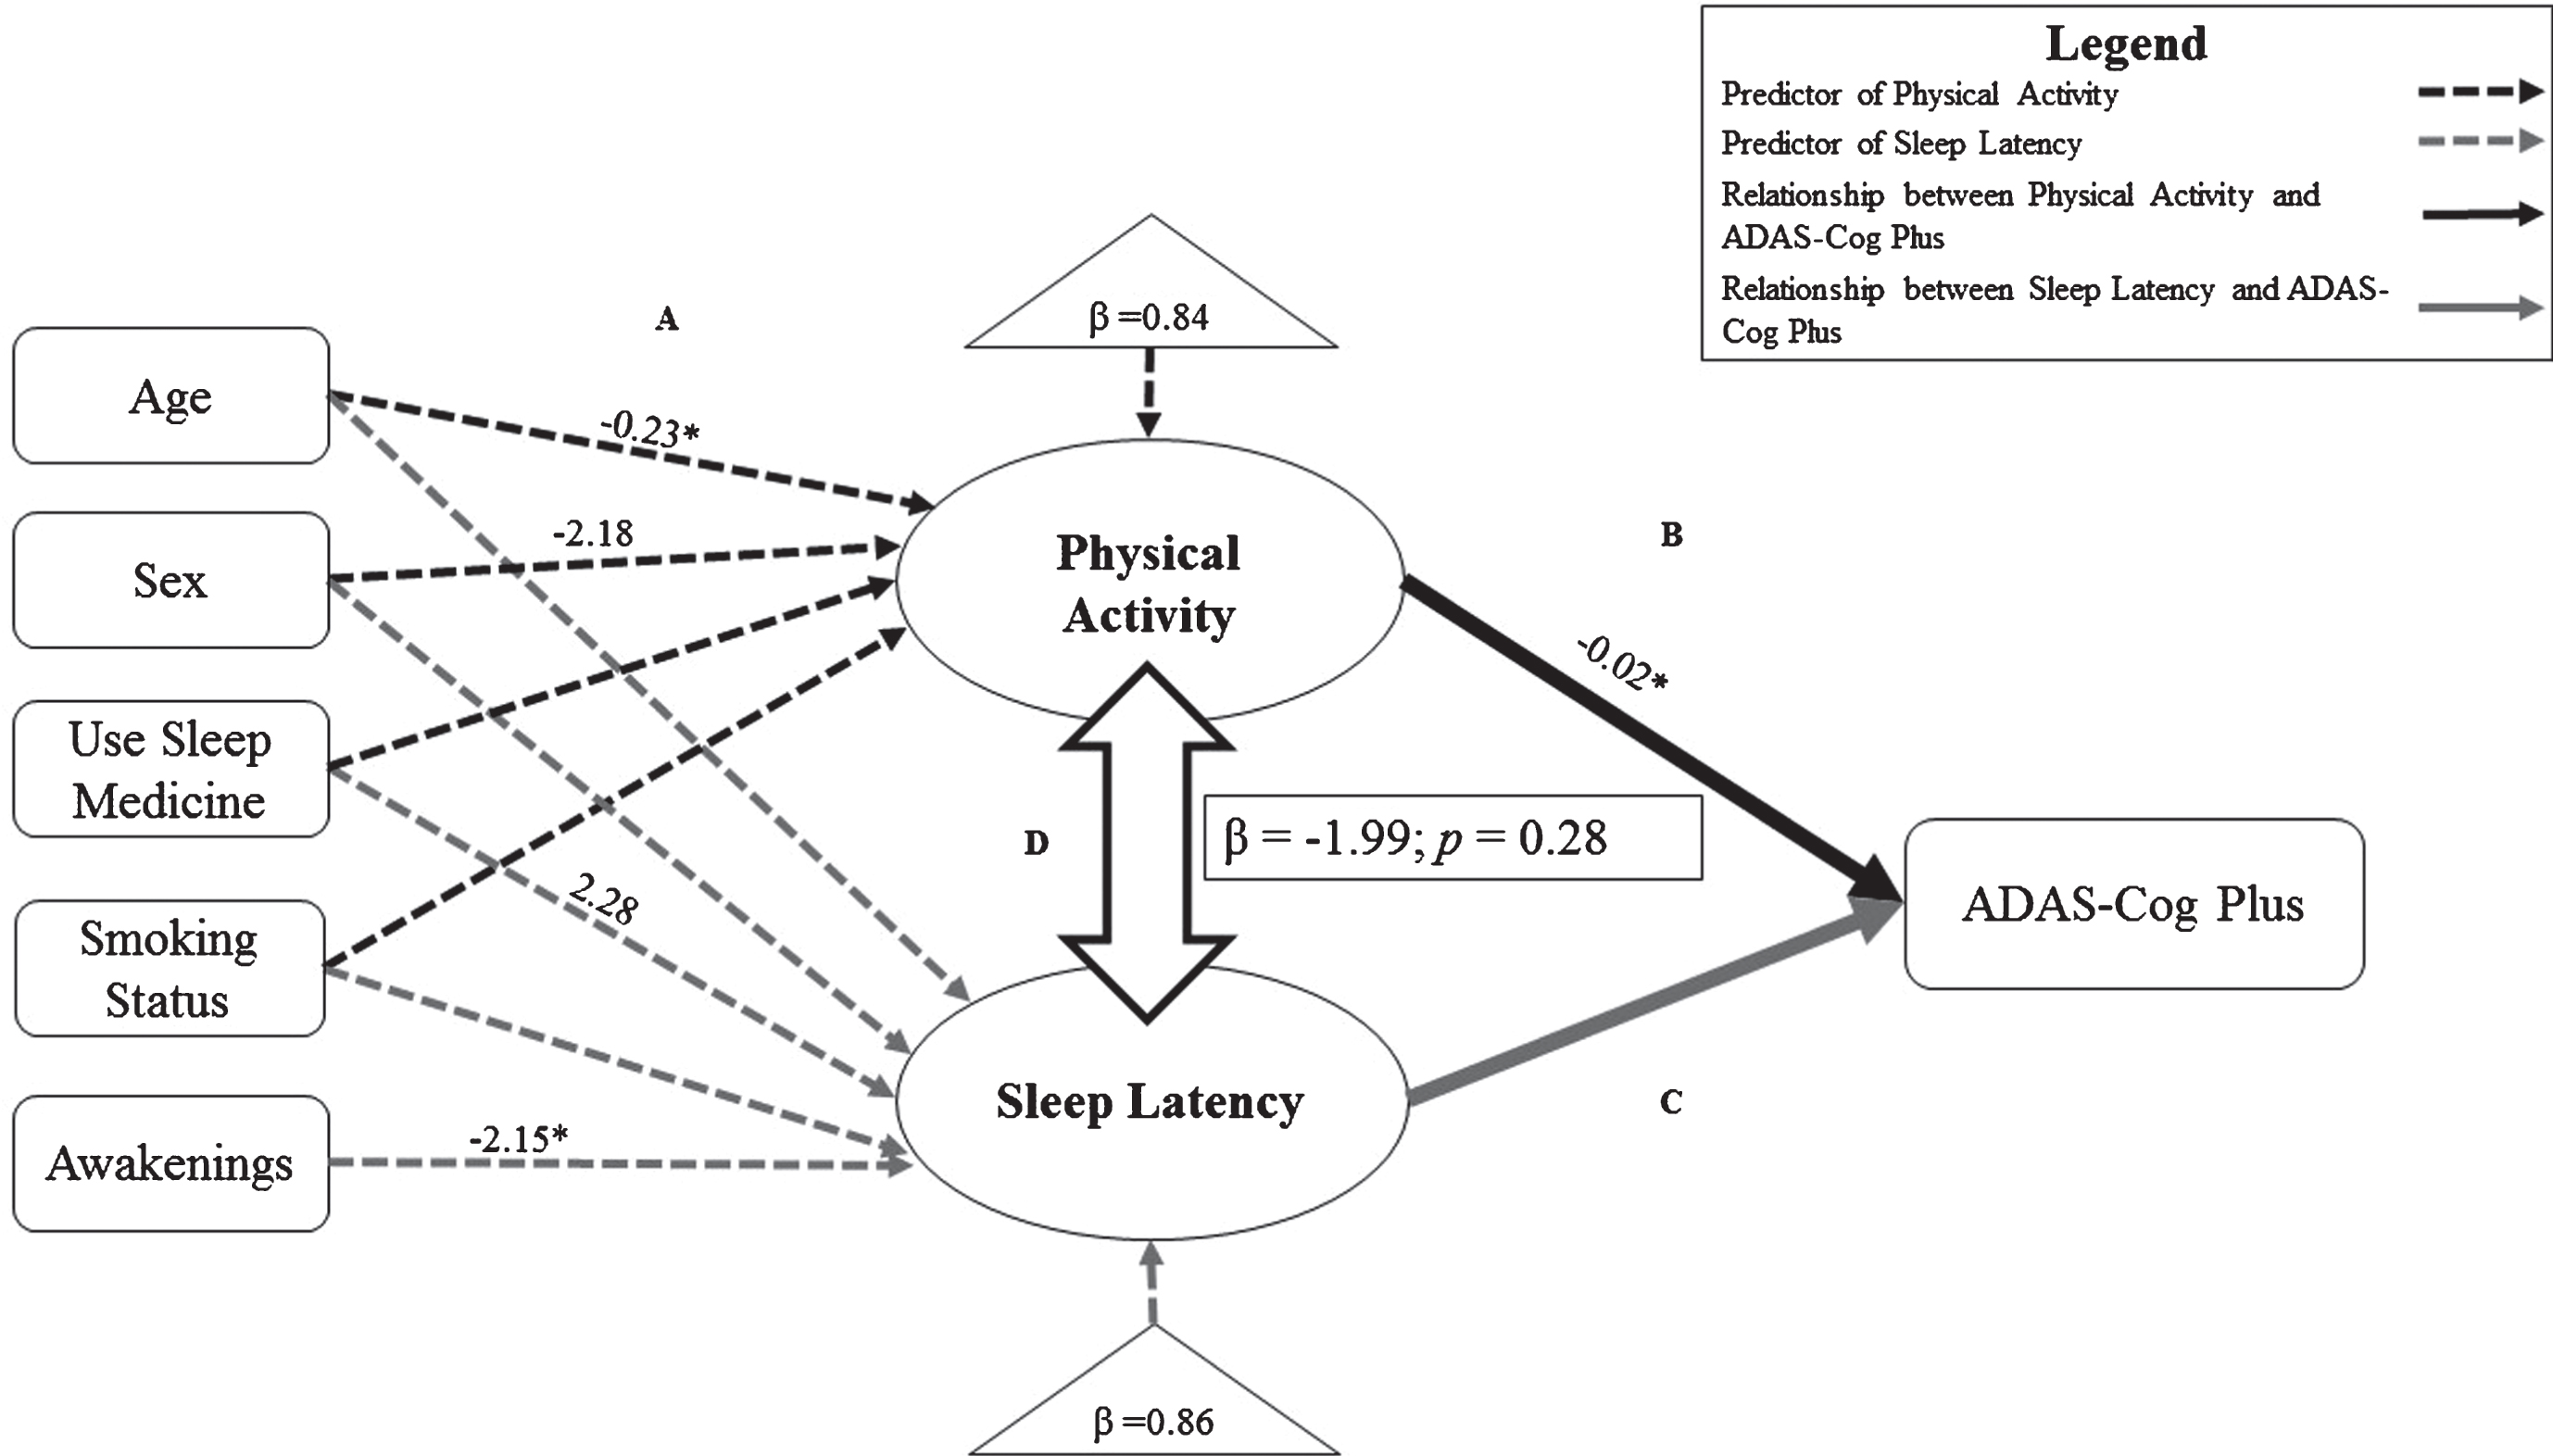
Structural equation models exploring the relationship of physical activity (PA) with sleep latency. Significant relationships and standardized estimates (p < 0.05; *p < 0.01) are displayed. Models have been simplified for clarity. Path A: Black dotted lines represent predictors of PA over 14 days. Grey dotted lines represent predictors of sleep efficiency over 14 days. Path B: Black solid line represents the relationship of PA with cognitive performance on the Alzheimer’s Disease Assessment Scale Plus (ADAS-Cog Plus); controlling for age, sex, education, and sleep efficiency. Path C: Grey solid line represents the relationship of sleep latency with cognitive performance on the ADAS-Cog Plus; controlling for age, sex, education and PA. Path D: Outlined double-arrows represent the relationship between PA and sleep latency; standardized-betas and p-values are shown in box.
DISCUSSION
Our study is the first to examine the independent contributions of PA and sleep quality towards cognitive function. Specifically, we provide evidence that PA is positively associated with older adult cognitive function independently of sleep quality and sleep quantity, and sleep efficiency is positively associated with older adult cognitive function independently of PA. Our results align with current evidence indicating the importance of PA and sleep efficiency for maintaining cognitive health [6, 76–79]. However, since we did not find any relationships between PA and sleep quality, we suggest that PA and sleep efficiency are associated with cognitive function through independent mechanisms.
The independent relationships of PA and sleep quality with cognitive function
Our study examined the association of PA with cognitive performance while controlling for different measures of sleep quality. Higher PA was associated with better cognitive performance independently of 1) subjectively measured sleep quality (i.e., PSQI); and 2) objectively measured sleep fragmentation, sleep duration, and sleep latency. Consistent with our data and prior studies [6, 7], we have previously suggested the importance of ≥150 minutes/week of PA for maintaining physical and cognitive health [80, 81]. The results of the present study bolster the recommendation that older adults engage in regular PA to optimize cognitive performance.
We found a positive association between sleep efficiency and cognitive performance. A growing body of evidence has demonstrated that better sleep efficiency is associated with better cognitive performance [76–79], while longer sleep duration is not strongly associated with better cognitive performance—particularly in older adults [78, 82]. Two potential mechanisms have been proposed to explain why sleep efficiency appears to be more important for cognitive health than total sleep time. One explanation suggests reduced sleep drive and greater sleep fragmentation can occur with longer sleep durations [83–85], while the other suggests that greater sleep efficiency increases the likelihood of progressing through sleep stages (i.e., slow-wave sleep) which benefit the prefrontal cortex [86]. Surprisingly, we found a negative relationship between sleep fragmentation and sleep duration. However, we did not perform polysomnography and thus cannot speculate on whether participants with greater sleep efficiency spent greater amounts of time in slow-wave sleep. Thus, future research will need to determine why sleep efficiency appears to be related to cognitive performance more than sleep duration.
We did not find that any other sleep measure aside from sleep efficiency was associated with cognitive performance (i.e., PSQI, sleep fragmentation, sleep duration and sleep latency). One potential explanation is the ability of PA to mitigate any cognitive detriments related to poor sleep quality due to the strong neuroprotective response to regular PA [87]. Recent cross-sectional evidence suggests PA attenuates the negative impact of poor sleep on executive function in older women [88]. Future studies should examine if the neurophysiological benefits of PA prevent poor sleep quality from impacting cognition.
The relationship of PA with sleep quality
Current epidemiological evidence consistently suggests PA is associated with better sleep quality [42]. However, most of the evidence for a relationship between PA and sleep quality comes from self-report [40, 41]. Our study provides novel information on the relationship between objectively measured PA and sleep quality—measured using both objective and subjective methods. The results of this study suggest that PA does not appear to be strongly related to older adult sleep quality.
Given the advanced age of our sample, our findings may be explained by age-related attenuation in the relationship of PA with sleep [41]. One potential reason for this apparent functional weakening in the relationship between PA and sleep is that we simply need less sleep as we age because it is a remnant of maturational processes from earlier in life [89]. In addition, there is some evidence that underlying changes in older adult neurobiology (e.g., neural atrophy, nocturnal hypoxia, neuroendocrine changes, and altered neuromodulation) may reduce the potential to impact sleep quality through strategies such as PA [90]. While our null findings for a relationship between PA and sleep suggest that there is potentially a functional weakening in the relationship between sleep and PA, this hypothesis still requires further investigation.
Our results indicate that both PA and sleep efficiency are associated with cognitive performance, but it remains unclear how PA and sleep efficiency interact to promote cognitive health. However, recent evidence suggests sleep efficiency may mediate the relationship between PA and cognitive function [76]. These results provide further support for the restoration hypothesis, which suggests that energy expenditure (i.e., PA) stimulates a restoration process whereby sleep allows the body and brain to recuperate [43]. While we did not test a mediation effect of PA and sleep efficiency, our results indicate that in addition to a potential mediation effect, it is possible that PA and sleep efficiency are associated with cognitive health through independent mechanisms.
Our findings also support the importance of measuring PA and sleep quality using both objective and subjective methods—in part because subjective measures of PA and sleep quality yield different information from objective measures [50, 51]. While the evidence for a relationship between 1) PA and cognition [7]; and 2) sleep and cognition has been consistently found using both objective and subjective methods [91], the relationship between PA and sleep quality has been described primarily using self-report data [42]. Importantly, meta-analytic data suggests PA in the form of exercise training leads to self-reported improvements in overall sleep quality, sleep latency, and sleep medication use [92]. By comparison, the authors found that exercise training led to objective improvements in time spent in stage 1 and stage 2 sleep, although only one study measured sleep quality using objective methods. PA may be related to different aspects of sleep quality—both how somebody feels about their sleep, and how they are actually sleeping. We thus cannot overstate the importance of using both objective and subjective measures of PA and sleep quality for future investigations.
Limitations and future research
This study does not account for time of day when participants engaged in PA, which may play an important role in sleep [4]. We also did not account for different types of light exposure at night, however we are unaware of any available technologies which can differentiate between different types of light (e.g., computer or television screen, reading light, or sunlight). Future research is needed to develop methods to categorize different types of light exposure, since night time light exposure can lead to sleep disruptions.
Our strict inclusion criteria for this analysis required that we omit 19 participants from being analyzed. Because structural equation modeling is based on the general linear model, which assumes the data has a normal distribution, including these data would skew the distribution of our data and increase type I error [69].
The precision of our results may have been affected by measurement error from the MW8. Indeed, previous work from our group found that MW8 measures of sleep quality were often not associated (or even inversely associated) with corresponding measures from the PSQI [51]. Although both MW8 and PSQI have evidence of validity against polysomnography [57, 63], it is plausible that measurement error in the MW8—which could lead to both overestimation and underestimation of sleep variables—may explain both our previous findings, as well as those we have described in this paper. The agreement of actigraphy with polysomnography can be low in individuals with poor sleep quality since these people tend to lie in bed motionless, but awake, for long periods of time [93].
All participants were instructed to continuously wear the watch throughout their 14 days of measurement. Based on our non-wear time estimates using the criteria of Hutto and colleagues [64], there were only two instances where participants had consecutive zero counts for greater than 120 minutes during the day. Not recording wear-time of the MW8 may have potentially impacted the precision of our results, although evidence suggests wrist-worn actigraphy has greater wearer compliance because it is more comfortable to wear during routine activities and while sleeping [94].
We used both objective and subjective measures of sleep quality (i.e., PSQI and MW8) in this study, however we did not measure PA subjectively by questionnaire. While objective measures typically provide more accurate estimates of PA, subjective measures of PA can provide important contextual information about where and how PA occurs [50]. Thus, future research examining the relationships between PA and sleep quality should therefore include both objective and subjective measures of PA and sleep quality.
We did not examine whether individual domains of cognitive function were more (or less) associated with PA and sleep. However, the ADAS-Cog Plus is a sensitive measure which can detect underlying changes in cognitive function, beyond traditional measures of global cognitive function such as MMSE and MoCA [95]. Future work should examine whether the independent associations of PA and sleep with cognitive function are domain-dependent. Finally, we have previously reported the relationship between PA and older adult cognitive function is dependent on cognitive status [81]. Briefly, older adults with mild cognitive impairment, a transition stage between healthy cognition and dementia [96], are less active than their healthy cognitive counterparts and may thus not reach a threshold level of PA to elicit a relationship between PA and cognitive function. Although 75 participants within our study showed signs of probable mild cognitive impairment (i.e., MoCA <26/30), we did not account for cognitive status within our analyses since this was an exploratory analysis and our sample size was modest. Given the relationships we found in the present study, we suggest future work should examine if the relationships we found are altered by differences in cognitive status.
Conclusion
Our results suggest PA is associated with older adult cognitive function independently of a variety of sleep measures. We also found a relationship between sleep efficiency and cognitive function independently of PA. However, our results do not suggest that PA is strongly associated with any measure of older adult sleep quality, and thus PA and sleep efficiency may be associated with cognitive performance through independent mechanisms.
Footnotes
ACKNOWLEDGMENTS
RSF is funded by the University of British Columbia Rehabilitation Sciences Scholarship, the Omer H. Patrick II Memorial Prize, and the Louise McGregor Memorial Scholarship in Neurorehabilitation. TLA is a Canada Research Chair Tier II in Physical Activity, Mobility, and Cognitive Neuroscience. Funding for this work was provided to TL-A by the Jack Brown and Family Alzheimer Research Foundation. The sponsor had no role in the design, methods, subject recruitment, data collections, analysis or preparation of this paper.