
Abstract
Background:
Mild cognitive impairment (MCI), the prodromal stage of Alzheimer’s disease, has two distinct subtypes: stable MCI (sMCI) and progressive MCI (pMCI). Early identification of the two subtypes has important clinical significance.
Objective:
We aimed to compare the cortico-striatal functional connectivity (FC) differences between the two subtypes of MCI and enhance the accuracy of differential diagnosis between sMCI and pMCI.
Methods:
We collected resting-state fMRI data from 31 pMCI patients, 41 sMCI patients, and 81 healthy controls. We chose six pairs of seed regions, including the ventral striatum inferior, ventral striatum superior, dorsal-caudal putamen, dorsal-rostral putamen, dorsal caudate, and ventral-rostral putamen and analyzed the differences in cortico-striatal FC among the three groups, additionally, the relationship between the altered FC within the MCI subtypes and cognitive function was examined.
Results:
Compared to sMCI, the pMCI patients exhibited decreased FC between the left dorsal-rostral putamen and right middle temporal gyrus, the right dorsal caudate and right inferior temporal gyrus, and the left dorsal-rostral putamen and left superior frontal gyrus. Additionally, the altered FC between the right inferior temporal gyrus and right putamen was significantly associated with episodic memory and executive function.
Conclusions:
Our study revealed common and distinct cortico-striatal FC changes in sMCIs and pMCI across different seeds; these changes were associated with cognitive function. These findings can help us understand the underlying pathophysiological mechanisms of MCI and distinguish pMCI and sMCI in the early stage potentially.
Keywords
INTRODUCTION
Alzheimer’s disease (AD), a degenerative disorder of the central nervous system, is characterized by episodic memory impairment that gradually worsens, leading to global cognitive decline and loss of everyday functional abilities. AD accounts for approximately 60–70% of patients with dementia, making it the most common cause of this condition [1]. Mild cognitive impairment (MCI), characterized by cognitive impairment that exceeds normal age-related changes but is not severe enough to significantly impact daily functioning, represents a transitional stage between normal cognitive changes associated with aging and AD onset [2]. Previous longitudinal studies have shown varied outcomes for patients with MCI. Approximately 8.3–31.4% of MCI patients progressed to AD; these patients are referred to as progressive MCI (pMCI) [3]. However, a small proportion of patients experienced improvement or recovery in cognitive function; furthermore, more than half of MCI patients do not exhibit progression even after a 10-year follow-up; these patients are classified as stable MCI(sMCI) [4].
Functional magnetic resonance imaging (fMRI) is an advanced magnetic resonance technology that can detect functional brain activation by directly measuring tissue perfusion, blood-volume changes, or changes in the concentration of oxygen [5]. Compared to conventional structural imaging, fMRI has significantly improved our understanding of brain activity and has become an essential tool in neuroimaging, offering potential as an early biomarker for neurodegenerative diseases [6]. Functional connectivity (FC) refers to the temporal dependence of neuronal activity patterns across different anatomical brain regions, focusing on the functional relationships between these regions [7]. This approach allows researchers to examine the degree of functional correlation between and within various brain networks and is being increasingly used in clinical research, including the investigation of AD [8]. Previous articles have shown that pMCI had higher pathological marker deposition, more severe brain atrophy than sMCI and performed poorer in cognitive assessments [9]. The study of FC changes and rs-fMRI in patients with sMCI and pMCI can provide valuable insights into the underlying pathophysiological mechanism of these conditions. Understanding these mechanisms can enhance the diagnosis and treatment of sMCI and pMCI.
In the past, researchers previously believed that hippocampal atrophy was the key factor in the progression of cognitive impairment. However, contemporary researchers increasingly recognize that the spectrum of AD involves multiple brain regions, with the striatum emerging as a crucial nexus in understanding cognitive changes [10]. The striatum is a critical brain region in charge of facilitating the interaction of information between the cortex, processing and integrating diverse input and output information from the neocortex, involved in various functions [11]. Based on structure and function, the striatum can be divided into ventral region and dorsal region [12]. The ventral striatum is mainly responsible for the regulation of emotions, and it is involved in the occurrence of many mental disorders such as depression [13]. In the development of AD, patients often presented with psychiatric symptoms [14]. Research about AD found that the ventral striatum was an important deposit area of amyloid-β, and this was associated with low dopaminergic activity in the ventral striatum [15]. Alterations in the function of the ventral striatum may affect the deposition and further affect the development of AD disease. The dorsal striatum, including the caudate and putamen, was primarily responsible for the motor and cognitive aspects of goal-directed behavior [16]. Early studies on Parkinson’s disease have shown that, the function of the dorsal striatum was abnormal in the early stage, and this abnormality was closely related to the decline of cognitive and motor function [17]. AD patients also show significant declines in cognitive and motor function [18]. Recent studies have found that in patients with AD and MCI, the functional connection between the putamen and caudate nucleus and the cerebral cortex was reduced, which was correlated with the decline of memory and executive function [19]. These studies showed different cortico-striatal involvements in the progression of AD spectrum disease, and suggested that the abnormality of different subregions may correspond to different clinical features in each subtype. Previous studies about the pMCI and sMCI, have compared the difference of between-network FC and whole-brain voxel-wise connectivity between the subtypes but did not find positive results in striatum region [20]. Further studies about the cortical-striatum connectivity are needed.
In this study, based on the degree of cognitive decline, the participants including healthy controls (HCs), sMCIs, and pMCIs were included in the present study. Six pairs of seed points were set in the region and dorsal striatum, then, calculated and analyzed the FC between each seed point and the cerebral cortex across the three groups. We hypothesized that there would be common and distinct changes in the cortical-striatum FC among patients with sMCI and pMCI; these changes would be associated with cognitive function, allowing us to delve into the underlying pathological mechanisms of both groups and contribute to the diagnosis and differential diagnosis of these two MCIsubtypes.
METHODS
Participants
The applied research data were extracted from the Alzheimer’s Disease Neuroimaging Initiative (ADNI) database (https://adni.loni.usc.edu/). It is a comprehensive longitudinal study designed to develop biomarkers for the early detection and monitoring of AD, including clinical, imaging, genetic, and biochemical biomarkers. rs-fMRI data from 170 participants was included in the current study, including 96 HCs and 42 patients with sMCI and with 32 pMCI. According to previous studies, in this study, we defined pMCI as diagnostic status converting from MCI to AD within 4 years, sMCI patients as diagnostic status maintaining MCI diagnosis for at least 4 years, HC subjects were included for maintaining HC diagnosis for at least 4 years [21]. Additionally, 16 participants were excluded due to excessive head motion, defined as cumulative translation or rotation > 3.0 mm or 3.0°. Consequently, the final dataset included 154 participants, consisting of 82 HC and 41 patients with sMCI and 31 with pMCI.
The cognitive functioning of all subjects was assessed using a standardized neuropsychological test battery, including the Mini-Mental State Examination (MMSE) and Montreal Cognitive Assessment (MoCA). The episodic memory function (EM) was evaluated by the composite score of MMSE, the Rey Auditory Verbal Learning Test, and the Alzheimer Disease Assessment Scale-Cognitive and Logical Memory. The executive control function (EF) was assessed by the composite score of clock drawing, WAIS-R Digit Symbol, Category Fluency, Trails A & B, and Digit Span Backwards. All neurocognitive assessments were available on the ADNI website (https://ida.loni.usc.edu/pages/ac,cess/studyData).
MRI data acquisition and preprocessing
All MRI scans were acquired using a 3.0 T scanner, following unified scanning protocols obtained from various manufacturers, including Philips (Best, The Netherlands), General Electric (Cleveland, OH, USA), and Siemens (Munich, Germany). For more detailed information regarding scanning protocols, please refer to the following resources: http://adni.loni.usc.edu/wpcontent/uploads/2010/05/ADNI2MRITrainingManualFINAL.pdfandhttp://adni.loni.usc.edu/wp-content/uploads/2017/07/ADNI3-MRI-protocols.pdf.
Functional image preprocessing
The resting-state fMRI data were preprocessed using DPABI implemented in MATLAB2013b (http://www.mathworks.com/products/matlab/). These steps are summarized as follows: first, to increase the stability of the MRI signal, we discarded the first 10 volumes, then, slice timing correction and head movement correction were performed. The subjects’ images were excluded if the translation or rotation exceeded 3 mm and 3° [22]; images, next, were spatially normalized to the MNI echo-planar imaging template and resampled to a default setting (3×3×3 mm3 voxels); to reduce the effect on the dependent variable, nuisance covariate regression such as 24 motion parameters, global signal, white matter signal, and cerebrospinal fluid signal were severally removed [23]; a 6×6×6 mm FWHM was to reduce high spatial frequency noise [24]; finally, the filtering frequency was selected at 0.01–0.08 Hz.
Functional connectivity analysis
Consistent with previous studies, seed-based FC analyses were performed using spherical regions of interest (ROIs) with a radius of 6 mm placed bilaterally within six predefined subdivisions of the striatum. These subdivisions represented the affective limbic, sensorimotor, and executive loops [25]. The affective limbic loop ROIs comprised the ventral striatum inferior (VSi) (±9, 9, –8) and the ventral striatum superior (VSs) (±10, 15, 0). The sensorimotor loop ROIs included the dorsal-caudal putamen (DCP) (±28, 1, 3) and the dorsal-rostral putamen (DRP) (±25, 8, 6). The executive loop ROIs comprised the dorsal caudate (DC) (±13, 15, 9) and the ventral-rostral putamen (VRP) (±20, 12, –3). The fMRI signal time courses were averaged across all voxels for each seed region. Next, the correlation coefficient was calculated between the averaged time course of each seed region and the time course of each voxel in the whole brain for each individual. To assess and compare the resting-state correlation maps, the correlation coefficients (r values), which were not normally distributed, were transformed into z scores using Fisher’s z transformation [26]. The resulting z maps were used in regression analyses.
Statistical analysis
Demographic and clinical information was analyzed using the Statistical Package for the Social Sciences software (version 22.0; IBM, Armonk, NY, USA). Analysis of covariance (ANCOVA) and chi-squared tests were used to compare the demographic and neurocognitive data among groups with pMCI, sMCI, and HC. Post-hoc analysis was performed using the two-sample t-test with Bonferroni’s correction (p < 0.05).
To assess the differences in cortico-striatal FC among the three groups, one-way ANOVA was performed on the standard deviation of the z values at each voxel within the gray matter union mask. The statistical thresholds were two-tailed voxel-level p < 0.001 and cluster-level p < 0.01, with Gaussian Random Field (GRF) correction applied. Age, gender, and years of education were included as nuisance covariates. Post hoc comparisons were performed using a two-sample t-test with a significance level of p < 0.05. The analysis was conducted on the mask derived from the ANOVA while controlling for the effects of age, gender, and years of education (two-tailed voxel-level p < 0.001 and cluster-level p < 0.01, GRF correction). Based on previous research, this study did not conduct Bonferroni correction for the number of seeds [19].
The receiver operating characteristic (ROC) curve and decision curve analyses (DCA) were performed to evaluate the diagnostic capability of the altered cortico-striatal FC. Delong test was used to compare AUCs, with p < 0.05 was considered statistically significant. Besides, the calibration curve (Hosmer–Lemeshow goodness of fit curve) was conducted to evaluate the calibration of models by comparing the relationship between actual probability and predicted probability.
Furthermore, the relationships among EM and EF and altered cortico-striatal FC were assessed through partial correlation analysis (Bonferroni’s correction, p < 0.05).
RESULTS
Demographic data and clinical comparisons
Table 1 presents the demographic and clinical data of all study participants. The analyzed sample consisted of 41 patients with sMCI, 31 patients with pMCI, and 82 HC. Although no significant differences were observed in sex and age among the three groups, there was a significant difference in years of education, with the HC demonstrating a significant difference compared to the pMCI and sMCI groups. Furthermore, the MCI group exhibited significant differences in cognitive performance compared to the HC. The pMCI and sMCI group demonstrated significantly lower EM, EF, MMSE, and MoCA scores compared to the HC group (Bonferroni’s post hoc correction, p < 0.05).
Demographics and clinical measures of three groups, including pMCI, sMCI, and HC
Numbers are given as means (standard deviation, SD) unless stated otherwise. Scores reflect the number of correct items unless stated otherwise. Values for age derived from ANOVA; gender from chi-square test; all clinical measures from ANOVA with age and gender as covariates. MMSE, Mini-Mental State Examination; MoCA, Montreal Cognitive Assessment; EM, episodic memory; EF, executive function; a, post-hoc analyses showed a significantly group difference between pMCI and HC; b, post-hoc analyses showed a significantly group difference between pMCI and sMCI; c, post-hoc analyses showed a significantly group difference between sMCI and HC; *, p < 0.05; **, p < 0.01;***, p < 0.001; pMCI, progressive mild cognitive impairment; sMCI, stable mild cognitive impairment; Healthy control.
Functional connectivity variability of the striatum seeds
The one-way ANOVA revealed significant differences in FC among the three groups for each striatum seed (Table 2, two-tailed voxel-level p < 0.001 and cluster-level p < 0.01, GRF corrected).
The difference of cortico-striatal functional connectivity among three groups
The x, y, z coordinates are the primary peak locations in the MNI space. Cluster size > 50 voxels in ANCOVA analysis, p < 0.05; Cluster size > 10 voxels in post hoc test, p < 0.05, TFCE-FWE corrected; L, left; R, right; pMCI, progressive mild cognitive impairment; sMCI, stable mild cognitive impairment; HC, healthy control.
Results of associations between altered functional connectivity and cognitive function. Age, gender, and years of education were used as covariates of results (Bonferroni corrected, p < 0.05). pMCI, progressive mild cognitive impairment; sMCI, stable mild cognitive impairment; EM, episodic memory; EF, executive function; R, right; L, left.
Based on the VSi seeds, the ANOVA demonstrated significant cortico-striatal FC differences in the bilateral cerebellum inferior and posterior lobes, right inferior temporal gyrus (ITG), bilateral inferior parietal lobule (IPL), right supramarginal gyrus (SG), and left superior frontal gyrus (SFG). Compared to the HC, the sMCI group exhibited significant cortico-striatal FC differences in the bilateral cerebellum inferior and posterior lobes, right ITG, bilateral IPL, and left SFG (Fig. 2); the pMCI group demonstrated increased cortico-striatal FC in the left cerebellum inferior lobe and decreased cortico-striatal FC in right SG, and left SFG (Fig. 3). Furthermore, compared to the sMCI group, the pMCI group exhibited decreased cortico-striatal FC in the left cerebellum posterior lobe (Fig. 4).

Brain regions exhibiting significant functional connectivity differences between sMCI and HC. (a) In the affective limbic network, the regions with significant cortico-striatal FC. Red: increased FC with ROI 3; brown: decreased FC with ROI3; yellow: increased FC with ROI2; blue: decreased FC with ROI2; pink: increased FC with ROI4; green: decreased FC with ROI4. (b) In sensorimotor loop network, the regions with significant cortico-striatal FC. Blue: decreased FC with ROI6; green: decreased FC with ROI8. (c) In cognitive loop network, the regions with significant cortico-striatal FC. Red: increased FC with ROI 11; brown: decreased FC with ROI11; yellow: increased FC with ROI10; blue: decreased FC with ROI10; pink: increased FC with ROI12; green: decreased FC with ROI12. pMCI, progressive mild cognitive impairment; HC, healthy control.

Brain regions exhibiting significant functional connectivity differences between pMCI and HC. (a) In the affective limbic network, the regions with significant cortico-striatal FC. Orange: increased FC with ROI1; red: increased FC with ROI3; brown: decreased FC with ROI3; yellow: increased FC with ROI2; blue: decreased FC with ROI2; pink: increased FC with ROI4; green: decreased FC with ROI4. (b) In sensorimotor loop network, the regions with significant cortico-striatal FC. yellow: increased FC with ROI6; blue: decreased FC with ROI6; pink: increased FC with ROI8; green: decreased FC with ROI8. (c) In cognitive loop network, the regions with significant cortico-striatal FC. Red: increased FC with ROI 11; yellow: increased FC with ROI9; blue: decreased FC with ROI9; pink: increased FC with ROI10; green: decreased FC with ROI10. sMCI, stable mild cognitive impairment; HC, healthy control.

Brain regions exhibiting significant functional connectivity differences between pMCI and sMCI. (a) In the affective limbic network, the regions with significant cortico-striatal FC. Blue: decreased FC with ROI2. (b) In sensorimotor loop network, the regions with significant cortico-striatal FC. Red: increased FC with ROI8; blue: decreased FC with ROI8. (c) In cognitive loop network, the regions with significant cortico-striatal FC. Blue: decreased FC with ROI9; green: decreased FC with ROI11 pMCI, progressive mild cognitive impairment; sMCI, stable mild cognitive impairment.
Based on the VSs seeds, the ANOVA revealed significant cortico-striatal FC differences in the right cerebellum inferior and anterior lobes, bilateral cerebellum posterior lobe, right cerebellum anterior lobe, left middle occipital gyrus (MOG), right middle frontal gyrus (MFG), left IPL, right brainstem, left fusiform gyrus, and right caudate nucleus. Compared to HC, the sMCI group demonstrated significant cortico-striatal FC differences in the right cerebellum inferior and anterior lobes, bilateral cerebellum posterior lobe, left MOG, right MFG, left IPL, right brainstem, left fusiform gyrus, and right caudate nucleus (Fig. 2); the pMCI group revealed increased cortico-striatal FC in the right cerebellum inferior and anterior lobes, bilateral cerebellum posterior lobe, right brainstem, left fusiform gyrus, and decreased cortico-striatal FC in the right MFG and right caudate nucleus (Fig. 3). When comparing the sMCI group to the pMCI group, no significant cortico-striatal FC differences were observed (Fig. 4).
Based on the DCP seeds, the ANOVA revealed significant cortico-striatal FC differences in the left inferior occipital gyrus (IOG) and left Insula. Compared to HC, the sMCI group demonstrated increased cortico-striatal FC in the left IOG and decreased cortico-striatal FC in the left Insula (Fig. 2); the pMCI group showed decreased cortico-striatal FC in the left insula (Fig. 3). Comparing the sMCI group to the pMCI group, no significant cortico-striatal FC differences were identified (Fig. 4).
Based on the DRP seeds, the ANOVA revealed significant cortico-striatal FC differences in the right middle temporal gyrus (MTG) and bilateral putamen. Compared to HC, the sMCI group exhibited increased cortico-striatal FC in the right MTG, right putamen and decreased cortico-striatal FC in the left putamen (Fig. 2); the pMCI group showed decreased cortico-striatal FC in the left putamen (Fig. 3). Comparing the sMCI group to the pMCI group, increased cortico-striatal FC was found in the left putamen while the decreased cortico-striatal FC was found in right MTG and right putamen (Fig. 4).
Based on the DC seeds, the ANOVA demonstrated significant cortico-striatal FC differences in the bilateral cerebellum inferior lobe, left cerebellum posterior lobe, right ITG, bilateral caudate nucleus, right MFG, left precuneus, left fusiform gyrus, right superior temporal gyrus (STG), and left MFG. Compared to HC, the sMCI group exhibited significant cortico-striatal FC differences in the bilateral cerebellum inferior lobe, left cerebellum posterior lobe, right ITG, bilateral caudate nucleus, right MFG, left precuneus, left fusiform gyrus, right STG, and left MFG (Fig. 2); the pMCI group showed significant cortico-striatal FC differences in the right caudate nucleus, right STG and left MFG (Fig. 3). Comparing the sMCI group to the pMCI group, decreased cortico-striatal FC was observed in the right ITG (Fig. 4).
Based on the VRP seeds, the ANOVA revealed significant cortico-striatal FC differences in the left cerebellum posterior and inferior lobes, left MFG, left SFG, and left MOG. Compared to HC, the sMCI group exhibited increased cortico-striatal FC in the left cerebellum inferior lobe and left MFG (Fig. 2); the pMCI group showed increased cortico-striatal FC in the left cerebellum inferior and posterior lobes, left MFG, left MOG and decreased cortico-striatal FC in the left MFG and left SFG (Fig. 3). Comparing the sMCI group to the pMCI group, decreased cortico-striatal FC was observed in the left SFG (Fig. 4).
The ROC analysis was conducted to evaluate the diagnostic value of cortico-striatal FC changes in distinguishing between the sMCI and pMCI (Fig. 5). The results showed that the model using the right putamen exhibited the best performance, with an area under the curve (AUC) of 0.973, a sensitivity of 96.77%, and a specificity of 90.24%. The DeLong test indicated that there was no significant difference in AUC between the models using the right putamen and the left putamen, but the AUC differences between the right putamen and other models were all statistically significant, p < 0.05. The calibration curves for all models demonstrated satisfactory goodness-of-fit (Fig. 6). The DCA curve further revealed that the right putamen model exhibited optimal performance (Fig. 7).

The receiver operating characteristic curve (ROC) of brain regions exhibiting significant functional connectivity differences between pMCI and sMCI. ROC curve showcasing the classification power using cortico-striatal FC changes of pMCI from sMCI. The best-fitting model for this analysis had an area under the ROC curve (AUC) of 0.973, with 96.77% sensitivity and 90.24% specificity. AUC, area under the ROC curve; ROC, receiver operating characteristic; pMCI, progressive mild cognitive impairment; sMCI, stable mild cognitive impairment.
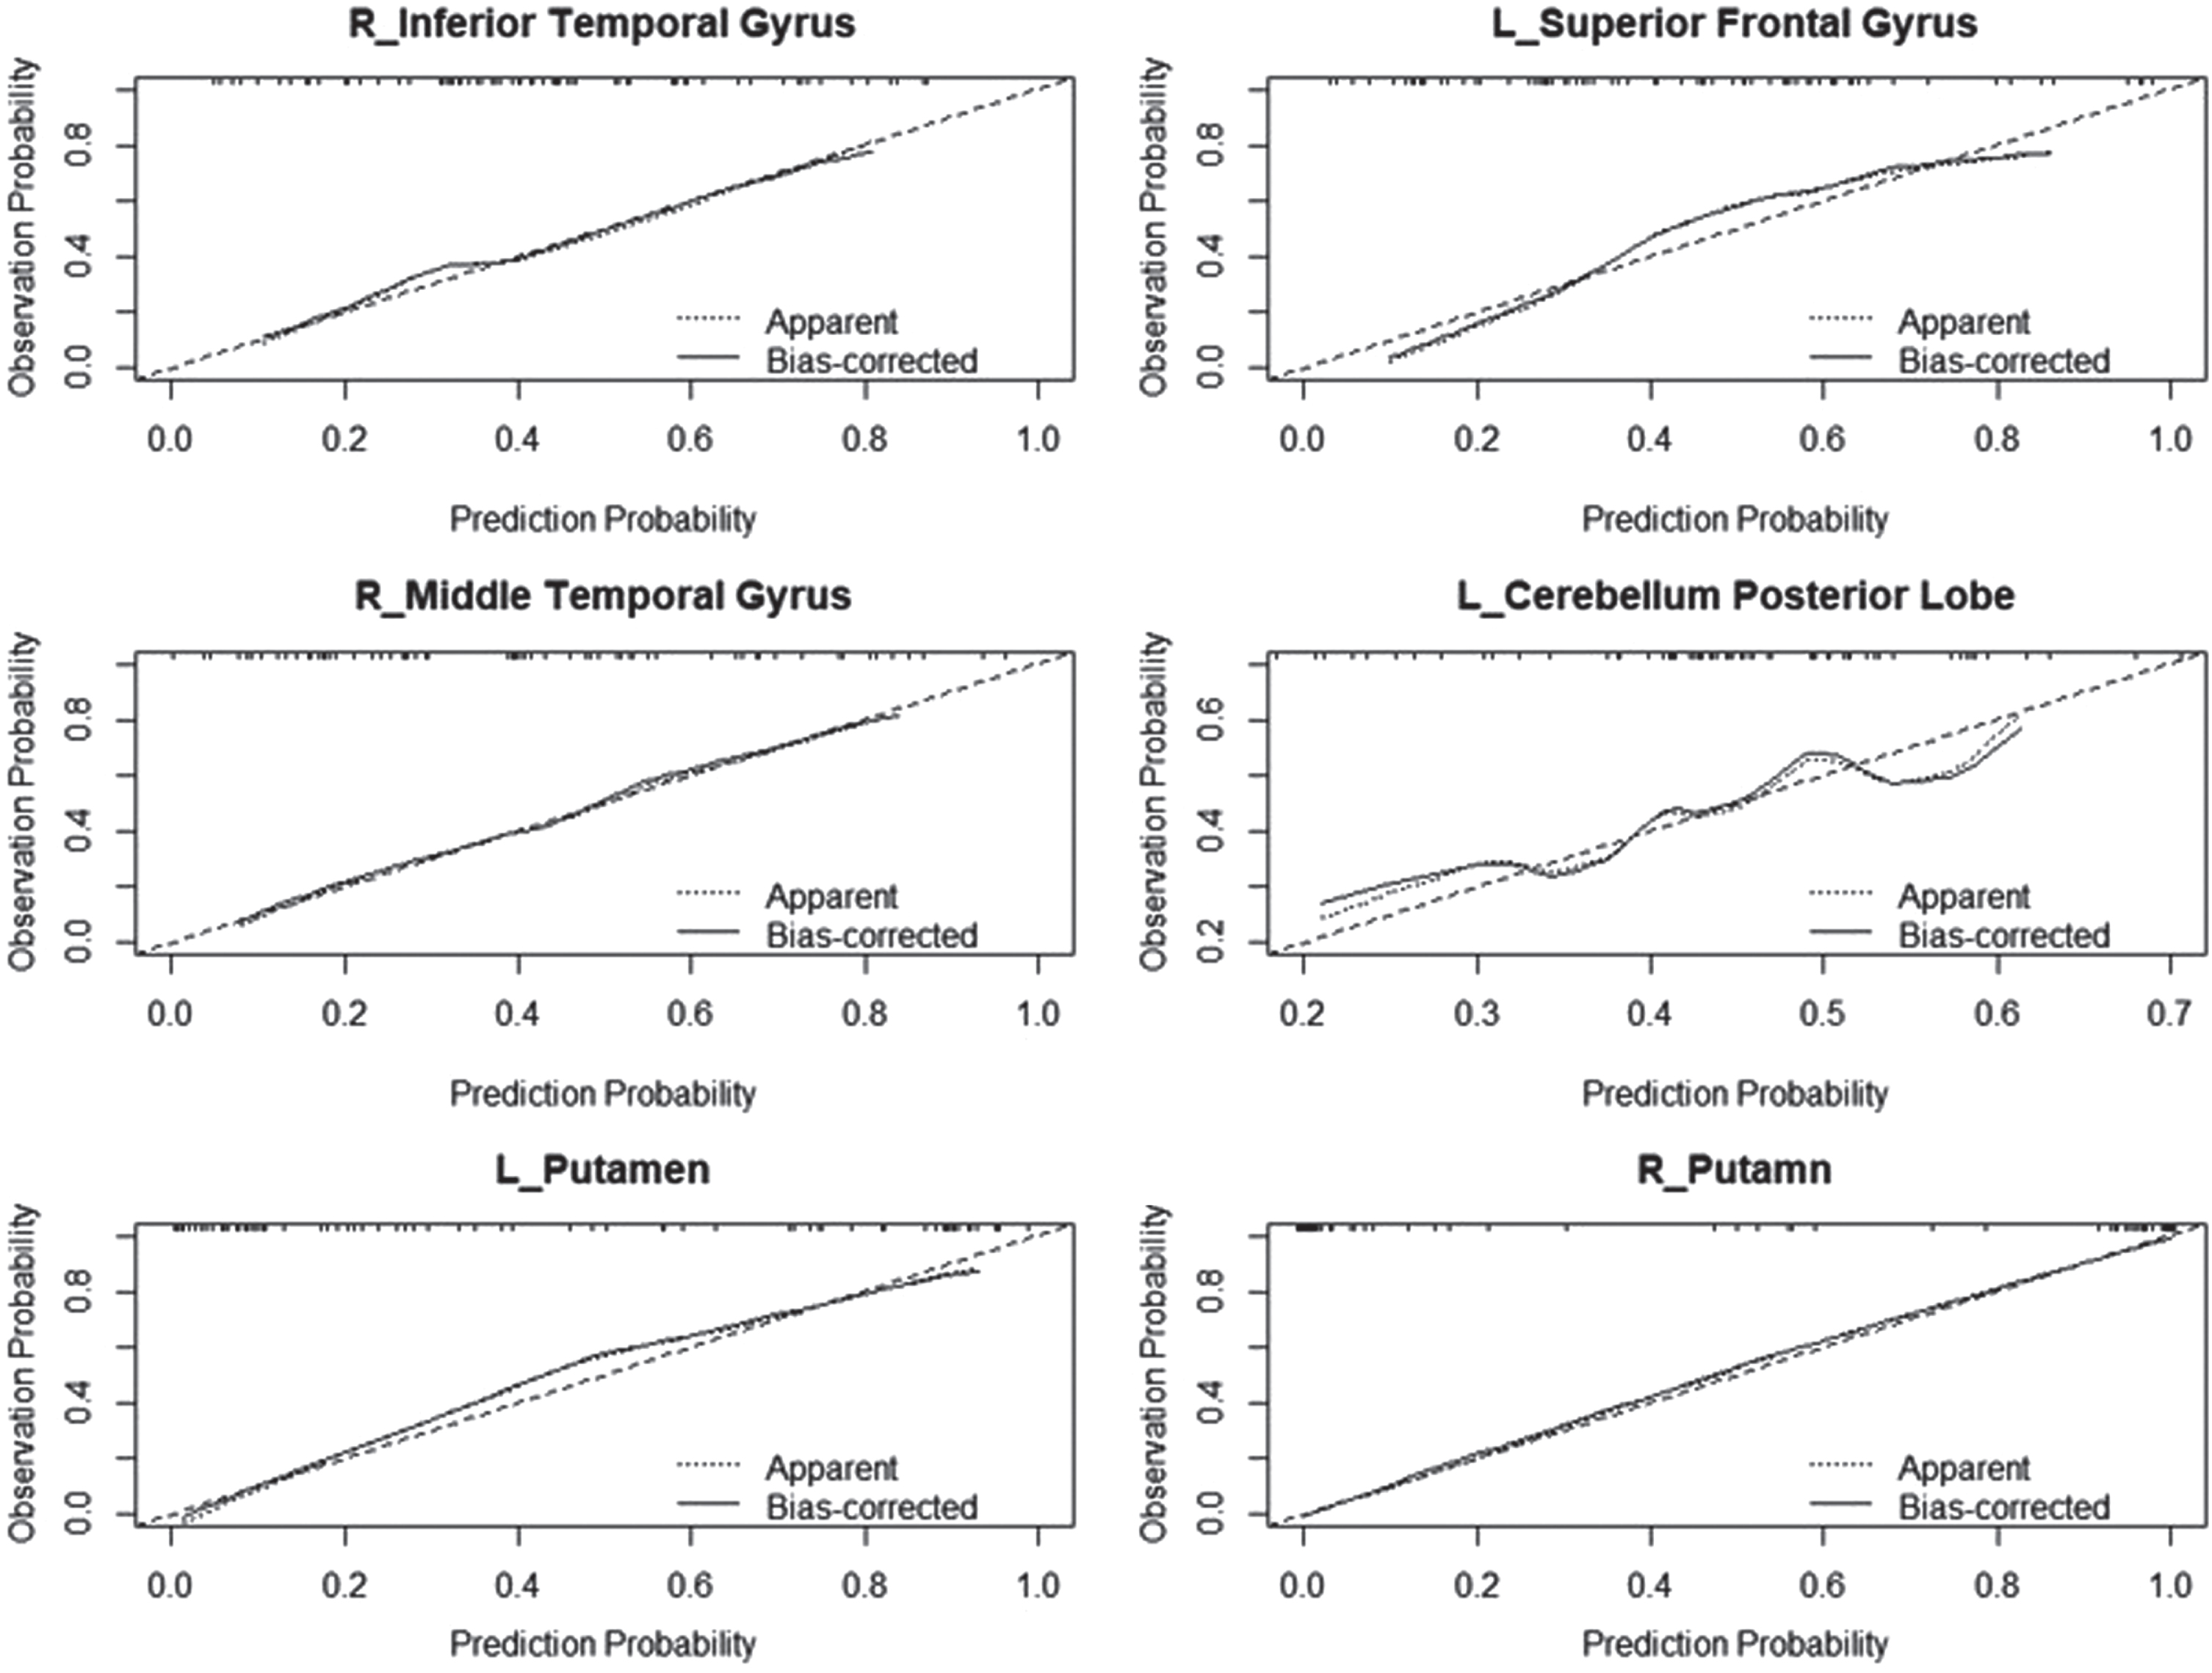
The calibration curves for pMCI in six clinical diagnostic models. The y-axis represents the actual risk of pMCI, and the x-axis represents the predicted risk of pMCI. The diagonal line represents a perfect prediction by an ideal model. The “apparent” line represents the apparent performance of the current model, while the “bias-corrected” line represents the performance of the model after 500 bootstrapping iterations. pMCI, progressive mild cognitive impairment.

The decision curve analysis curves (DCA curves) for the pMCI in six clinical diagnostic models. The y-axis represents the net benefit, and the x-axis represents the threshold probability. The grey line represents the assumption that all patients have pMCI, while the black line represents the assumption that all patients have non-pMCI. The other lines represent the performance of the six models. Red: the model with right putamen; blue: the model with left putamen; yellow: the model with left cerebellum posterior lobe; green: the model with right middle temporal gyrus; pink: the model with right inferior temporal gyrus; brown: the model with left superior frontal gyrus. pMCI, progressive mild cognitive impairment.
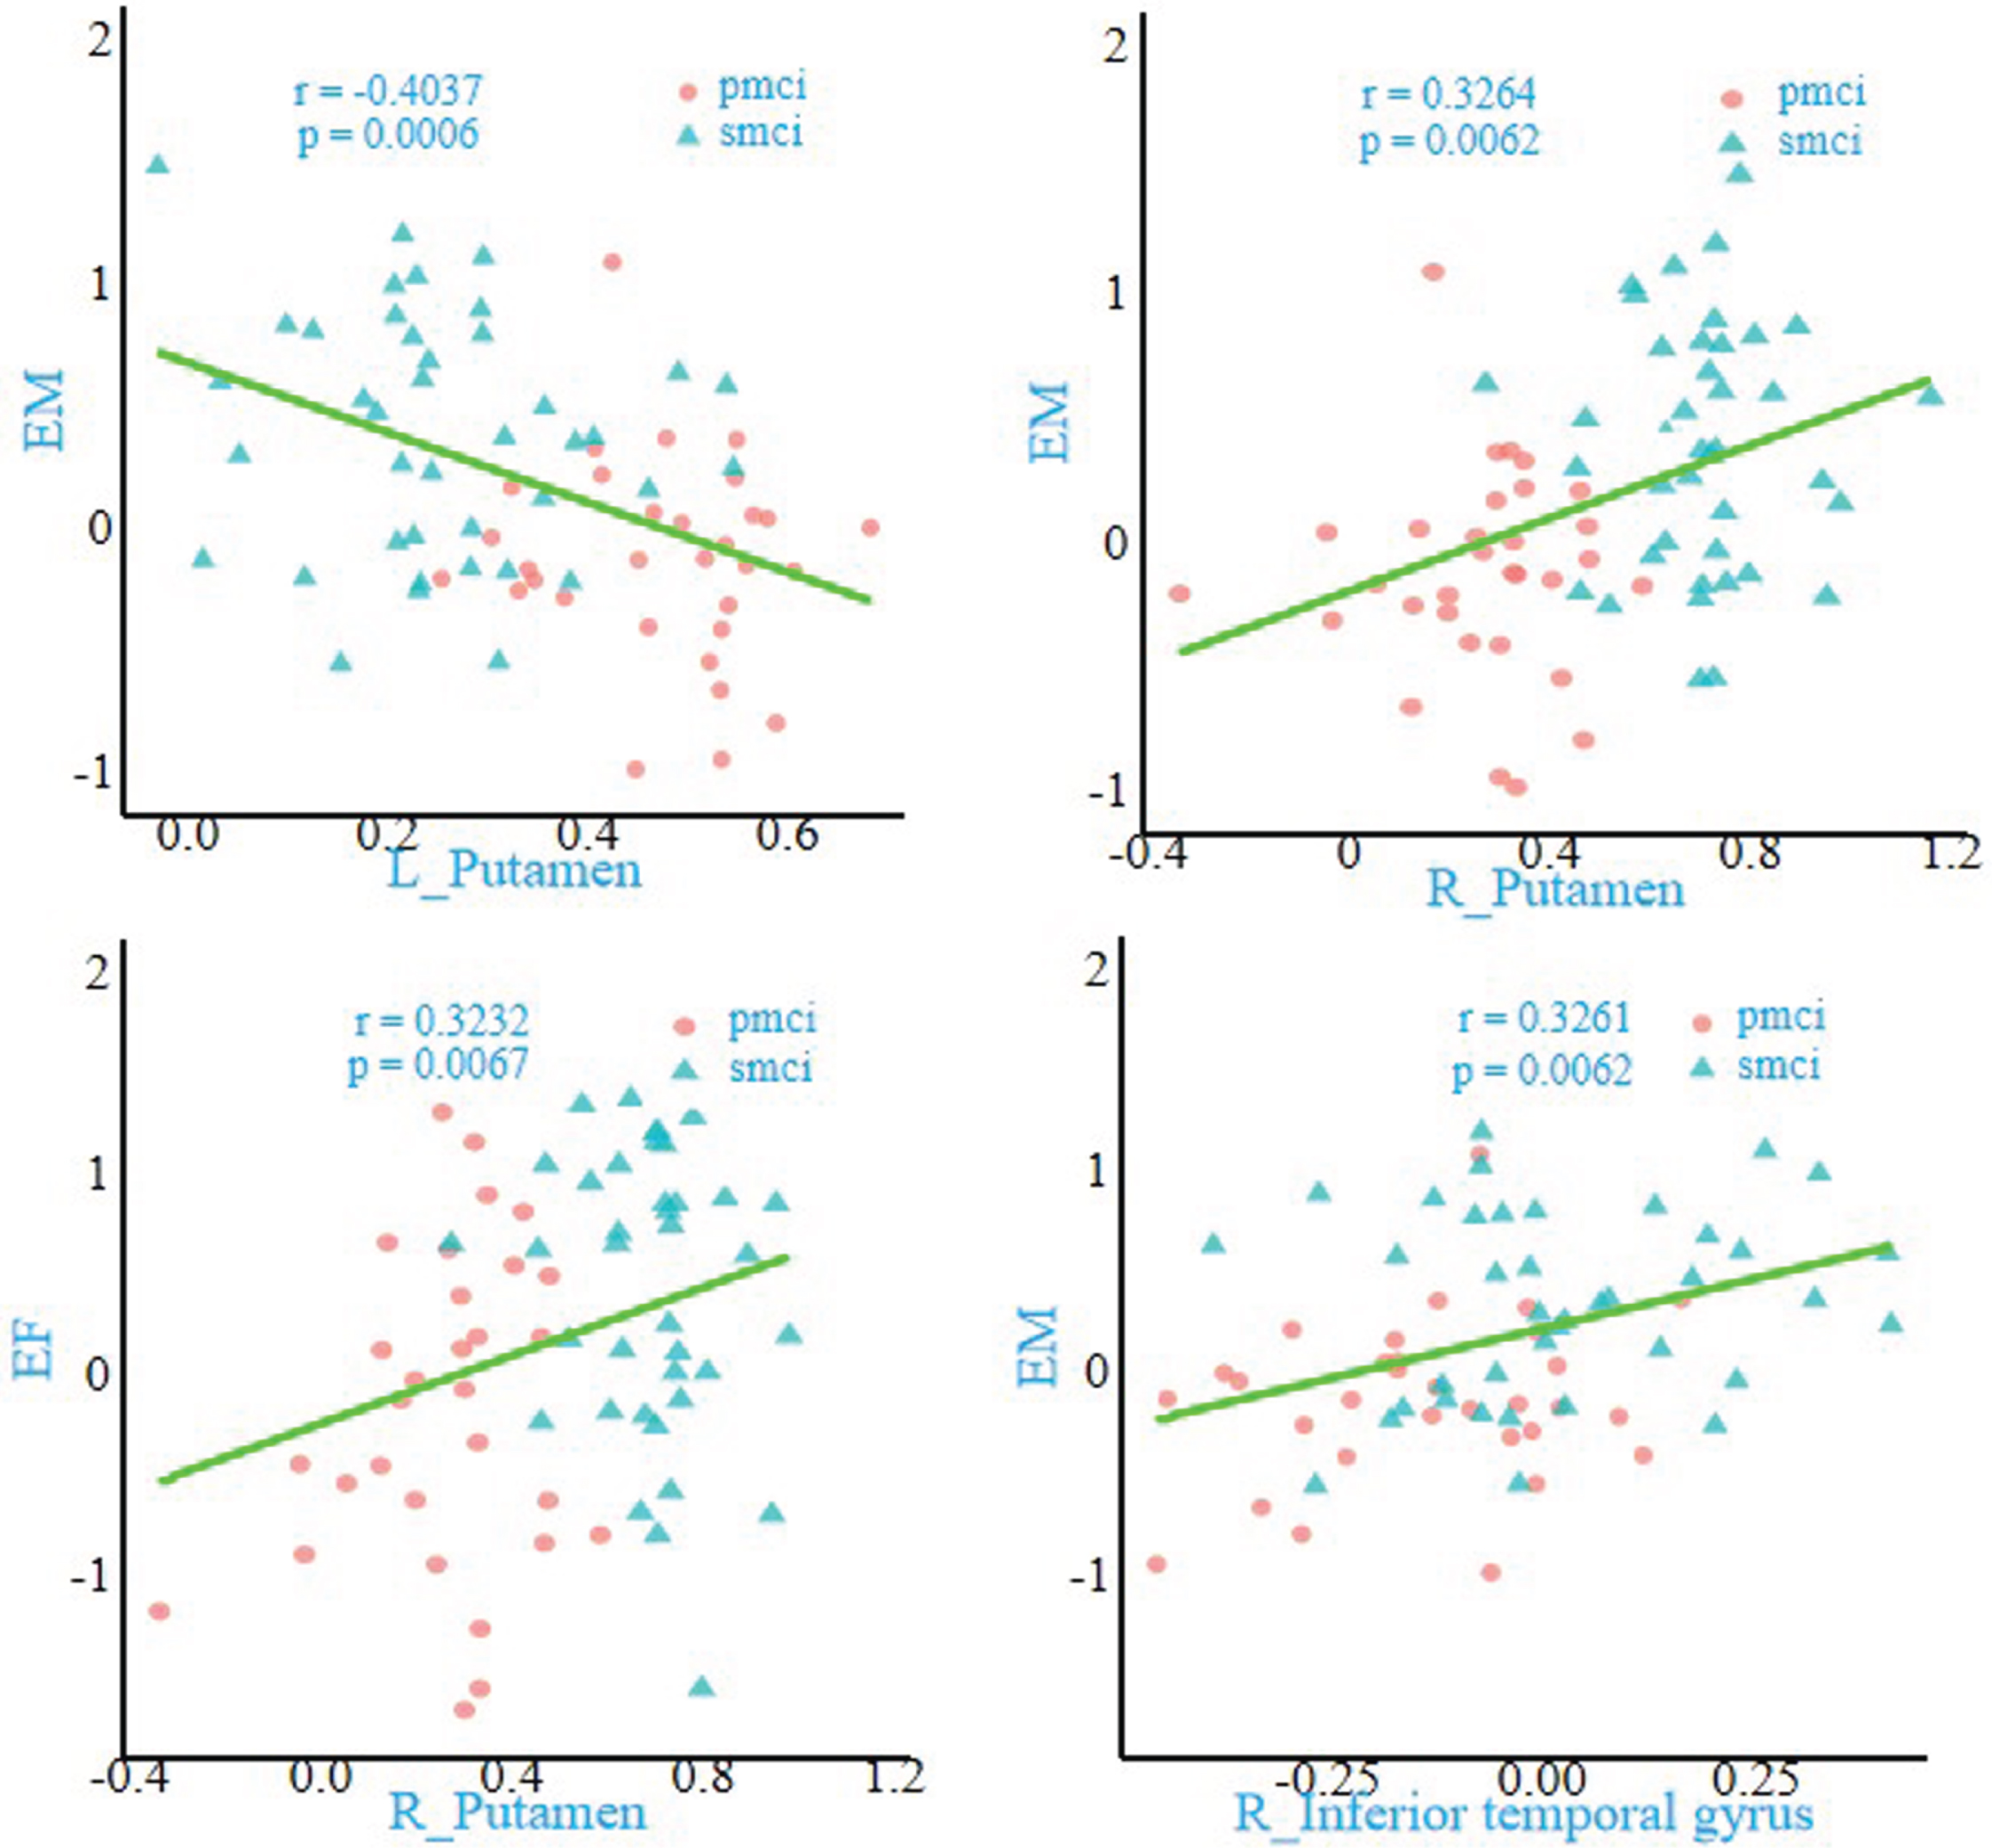
Furthermore, correlation analyses demonstrated that the altered FC in the right ITG (r = 0.3261, p = 0.0062) and the left putamen (r=–0.4037, p = 0.0006) were significantly associated with EM; similarly, the altered FC in the right putamen revealed a significant association with EM (r = 0.3264, p = 0.0062) and EF (r = 0.3232, p = 0.0067). (Bonferroni’s correction, p < 0.05, two-tailed) (Fig. 1).
DISCUSSION
This study investigated cortico-striatal FC differences between subtypes of MCI, including sMCI and pMCI, and their relationship with cognitive function. The study confirmed previous research findings that MCI patients exhibit significant alterations in FC between the cortex and different loops of striatum. Compared to the sMCI group, the pMCI group showed distinct FC patterns that demonstrated significant association with EM and EF. These findings are significant for enhancing our understanding of the pathophysiological mechanisms involved in MCI and improving the differential diagnosis between sMCI and pMCI in clinical settings.
In the affective limbic network, the study found decreased FC between the striatum and the frontal lobe and an increased FC between the striatum and IPL in sMCI and pMCI. The frontal lobe is known to be involved in long-term memory processes, whereas IPL plays an important role in short-term memory [27]. Previous studies suggested that there may be compensatory mechanisms in the IPL region, the increased FC between striatum and IPL could be interpreted as functional compensation to overcome deficits in long-term memory [28]. Similarly, the MOG, fusiform gyrus, and ITG are important components of the ventral visual system. The MOG is involved in the processing of visual information, particularly in facial recognition, whereas the fusiform and ITG are responsible for sensing changes in shape [29]. The present study demonstrated a decrease in FC between the striatum and MOG. However, the FC between the striatum and fusiform gyrus and ITG increased, it may be compensatory mechanisms used to counteract the decline in facial recognition abilities. Previous studies have demonstrated that compensatory changes in brain structural networks are associated with cognitive impairment and AD development [30]. Therefore, the observed functional compensation between networks in MCI may represent a crucial aspect of disease progression and could have important implications for understanding the course and progression of MCI. Additionally, the decreased FC between the SG and VSi in MCI patients, a part of the limbic network responsible for regulating visceral, emotional, and memory processes, may explain the observed indifferent emotional states in some MCI patients [31]. One intriguing finding in the study was the distinct pattern of FC changes observed between VSi and VSs. The altered FC in VSi primarily involved limbic areas, suggesting their involvement in emotional regulation, whereas altered FC in VSs was predominantly associated with cognitive control and visual memory. Previous studies have shown a progressive change in the FC of the caudate nucleus along its dorsal-to-ventral axis; in individuals with VSi, these changes were primarily observed in limbic areas, whereas, in individuals with VSs, these changes involved cognitive control and limbic areas [25]. Therefore, the differences in FC changes between the VSi and VSs in MCI align with their respective physiological functions. Furthermore, we hypothesized that changes in the FC of the striatum could be a manifestation of weakened functional distribution, which may contribute to the cognitive dysfunction observed in MCI patients and provide valuable insights into the underlying FC changes in this condition.
The FC changes observed in the sensorimotor loop were relatively fewer compared to those observed in the affective limbic loop. The study has demonstrated FC changes between the left IOG, left Insula and DCP seeds, right MTG, bilateral putamen, and the DRP seeds in MCI patients. The Insula, an important component of the salience network, plays a vital role in various cognitive functions, including cognitive control and emotional and sensorimotor processing. Although previous studies on AD and MCI have reported structural and functional changes in the insula among AD-MCI patients, no unified conclusion regarding its pathological mechanism is observed. Multiple studies have demonstrated that the changes in the insula may reflect a communication deficit, whereas others have proposed associations with memory maintenance [32]. In the research, the changes in the insula were primarily associated with the sensorimotor network, indicating a close relationship between insula changes and motor function decline in MCI patients. The reduced FC between the insula and striatum insula plays a significant role in the pathogenesis of MCI and may serve as a valuable tool for early identification and diagnosis. We identified pronounced hemispheric asymmetry in the sensorimotor loop changes among MCI patients. Compared to HCs, significant cortico-striatal FC changes existed in the left sensorimotor loop but not in the right loop. Several previous studies about MCI have focused on investigating FC within individual cerebral hemispheres, which may have overlooked abnormal activity and connectivity between hemispheres in AD. However, recent studies have suggested that bilateral hemisphere activity imbalance and lateralization may be associated with the severity and progression of AD [21]. Our findings provide supportive evidence that hemispheric imbalance may contribute to AD progression, thereby offering valuable insights into the pathological mechanisms underlying MCI.
In the cognitive loop, the obvious FC changes in MCI patients involved brain regions associated with visual and default mode networks (DMN). These findings are consistent with cognitive function formation, where cognition relies on visual information and involves multi-network coordination with DMN at its core. The visual system interacts with higher cognitive functions from the beginning of visual stimulation, indicating a top-down modulation [33]. Multiple studies on MCI and AD have also shown that changes in the default network are often accompanied by alterations in the visual network [34]. Therefore, we believe that monitoring the FC changes in the visual network holds significant potential for facilitating early diagnosis of MCI. The study also observed increased FC between the DC and precuneus in the sMCI group compared to HCs. The precuneus, as a part of DMN, plays a vital role in cognition and has been emphasized as a key area affected by memory impairment in early AD [35]. Previous studies on AD-MCI have shown decreased FC between the mid-striatum and precuneus in AD patients [19]. The differences between sMCI and pMCI may explain distinct outcomes observed in MCI subtypes. In the initial stages of cognitive impairment, compared to pMCI patients, patients with sMCI exhibit more stable precuneus functionality, allowing them to maintain cognitive stability through enhanced FC between the striatum and precuneus. The impairment of precuneus function in pMCI contributes to the development of AD. Therefore, monitoring the status of FC changes between the striatum and precuneus holds great significance in the differential diagnosis of the two MCI subtypes and the evaluation of prognosis for MCI patients. Lastly, the study revealed increasing and decreasing patterns of FC between cognitive loop seeds and the frontal lobe in sMCI and pMCI. A previous study also found the coexistence of increase and decrease FC in frontal lobe and thought it as functional disconnection and compensation [36]. This finding suggested that frontal lobe function is impaired in the early stages of MCI might provide insights into biological mechanism of the disease.
In the past, the cerebellum was primarily associated with motor planning and execution. However, recent research has highlighted its involvement in cognition as well [37]. Over the past 25 years, studies have shown that the sagittal representation of the cerebellum involves motor functions in the anterior lobe, followed by the premotor network, the executive control-associated network, and the default network [38]. Furthermore, functional differences between the left and right cerebellar lobes have been observed; the right cerebellum is more involved in language control, whereas the corresponding left cerebellum, with its compact connections to prefrontal, parietal, and subcortical brain regions, plays a more significant role in cognitive control [37]. Our study demonstrated significant changes in cerebellar-striatum FC. Consistent with previous studies, these changes were observed in the expressive limbic and associative cognitive circuits. The FC between the left posterior cerebellar lobe and the VSs and the left posterior cerebellar lobe and the DC decreased, conversely, the FC between the striatum and other cerebellar regions increased. The left posterior cerebellar lobe is closely associated with cognitive function; its functional decline is essential for cognitive impairment. The findings confirmed that the cerebellum plays an important role in cognitive function changes, offering valuable insights into the broader perspective of brain function changes observed in patients with MCI.
Significant differences in cortico-striatal FC between pMCI and sMCI patients were observed. These two subtypes of MCI have distinct clinical outcomes, with pMCI progressing to AD in the short term, while sMCI remains stable for a more extended period. Previous studies have indicated that the pathological characteristics of pMCI are more similar to those of AD, whereas those of sMCI are closer to those of HC [39]. However, the differences between the sMCI and pMCI are less prominent than those between HC and AD. We examined cortico-striatal FC in three functional circuits and found that pMCI patients exhibited significantly decreased cortico-striatal FC compared to sMCI patients. This finding supports the notion that pMCI is associated with more severe brain injury, which is consistent with the underlying pathological mechanisms of pMCI and partially explains the rapid progression to AD in pMCI. The present study constructed diagnostic models based on changes in cortico-striatal FC, and all models demonstrated sufficient goodness-of-fit. ROC curve analysis and decision curve analysis revealed that the model incorporating the right putamen exhibited the best performance. Previous studies demonstrated that the putamen volume is significantly reduced in AD patients, the reduction in left putamen correlates with impaired global cognitive performance in AD obviously and the right putamen had strong remaining correlations with cognitive test scores [40]. Additionally, another study emphasized the critical role of DNA oxidative damage in the putamen for the survival of AD patients [41]. These findings indicated a structural and pathological basis for putamen changes in AD patients and suggested the crucial role of putamen in the progression of AD spectrum disease. Our study found a decreased FC between the left and right putamen in pMCI compared to sMCI. This suggested functional changes in the putamen during early stage of AD progression, leading to disrupted connectivity between the bilateral putamen. And that can explain why the two subtypes of MCI have distinct clinical outcomes very well. The correlation analysis confirmed the association between the putamen FC changes and impaired cognitive performance. And by building clinical diagnostic model, we confirmed the crucial role of the decreased FC between right putamen and left DRP in discriminating between sMCI and pMCI. These verified the potential involvement of the putamen in the processes of sMCI and pMCI and provided a powerful help for our clinical diagnosis work. Interestingly, in the present study, the FC within the left striatum increased, which was considered as an internal compensatory mechanism. The changes in FC within the putamen partially explain diverse outcomes observed in different subtypes of MCI. Moreover, our findings emphasize the unique advantages of studying cortico-striatal FC in understanding the underlying pathological mechanism of these diseases. The results of our study hold significant implications for early clinical diagnosis.
Conclusion
Our study has revealed significant differences in cortico-striatal FC between sMCI patients and pMCI patients across all striatal loops, particularly in EM and EF. These distinct patterns of cortico-striatal FC alterations between pMCI and sMCI provide valuable insights into the underlying pathophysiological mechanism of MCI. Moreover, these findings can potentially distinguish pMCI and sMCI in the early stage.
Limitation
There were several limitations in the current study. First, the sample size of patients was small, which may have made the results less generalizable. In addition, the ADNI database was still being updated, which means we will increase the sample size in the future. Second, the HC group showed significant difference in years of education with the pMCI and sMCI group. So as to deal with this problem, all our results treat years of education as a nuisance covariate.
AUTHOR CONTRIBUTIONS
Yiming Ruan (Conceptualization; Data curation; Methodology; Software; Validation; Visualization; Writing – original draft; Writing – review & editing); Darui Zheng (Data curation; Formal analysis; Software; Validation; Visualization); Wenxuan Guo (Conceptualization; Data curation; Methodology; Visualization); Xuan Cao (Software; Visualization); Wenzhang Qi (Conceptualization; Formal analysis; Methodology; Validation); Qianqian Yuan (Conceptualization; Formal analysis; Investigation; Methodology); Xulian Zhang (Formal analysis; Software; Validation); Xuhong Liang (Conceptualization; Investigation; Methodology; Software; Visualization); Da Zhang (Conceptualization; Investigation; Methodology); Chen Xue (Conceptualization; Formal analysis; Investigation; Methodology; Supervision; Validation; Writing – original draft; Writing – review & editing); Chaoyong Xiao (Conceptualization; Methodology; Supervision; Validation; Writing – review & editing).
Footnotes
ACKNOWLEDGMENTS
Data collection and sharing for this project was funded by the Alzheimer’s Disease Neuroimaging Initiative (ADNI; National Institutes of Health Grant U01 AG024904) and DOD ADNI (Department of Defense award number W81XWH-12-2-0012). ADNI is funded by the National Institute on Aging, the National Institute of Biomedical Imaging and Bioengineering, and through generous contributions from the following: AbbVie; Alzheimer’s Association; Alzheimer’s Drug Discovery Foundation; Araclon Biotech; BioClinica, Inc.; Biogen; Bristol-Myers Squibb Company; CereSpir, Inc.; Cogstate; Eisai Inc.; Elan Pharmaceuticals, Inc.; Eli Lilly and Company; EuroImmun; F. Hoffmann-La Roche Ltd. and its affiliated company Genentech, Inc.; Fujirebio; GE Healthcare; IXICO Ltd.; Janssen Alzheimer Immunotherapy Research & Development, LLC.; Johnson & Johnson Pharmaceutical Research & Development LLC.; Lumosity; Lundbeck; Merck & Co., Inc.; Meso Scale Diagnostics, LLC.; NeuroRx Research; Neurotrack Technologies; Novartis Pharmaceuticals Corporation; Pfizer Inc.; Piramal Imaging; Servier; Takeda Pharmaceutical Company; and Transition Therapeutics. The Canadian Institutes of Health Research is providing funds to support ADNI clinical sites in Canada. Private sector contributions are facilitated by the Foundation for the National Institutes of Health (![]() ). The grantee organization is the Northern California Institute for Research and Education, and the study is coordinated by the Alzheimer’s Therapeutic Research Institute at the University of Southern California. ADNI data are disseminated by the Laboratory for NeuroImaging at the University of Southern California.
). The grantee organization is the Northern California Institute for Research and Education, and the study is coordinated by the Alzheimer’s Therapeutic Research Institute at the University of Southern California. ADNI data are disseminated by the Laboratory for NeuroImaging at the University of Southern California.
FUNDING
The authors have no funding to report.
CONFLICT OF INTEREST
The authors have no conflict of interest to report.