
Abstract
Background:
Numerous studies have reported on cerebrospinal fluid (CSF) and blood biomarkers of Alzheimer’s disease (AD); however, to date, none has compared biomarker patterns across the early-onset subtypes, i.e., early onset sporadic AD (EOsAD) and autosomal dominant AD (ADAD), qualitatively and quantitatively.
Objective:
To compare the fluid biomarker patterns in early-onset subtypes of AD; EOsAD and ADAD.
Methods:
Six scientific databases were searched for peer-reviewed research publications. The total number of individuals used in all the meta-analysis were 2,427, comprised of 1,337 patients and 1,090 controls.
Results:
In the subset of EOsAD cases without APP, PSEN1/PSEN2 mutations, CSF Aβ42 and tau levels were higher when compared to the EOsAD group as a whole. Prevalence of the APOE ɛ4 allele was more elevated in EOsAD relative to controls, and not significantly elevated in ADAD cases.
Conclusion:
Established CSF biomarkers confirmed quantitative differences between variants of EOAD. EOsAD is enriched with APOE ɛ4, but the level is not higher than generally reported in late-onset AD. The results prompt further exploration of the etiopathogenesis of EOsAD, which accounts for ∼4–10% of all AD cases, but the reasons for the early onset remain poorly understood.
INTRODUCTION
Despite intensive research over the last two decades, no reliable treatment exists to reverse or impede the onset and progression of Alzheimer’s disease (AD), which is usually sub-categorized into two subtypes based on the age of onset: early onset AD (EOAD) and late-onset AD (LOAD), with age 65 years as the generally accepted cut-off [1]. EOAD accounts for only 5% –10% of all AD cases [2], with <1% being attributed to autosomal dominant AD (ADAD), caused by mutations in one of three genes: amyloid precursor protein (APP), presenilin 1 (PSEN1), and presenilin 2 (PSEN2). ADAD cases have 100% penetrance of a known genetic mutation, with predictable age of symptom onset, and therefore presymptomatic individuals can be studied several years before symptom onset. ADAD cases generally represent a “purer” version of AD with fewer concomitant pathologies and hence confounding variables [3]. Whereas, early onset sporadic AD (EOsAD) is rarely studied in its own right and is, therefore, a particularly important subset as it presents an opportunity to either discover new lifestyle risk factors or explore novel mutations responsible for the earlier age of onset. Genetic variations, in particular that of the Apolipoprotein E (APOE) gene, play a significant role in LOAD but are poorly understood in EOsAD. ADAD and EOsAD can be similar pathologically and phenotypically, with the primary distinction being the presence of autosomal dominant mutation in the former and possibly risk genes and environmental/lifestyle factors in the latter. However, there are several reasons why biomarkers may differ for the two disorders: 1) That they are pathologically similar does not imply that the pathology is exactly the same. Considering the difference in etiology, it is possible that there are subtle differences in the pathology, e.g., the relative amyloid and tau burden, the degree of inflammation, oxidative stress, and synaptic loss, which may be reflected in quantitative differences in biomarkers; 2) There are good reasons to believe that over-production of amyloid-β42 is an earlier and defining feature of ADAD pathophysiology, but one could argue that this may not be the central disturbance in EOsAD, which would be reflected in the biomarkers, in particular Aβ levels; and 3) The rate of development and progression of pathology is different in the two disorders such that at a particular stage of the disease (as identified by cognitive deficits), the biomarkers may differ quantitatively. We therefore started with the hypothesis that the biomarkers would be different. However, had we set up a null hypothesis, i.e., there would be no difference in the biomarkers for the two disorders at the similar levels of cognitive deficit, our methodology or conclusions would not have been different.
The failure of numerous clinical trials suggests that a focus on presymptomatic biomarkers with a view to prevention may be a better option than treatment once pathology has significantly progressed.
Absence of comparative studies reporting pathological and phenotypical difference/s in ADAD and EOsAD makes it difficult to know whether there are qualitatively or quantitatively similar or different biomarker patterns in these genetically different AD subtypes. We therefore performed a systematic review and meta-analysis on variants of EOAD to examine the shared as well as unique factors that influence subtypes of EOAD.
METHODS
Search strategy
This systematic review and meta-analysis followed Preferred Reporting Items in PRISMA guidelines [4] and Strengthening the Reporting of Observational Studies in Epidemiology (STROBE) guidelines [5]. Literature searches were performed for papers published between January 1, 1988, and June 1, 2019, using six major scientific databases: Medline Ovid, PubMed, EMBASE, PsycINFO, Web of Science, and Scopus (Fig. 1, Supplementary Tables 2 and 3).
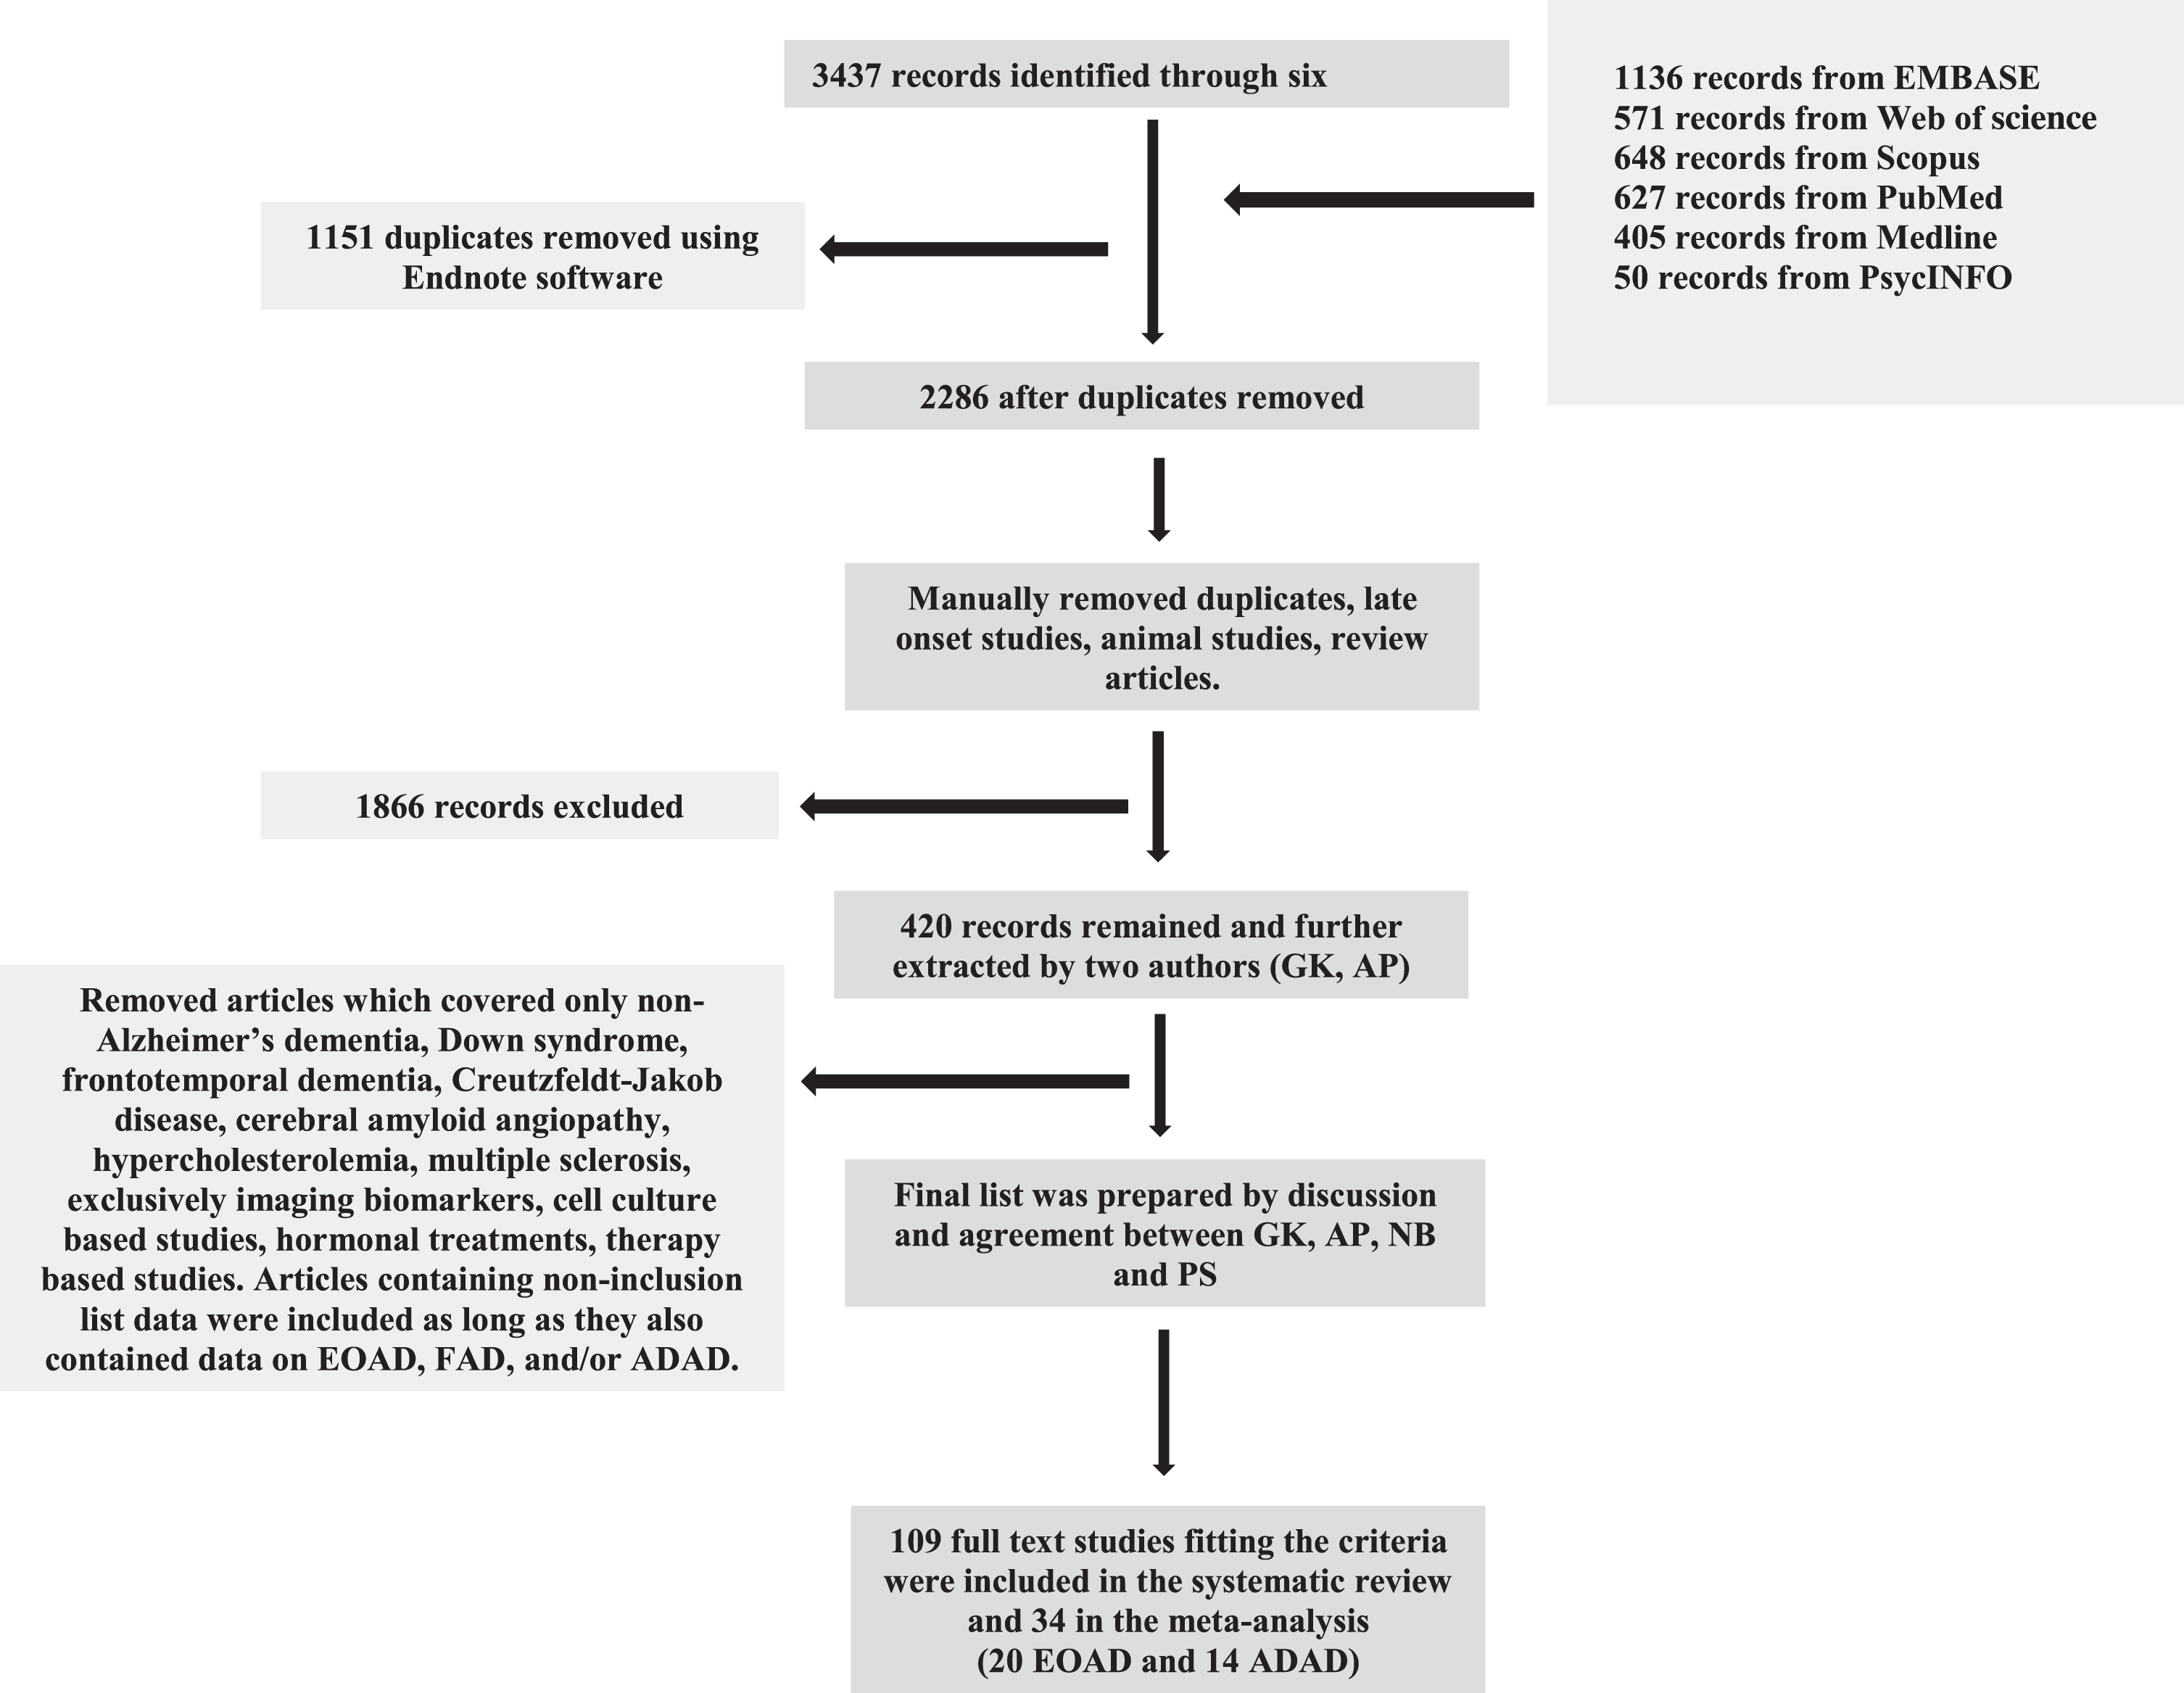
Flow chart depicting the selection process of records found using six scientific databases and elimination of non-relevant articles.
Data extraction
Inclusion/Exclusion criteria
Included in the review were papers reporting on quantified biomarkers (proteins/peptides) in cerebrospinal fluid (CSF) and/or blood (serum or plasma) in patients with EOsAD or ADAD and corresponding controls. These searches included combinations of the following Boolean terms: [blood OR serum OR plasma OR cerebrospinal fluid OR CSF] AND [autosomal dominant OR dominant inheritance OR early onset OR young-onset Alzheimer’s disease] and were run in all six databases. Exclusion criteria were: 1) studies purely on LOAD or on any AD subtype with biomarker data on tissues other than blood, serum, plasma, or CSF, studies reporting purely on non-protein biomarkers such as mRNA (Q-PCR) or studies which use non-quantitative observations (e.g., SDS-PAGE without identifying or quantifying specific protein changes); 2) studies purely on animal models, cell culture techniques, immunohistochemistry, genotyping, imaging (PET, FDG), laboratory tests such as blood cell counts, and identification of biomarkers from cellular blood fractions such as peripheral blood cells; 3) articles reporting data following treatment, therapy, intervention, toxicology or human in vivo challenge studies, with either endogenous or synthetic/pharmaceutical compounds and without baseline data, and 4) studies on diseases with early onset dementia as a component of the phenotype but of predominantly different etiology (e.g., vascular). Given the limited volume of literature on this topic, no studies were excluded based on cohort size and case studies were included in the systematic review, though not in the meta-analysis. However, only cross-sectional studies were available in sufficient numbers to allow meta-analysis.
The meta-analysis included 34 studies, 20 for EOsAD and 14 for ADAD (which included both symptomatic and asymptomatic mutation carriers, sMC and aMC, respectively). By definition, the EOsAD individuals received a clinical diagnosis of AD with onset before 65 years, and the majority of them had no family history of EOAD. Genetic testing was generally not performed to eliminate APP, PSEN1, and PSEN2 mutations; however, in 4 of the 20 EOsAD studies, genetic testing was indeed carried out, and meta-analyses were also performed on these separately. The ADAD individuals had a similar age of onset, a positive family history of ADAD, and carried pathogenic mutation/s to one of the following genes: APP, PSEN1, and PSEN2. Across all studies, biomarker level changes were expressed as standardized mean differences (SMD), calculated relative to levels in cognitively healthy age-matched controls.
Five articles identified as meeting inclusion criteria were published on participants from the Dominantly Inherited Alzheimer’s Network (DIAN) cohort. After discussion with DIAN authors, and in order to avoid duplication of data on the same participants, we included only the most recently published DIAN article [6], excluding the previous four from the meta-analysis where the biomarker data was duplicated [7–10]. For articles with insufficient data, or data presented in an inaccessible manner, we emailed authors requesting additional information. The majority either did not respond or no longer had access to data. One author provided data which is included in our analyses [11].
While we did not use assay type as a selection criterion (either inclusion or exclusion) for the studies reported here. However, the majority (>95%) of studies used commercial kits which have been manufacturer validated. In particular, of the 27 studies which reported assaying Aβ and/or tau variants, 26 used the Innogenetics (Fujireibo-Europe) xMAP technology-based ELISA kits (Supplementary Tables 2 and 3). This fortuitous “standardization” is likely to minimize inter-laboratory variation for the meta-analysis results of Aβ and tau variants reported here.
Meta-analyses
Meta-analyses were conducted using the procedure, metan, within the statistical program Stata, version 15.0, using the random-effects model and the inverse-variance weighting of studies. The type-one error rate was set at 0.05. Meta-analyses were performed if there were at least two independent published studies on a biomarker, but in most cases included 3–13 studies.
For studies with continuous biomarker level as the outcome variable, data input into the statistical program were the number of cases, means and standard deviations (SDs) of the biomarker for each of the AD groups and their corresponding control groups. The output of this program expresses the levels of biomarkers as the SMDs, equal to the difference in concentrations between the particular AD group and its control group, divided by the pooled SDs.
For studies with a binary outcome measure (such as ɛ4 carrier status), data input were the natural logarithms of the odds ratios (log ORs) and their standard errors. These were calculated as follows. If a and b are the number of ɛ4 carriers in the AD and control groups respectively, and c and d are the corresponding numbers of non-carriers in those groups, then the odds ratio is given by OR = a*d/b*c. The standard errors of each log OR are calculated as the square root of (1/a + 1/b + 1/c + 1/d).
The random-effects model was used for all of the meta-analyses based on the assumption that each study produces estimates of the true effects for that particular study population, but that the study populations vary across individual studies due to differences in populations, study design, and assay platforms [12]. The pooled effect sizes produced by meta-analyses using the random-effects model are the estimates of the mean effect sizes for all potential studies satisfying the selection criteria of the review. Publication bias was assessed using the Stata command metabias, which was employed to produce funnel plots and to perform the Egger’s test to check for bias, for meta-analyses comprising ≥8 studies. For meta-analyses comprising fewer individual studies, it was not possible to draw reliable conclusions either from the visual inspection of the funnel plots or from the Egger’s test [13]. Comparison of pooled effects from pairs of meta-analyses was achieved using the Stata procedure, metareg.
Two articles [14, 15] presented data as median and range, and in these cases, we substituted median for mean and derived SD from range using the following approach: Range/4 (if n < 70) or Range/6 (if n > 70) [16]. For two articles, mean and SD values were estimated from bar graphs [9, 17]. Two articles reported serum neurofilament light chain (NfL) in ADAD individuals [18, 19], although, for one of them [18], we could not get access to the data and were therefore unable to perform a meta-analysis on serum NfL. A significant share of the ADAD data came from two large cohorts: the DIAN cohort and the Alzheimer’s Prevention Initiative (API) cohort representing a large pedigree living in the state of Antioquia in Colombia, South America. The DIAN cohort includes carrier and non-carrier (NC) family members with various ADAD mutations, while the Colombian kindred likely descended from a single individual and carried the E280A mutation in the PSEN1 gene.
Data availability statement
Data are available to qualified investigators on request to the corresponding author. Data will be shared at the request of other investigators for purposes of replicating procedures and results.
RESULTS
Protein/peptide biomarkers
Early onset Alzheimer’s disease (EOAD)
We identified 34 eligible published studies on EOAD, comprising 20 studies on EOsAD and 14 on ADAD. The results for established biomarkers (Aβ42, T-tau, and P-tau) were as follows: All variants of EOAD had lower CSF Aβ42 and higher CSF T-tau and P-tau (Table 1, Figs. 2–4), relative to their respective comparison groups. The majority of EOAD biomarkers were identified in CSF, and few studies of blood biomarkers were replicated frequently enough to allow meta-analysis.
A) Pooled standardized mean difference (pooled SMD), I-squared (I2), and significance (p) are shown with p≤0.05 accepted as statistically significant. B) Meta-analysis of APOE ɛ4 carriers in early onset AD pooled odds ratio (pooled OR), I-squared (I2), and significance (p) are shown with p≤0.05 accepted as statistically significant (random effects model is represented in the tables). Meta-analysis of CSF and serum/plasma biomarkers of EOsAD and ADAD
*LOAD meta-analyses report APOE ɛ4 allele enrichment in the 13.7% –40% range. (i) Early onset sporadic AD (EOsAD); defined as the age of onset <65 years and no family history of AD. (ii) EOsAD with the absence of APP, pSEN1, or PSEN2 mutations confirmed by genetic testing. (iii) EOsAD with no genetic testing reported (diagnosis based only on the absence of family history). (iv) Autosomal dominant AD (ADAD); EOAD with the carrier of at least one of APP, PSEN1, or PSEN2 mutations confirmed by genetic testing.

Forest plots of early onset sporadic Alzheimer’s disease patients versus controls. A) CSF Aβ42, SMD p < 0.001; B) CSF t-tau, SMD p < 0.001; C) CSF p-tau, SMD p < 0.001; D) CSF NfL, SMD p < 0.001; E) serum/plasma IgG, SMD p = 0.037; F) CSF P-tau181&199, SMD p = 0.018; G) CSF P-tau181 SMD p = 0.011; H) CSF albumin, SMD p = 0.241; I) CSF IL-6, SMD p = 0.385; J) CSF IgG, SMD p = 0.075; K) serum albumin, SMD p = 0.351. *values estimated from bar graph. p value represents the statistical significance of SMD test. References for the manuscripts represented in these forest plots are shown in the supplementary section where the full list of manuscripts used for meta-analysis appear in Supplementary Tables 2 and 3. Ikeda et al, 2013 [50] appears twice in panel C and F (Ikeda et al 2013 and Ikeda et al 2013*) as this study analyzed two different isoforms of P-tau, i.e., P-tau181 and P-tau199, respectively. #Ikeda et al 2013- detected level of tau199 biomarker in panel C and F.
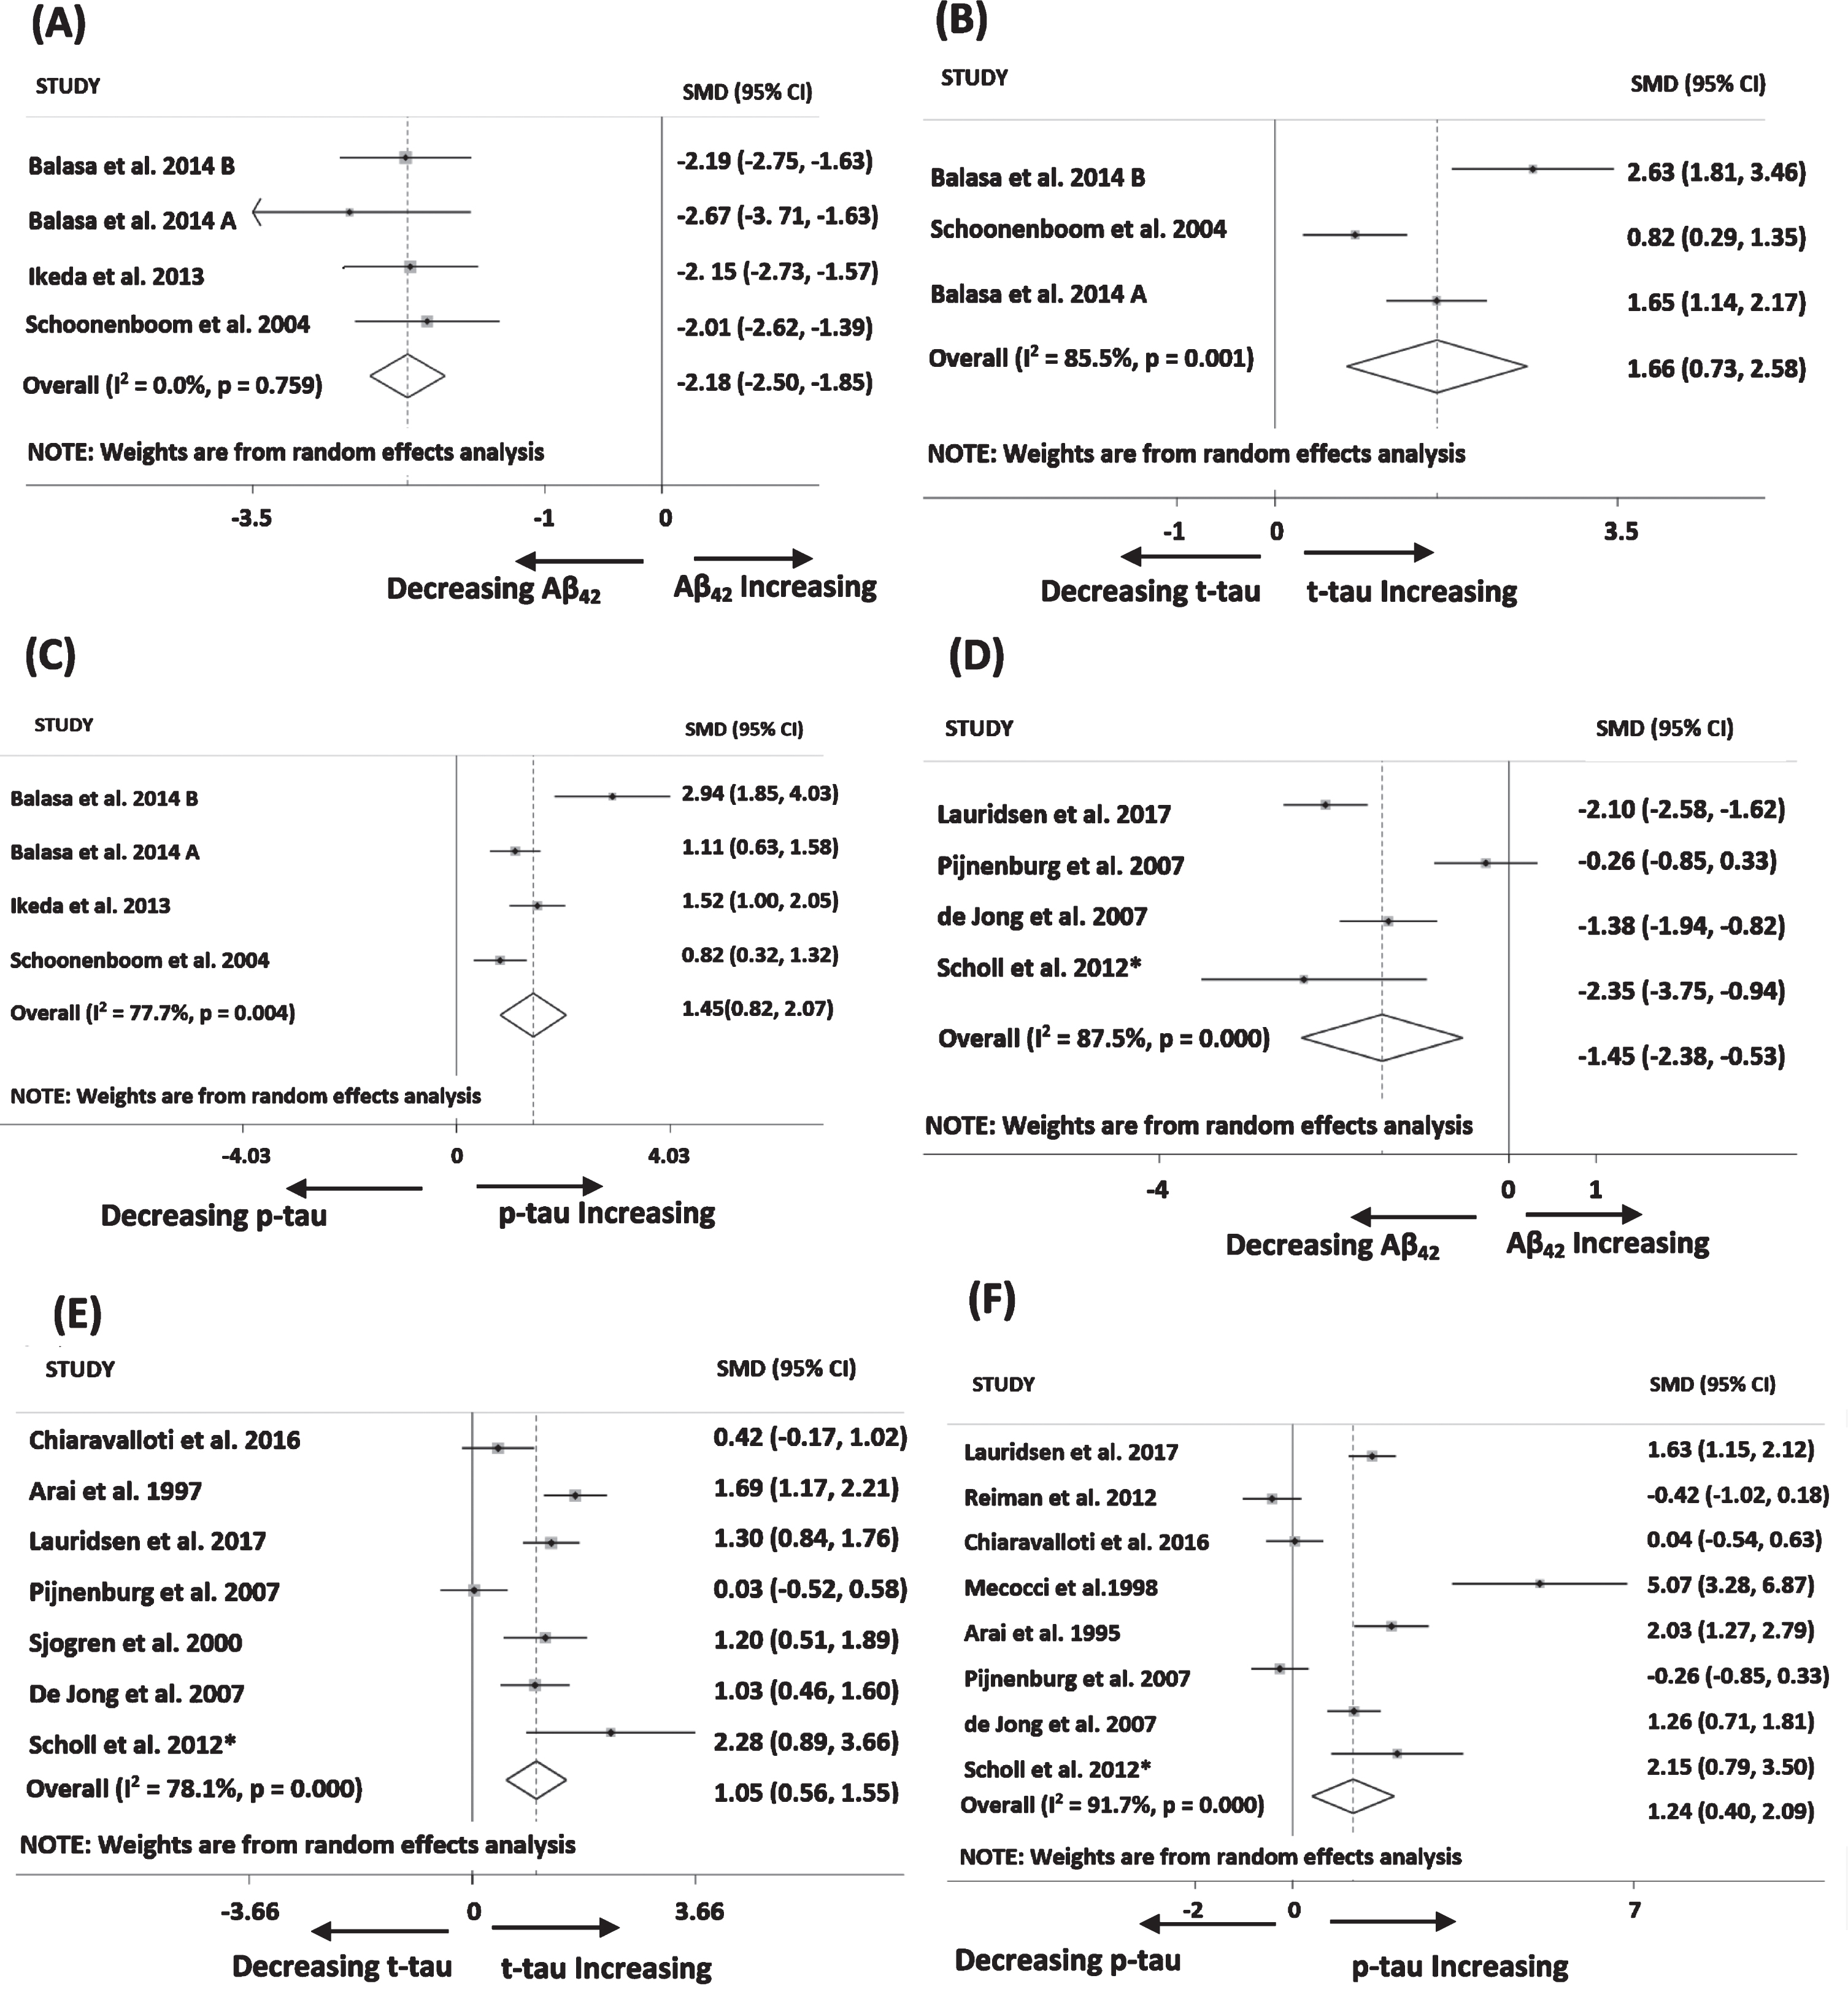
Forest plots of early onset sporadic Alzheimer’s disease patients (tested negative for APP/PSEN mutation carriers) versus normal control individuals. A) CSF Aβ42 (pg/ml); B) CSF t-tau (pg/ml); C) CSF p-tau (pg/ml) and early onset sporadic Alzheimer’s disease patients (no APP/PSEN mutation test has been performed) versus normal control individuals; D) CSF Aβ42 (pg/ml); E) CSF t-tau (pg/ml); F) CSF p-tau (pg/ml). *values estimated from bar graph.

Forest plots of autosomal dominant Alzheimer’s disease patients versus normal control individuals.
In addition to established biomarkers, quantitative data on several biomarkers of neurodegeneration and inflammation were reported in 2 to 4 studies each (Table 1). These were CSF NfL, IL-6, IgG, albumin, serum albumin, and IgG (Table 1, Fig. 2). Of these non-classical biomarkers (i.e., protein/peptide biomarkers other than Aβ42, T-tau, and P-tau), the only statistically significant results were for CSF NfL (pooled SMD = 1.42) and serum/plasma IgG (pooled SMD = 1.80) in the subset of all those with EOsAD.
Most of the meta-analyses had high levels of heterogeneity (I2 > 75%), reflecting a large amount of scatter around the pooled SMD axis. However, the direction of change, if not its degree, was consistent in >80% of established biomarker studies. Methodological differences across studies likely accounted for this heterogeneity, and therefore the random-effects model assumptions were the most appropriate [12].
Since this model permits small studies to contribute to outcomes, we explored such publication bias using funnel plots and Egger’s test. Funnel plots of 5 biomarkers were performed as they had 8 or more individual studies each (Fig. 5). Although visual inspection of the funnel plots did not give the impression of perfect symmetry around the vertical axis, the results from Egger’s test implied that there was no statistically significant systematic relationship between the results of each study and its size.

Funnel plots and Egger’s test for publication bias were performed on all meta-analyses which included 8–13 individual studies. For meta-analyses comprising fewer individual studies it is harder to make conclusions about distribution around the SMD axis, and the p-value from the Egger’s test is unreliable, so funnel plots are not included for meta-analyses with lower study numbers.
Comparisons of meta-analysis results of established CSF biomarkers were performed between pairs of patient groups versus controls to examine whether classical biomarker profiles of EOsAD and subsets of EOsAD are significantly different to those of ADAD (Supplementary Table 1). All the results of the meta-regression analyses were not significant, except for T-tau in EOsAD versus sMCs of ADAD, suggesting that the classical biomarker profile of EOsAD is not significantly different to the ADAD even though the majority of EOsAD individuals have no family history of early onset AD, and some articles on EOsAD have even eliminated the possibility of APP, PSEN1, or PSEN2 spontaneous mutation/s by genetic testing.
Early onset sporadic Alzheimer’s disease (EOsAD)
The 20 EOsAD studies collectively included 11 biomarkers (Table 1(i), and Fig. 2) which had been assayed in at least two independent studies (majority >3) and on which meta-analyses could be performed. Significantly lower CSF levels of Aβ42 and higher levels of T-tau, P-tau and specific variants of P-tau: P-tau181 and 199 were observed in EOsAD versus control (Table 1(i), Fig. 2). Additional CSF biomarkers, with sufficient numbers of articles (≥2 articles) to allow meta-analysis, included NfL, IgG, IL6, and albumin (Table 1(i), Fig. 2), of which only NfL had a significantly higher level, while the others had no significant difference relative to controls. In serum, only albumin and IgG were assayed in sufficient numbers of studies to allow meta-analysis and only IgG had a statistically significant result (Table 1(i), Fig. 2E), being increased in AD relative to controls.
Of the 20 studies on EOsAD, a subset of 4 was identified in which APP, PSEN1, or PSEN2 gene mutations had definitively been ruled out by genetic testing (Table 1(ii), Fig. 3A–C). A separate subset of 16 studies did not report confirmation of the absence of these mutations by genetic testing (Table 1(iii), Fig. 3D–F). Meta-analyses were performed separately on these two sets of studies. As shown in Table 1, pooled SMD values for Aβ42 were lower in the group in which the absence of mutations had been confirmed by genetic testing, while those for both T-tau and P-tau were higher in this group. However, none of these differences were statistically significant when examined using the Stata procedure, metareg.
Autosomal dominant Alzheimer’s disease (ADAD)
Individuals with a family history of AD and who also carry an AD-related mutation (APP/PSEN) are by definition autosomal dominant and may be identified at the aMC stage or at the sMC stage. To maximize statistical power, we initially performed a meta-analysis on all mutation carriers (all MCs), regardless of stage and subsequently stratified by symptom status (aMCs or sMCs) (Table 1(iv), Fig. 4). AD versus control comparisons for the established biomarkers were all statistically significant in all MCs, with lower CSF Aβ42 and Aβ40, higher CSF T-tau, and P-tau and higher plasma Aβ42 for AD (Table 1, Fig. 4). Following stratification by symptom status, CSF Aβ42 and T-tau were significantly lower and higher respectively, in sMCs versus controls (Table 1(iv), Fig. 4B, D). In aMCs, CSF Aβ42 also trended downwards, but pooled SMD was not as low as in symptomatic carriers and did not reach statistical significance (Table 1(iv), Fig. 4A). Level of T-tau significantly increased in aMCs; however, pooled SMD was not as high as in sMCs and results were not statistically significant (Table 1(iv), Fig. 4C). No replicate studies of other biomarkers of AD pathology were reported in ADAD cohorts.
APOE genotype status
APOE ɛ4 allele enrichment in EOAD groups
A significantly higher proportion of EOsAD participants were carriers of the APOE ɛ4 allele relative to their controls (Table 1B, Fig. 4J). There was no significant difference in APOE ɛ4 prevalence between ADAD and controls (Table 1B, Fig. 4K).
DISCUSSION
We performed a comprehensive meta-analytic review of all currently available protein/peptide CSF and blood biomarkers of early onset AD subtypes and explored these early onset AD phenotypes in the context of quantified biomarkers. We found that the hallmark proteins (Aβ and tau) showed similar patterns in the CSF, both qualitatively and quantitatively between EOsAD and ADAD, which was unanticipated since the expression of pathology, as reflected in classical biomarkers, might be expected to be less in the EOsAD group, which had no family history of EOAD. Instead, we found that a small proportion even had APP and PSEN mutations ruled out by genetic testing. This outcome suggests that an ADAD-like phenotype without the accompanying genotype, occurs in EOsAD, a group which represents the majority of early onset cases, but which have received surprisingly little attention to date. Other potential emerging markers of neurodegeneration and inflammation, including CSF NfL, IgG, and IL-6, were reported in EOsAD. However, the relative paucity of additional biomarkers and low numbers of reported studies was notable, particularly for the relatively accessible serum/plasma sample type.
Aβ peptide is a hallmark of AD, whose complex lifecycle not only produces a plethora of chain length variants such as Aβ38, Aβ40, Aβ42, and Aβ43 [20], but also multimeric aggregate structures such as oligomers, fibrils, and plaque [21]. Of these, the 42-amino-acid peptide (Aβ42) is the most studied variant due to its enhanced tendency to aggregate [22]. This process, known as the sink model, results in lower levels of soluble Aβ42 as plaque/insoluble levels increase [23]. Our meta-analysis results, which show a drop in CSF Aβ42 in all EOAD variants (Table 1), are consistent with this model. These observations are consistent with previous meta-analytic data on LOAD CSF Aβ42 [24]. Interestingly, the lowest pooled SMD (highest drop in Aβ42) was for ADAD symptomatic mutation carriers (sMCs) and the EOsAD subset with no APP, PSEN1, or PSEN2 mutations. The decreased level of CSF Aβ42 in ADAD aMCs was almost equal to EOsAD and suggested an EOsAD etiology similar to ADAD. There were few studies of other CSF Aβ peptides in the context of EOAD. However, a significant reduction in the level of Aβ43 in EOAD patients relative to controls has been reported [25].
Tau is one of the most abundant proteins in neurons with a role in stabilizing the structure of microtubules [26]. In AD, tau is hyperphosphorylated, dissociated from microtubules, and can be detected in CSF at an increased level relative to healthy controls [27]. Our meta-analyses showed a significant increase in both variants of tau (T-tau and P-tau) in all subtypes of EOAD. The pooled SMD of T-tau was significantly higher in ADAD sMCs as compared to EOsAD, likely reflecting a higher degree of neuronal damage in ADAD as compared to the EOsAD variant. The EOsAD subset with confirmed absence of APP, PSEN1/PSEN2 mutations, had higher levels of both tau variants than the full EOsAD group. While the significance of this is not entirely clear, it suggests the possibility that the EOsAD group has mixed etiologies. Tau can be phosphorylated on various sites; however, most assays report phosphorylation of thr181 and ser199 specific epitopes because of the higher diagnostic accuracy of these epitopes to differentiate AD from healthy controls [28]. While our meta-analysis results confirm that these two specific epitopes discriminate between control and AD participants, neither the SMD nor the p-values were higher than for the general P-tau measure, suggesting little advantage in using these specific phospho-epitopes. In LOAD, several studies have reported other tau epitopes; thr231 was detected before the formation of paired helical filaments [28], whereas thr181 and ser199 were considered late events in AD [29].
According to some models, neurodegeneration is more closely linked to symptomatology as compared to Aβ pathology [30]. A handful of additional neurodegeneration and inflammation markers, including NfL, albumin, IL-6, and IgG that we identified as suitable for meta-analysis, were reported in only 2 to 4 studies each. Of these, CSF NfL was significantly upregulated in EOAD cases when compared to healthy controls. NfL is the light chain protein of neurofilament, which makes up neurofilament bundles with counterparts that determine the axonal caliber and conduction velocity [24]. NfL is an integral component of synapses and loss of synapses may account for the increasing level of NfL in blood and CSF [31, 32].
Furthermore, recent studies have established a correlation between blood and CSF NfL in late-onset AD [33], making it a potentially useful biomarker for neuronal apoptosis. Like tau, NfL is associated with the neuronal cytoskeleton, and interestingly, we found a similar increase in the pooled SMD of CSF NfL in EOsAD relative to controls (Supplementary Table 1). These findings relating to CSF levels of NfL in EOsAD suggest that additional studies in both CSF and serum/plasma are warranted, since an additional potential biomarker has been identified, even within this narrow range of replicated markers. There are several other well studied markers of neurodegeneration such as sTREM2, VILIP-1, and NfH, reported in LOAD [34, 35] which have not, as yet, been explored in EOsAD and ADAD.
A particularly notable feature of our EOAD meta-analysis was the lack of replicated data on blood biomarkers. Blood biomarker studies are more prevalent in LOAD [24, 36], whereas the EOAD biomarkers were assayed almost exclusively in CSF (Table 1). This may be a reflection of clinical practice, whereby CSF may be collected more often in EOAD cases, and less frequently in LOAD. Assay of CSF Aβ and tau for the diagnostic evaluation of dementia has recently been recommended by an international consensus group [37], but the invasive nature of a spinal tap makes it unlikely that it will be taken up widely [38]. For plasma Aβ42, a comprehensive meta-analysis was performed reporting a significant decrease in plasma Aβ42 in clinically diagnosed LOAD cases [36].
In contrast, our meta-analysis of ADAD (all MCs) shows a significant increase in plasma Aβ42, likely reflecting the higher peptide level in the plasma due to increased expression of Aβ42 or cleavage of APP at this earlier age group, in-line with the Aβ sink model. Previous studies have reported that an increase in plasma level of Aβ42 correlates with the risk of AD development. With disease progression, the reduction of Aβ42 level over time has been recorded in plasma, reflecting deposition in plaque [39, 40]. In this younger cohort, clearance to plasma may be more efficient. There were insufficient studies on plasma Aβ42 in EOsAD, so a meta-analysis was not possible. Our meta-analysis on EOAD identified several studies reporting serum/plasma albumin and IgG in which a significant increase of IgG was observed (Table 1). These observations reflect findings in previous studies that show increased levels of both inflammation mediating proteins and pro-inflammatory IgG, which enhance the inflammatory activity in blood and represent a high-risk factor for AD [41]. In ADAD, serum NfL is emerging as a promising biomarker in the literature, but we could not perform a meta-analysis on NfL due to an insufficient number of studies. A longitudinal study, however, reported that an elevated level of NfL could differentiate mutation carriers from non-mutation carriers much earlier as compared with absolute NfL levels assayed in cross-sectional studies [18].
Interestingly, discovery-based approaches have the potential to quantify 100s–1000s of proteins, and while the majority are unlikely to be significantly changed in AD, the few that do change may provide not only critical diagnostic tools but also an insight into disease mechanisms. Plasma protein profiling of symptomatic and asymptomatic ADAD patients from the DIAN cohort reported significant differential expression of seven and sixteen proteins in aMC and sMC, respectively. These proteins included complement and inflammation family members which are known to exacerbate the pathogenic processes of AD [42]. Promisingly, an essential role for complement proteins in neuronal pruning, has recently been identified [43, 44].
The APOE ɛ4 allele is the strongest genetic risk factor for LOAD [46]. In LOAD, APOE ɛ4 is associated with increased Aβ levels and risk of Aβ accumulation at an earlier age, thereby accelerating the clinical onset of AD [45]. Furthermore, 50% of APOE ɛ4 homozygous carriers have diagnosed AD by 70 years of age [46]. Less is known about APOE ɛ4 allele carrier enrichment in EOAD. We identified significant enhancement in the level of the APOE ɛ4 allele in EOsAD as compared to healthy controls: 43% and 30% respectively. By contrast, the ADAD group had a similar level of APOE ɛ4 allele expression as compared to healthy controls; 28% and 29% respectively, indicating no significant difference (Table 1B). The level of reported APOE ɛ4 allele enrichment in LOAD as compared to controls was in the range of 13.7–40% [47, 48]. Our meta-analysis shows EOsAD APOE ɛ4 allele enrichment within the range of that reported for LOAD, and therefore enrichment of this allele does not account for the earlier age of onset of EOsAD relative to LOAD. Previous studies indicate a dose-dependent effect of APOE ɛ4 on CSF Aβ42 level in LOAD [49]; however insufficient study numbers were available to explore an APOE ɛ4 dose effect for EOAD. EOsAD cohorts may represent an opportunity to explore novel genetic and lifestyle risk factors responsible for the earlier onset of symptoms in EOsAD.
Limitations
Some of the limitations of this study include the lack of longitudinal data, small sample size cohorts, and fewer studies which include analysis of plasma samples. For ADAD studies, the majority of the meta-analyses were based on two cohorts: DIAN and the Colombian Alzheimer’s Prevention Initiative. Considerable heterogeneity was observed across studies, which was probably due to variation in study characteristics. We managed this in part by using a random effects model. Only 5 out of our 28 meta-analyses had sufficient study numbers to allow assessment of publication bias. The majority of EOsAD studies (16 out of 20) did not perform genetic analyses to eliminate APP/PSEN gene mutations and relied purely on the absence of family history. Interestingly, those 4 EOsAD studies in which APP/PSEN gene mutations were eliminated had lower levels of Aβ42 and higher levels of all tau variants, suggesting an ADAD-like phenotype without the ADAD genotype, indicating that investigation of additional “non-classical” drivers of EOsAD is warranted. Furthermore, study numbers of particular biomarkers (i.e., CSF IL-6, IgG, and albumin) are low, so in some cases insignificant results could be a reflection of insufficient numbers of published studies, again reinforcing the need for additional biomarker work, particularly for genetically well-characterized EOsAD.
Conclusions
Our meta-analysis of established biomarkers has confirmed the quantitative difference between three variants of EOAD versus corresponding control groups. CSF NfL and IgG were statistically significant and emerging as potential markers of neurodegeneration and inflammation to differentiate EOsAD from healthy individuals. EOsAD is a relatively neglected AD subtype of unknown etiology and therefore represents an opportunity to explore as yet unidentified genetic and/or lifestyle factors that contribute to earlier AD onset. To date, the range of biomarkers studied have been heavily focused on CSF, but for establishing promising blood tests, more research is needed before any of these could replace CSF or imaging tests. Generally, EOAD biomarker research is limited to the peptides considered to be hallmarks of AD pathophysiology whereas screening a broader spectrum of analytes (e.g., proteomic profiling, lipids, RNA, metabolites) together with longitudinal analysis is necessary to track the progress of disease pathology. Studies we included for meta-analysis were based on a dichotomization on age. However, studying age as a continuous variable in cohorts might provide insight into the trajectory of biomarker change with age and stage of disease. Similarly, a longitudinal study design would offer greater statistical power to identify biomarker changes over time. These are important considerations for the planning and design of new studies. Understanding pathophysiology and identification of additional preclinical biomarkers can be facilitated using discovery-based “omics” approaches.
Footnotes
ACKNOWLEDGMENTS
This work was supported by a National Health & Medical Research Council of Australia Program Grant (APP1054544) to PSS, UNSW Scientia Postgraduate Scholarship to GK, and Australian Research Council DECRA Postdoctoral Fellowship to NB. We thank the Rebecca L. Cooper Medical Research Foundation and the Sachdev Foundation for their ongoing research support.
We are thankful to Dr. Juan Marín, Dr. Erdinc Dursun, Dr. Steinunn Thordardottir, Prof. Anne Fagan, and Dr. Chengjie Xiong for providing data and information about the studies used in our meta-analyses.