
Abstract
Background:
Cerebral cortical thickness is a neuroimaging biomarker to predict cognitive decline, and kidney dysfunction (KD) is associated with cortical thinning.
Objective:
This study aimed to investigate the effects of KD and cortical thinning on cognitive change in a prospective cohort study.
Methods:
A total of 244 non-demented participants were recruited from elderly health checkup program and received cognitive exams including Montreal Cognitive Assessment (MoCA) and different cognitive domains at baseline and three biannual follow-ups afterwards. KD was defined as having either glomerular filtration rate <60 ml/min/1.73 m2 or proteinuria. Cortical thickness of global, lobar, and Alzheimer’s disease (AD) signature area were derived from magnetic resonance imaging at baseline, and cortical thinning was defined as the lowest tertile of cortical thickness. Generalized linear mixed models were applied to evaluate the effects of KD and cortical thinning on cognitive changes.
Results:
KD was significantly associated with the decline in attention function (β= –0.29). Thinning of global (β= –0.06), AD signature area (β= –0.06), temporal (β= –0.06), and parietal lobes (β= –0.06) predicted poor verbal fluency over time, while temporal lobe thinning also predicted poor MoCA score (β= –0.19). KD modified the relationship between thinning of global, frontal, and limbic, and change of logical memory function (p interaction < 0.05). When considering jointly, participants with both KD and cortical thinning had greatest decline in attention function compared with those without KD or cortical thinning (β= –0.51, p trend = 0.008).
Conclusions:
KD and cortical thinning have joint effect on cognitive decline, especially the attention function. Reverse associations may exist between cortical thinning and memory function in participants with KD, though the results should be interpreted cautiously as an exploratory analysis.
INTRODUCTION
In an aging society, dementia becomes a major health burden. The estimated numbers of people with dementia worldwide in 2015 is 47 million and is expecting to double every 20 years [1, 2]. Delaying the onset of dementia by five years may reduce the incidence cases up to 5.7 million [3]. It is therefore important to identify the potential preventable risk factors of dementia.
Chronic kidney disease (CKD) is another major health burden worldwide. According to a meta-analysis, about 13% of the population worldwide is affected by certain degree of CKD [4]. CKD has also been increasingly recognized as one important risk factor for dementia, as one recent meta-analysis suggested a 35% increased risk of cognitive impairment or dementia in participants with kidney dysfunction (KD) [5]. Of various cognitive domains, attention and language function may be particularly affected in early stage of CKD, while impaired executive function and memory domains were commonly observed later [6, 7]. Since CKD and dementia are both common diseases in the older population, the potential detrimental effects of CKD on cognitive impairment has been proposed [8]. The possible links between KD and cognitive impairment include traditional vascular risk factors; non-traditional vascular risk factors such as inflammation, oxidative stress, hypercoagulable state, and hyperhomocysteinemia; and non-vascular risk factors such as uremic toxin, anemia, or polypharmacy [8]. In addition, a ‘shared-insult’ theory of brain and kidney might explain their connections: both were low resistance end-organs that were constantly exposed to high-volume blood flow throughout the cardiac cycle and were therefore vulnerable to endothelial dysfunction and microvascular injury [9].
Several biomarkers have been proposed to identify the risk of developing dementia. Structural change of the brain detected by magnetic resonance imaging (MRI) serves the most closely temporal relationship with the onset of clinically detectable memory impairment [10]. Of note, cerebral cortical thickness (CTh) has been recommended as one of the validated imaging biomarkers for dementia [11]. Interestingly, studies have found that low glomerular filtration rate (GFR) was related to temporo-parietal thinning in patients with Alzheimer’s disease (AD) [12], and KD (represented by low GFR or proteinuria) was associated with diffuse cerebral cortical thinning even in normal cognitive older adults [13]. Since KD is a putative risk factor of dementia, and cortical thinning is correlated with the severity of dementia, it is worthwhile to clarify the association between KD, CTh, and cognitive impairment. Nevertheless, there were only few studies considering these three aspects jointly, and these studies usually focused on the susceptible population such as patients with diabetes mellitus or post-stroke [14 –18]. Less is known about whether such change exists in non-demented and relatively healthy older population. In addition, CTh was rarely studied from previous studies regarding kidney function related cognitive decline, despite its critical role as the neuroimaging biomarker for neurodegeneration. Furthermore, KD itself might have selective impacts on different cognitive domains as suggested by prior literature [6, 7], hence a comprehensive battery of neurocognitive tests instead of dementia itself may be a more sensitive target for subtle cognitive change in the process of neurodegeneration.
The aims of the current study were to determine whether kidney function itself would alter the relationship between CTh and cognitive change in non-demented older adults, and to evaluate if kidney function and CTh have joint effects on the corresponding cognitive change. The impacts on different cognitive domains would also be examined separately.
MATERIALS AND METHODS
Study design and participants
This study was based on Taiwan Initiative for Geriatric Epidemiological Research, a prospective cohort study which recruited non-demented community-dwelling older adults aged 65 years or older from the annual health checkup programs at National Taiwan University Hospital at baseline (2011–2013). The research protocol, informed consent, questionnaires, and application forms were approved by the Research Ethics Committee at National Taiwan University Hospital. All study participants provided written informed consent before enrollment. Participants with the following conditions were excluded: clear history of stroke, using medication for treating AD, baseline cognitive impairment (defined as Taiwanese version of the Montreal Cognitive Assessment (MoCA-T) score ≤21), terminal illnesses, other notable neurodegenerative diseases, contraindications for brain MRI, or unable to participate or to be followed up during the study period. Informed consent was obtained from each participant before administration of questionnaires, performing clinical assessments, and collection of biological specimens. After baseline recruitment, regular follow-up visits were performed every 2 years, and a total of 3 visits (baseline, 1st follow-up, and 2nd follow-up) were conducted from 2011 to 2017.
Acquisition of MRI and analysis of brain morphology
Brain MRI was performed using a 1.5-T scanner with high-resolution T1-weighted volumetric MRI scans. All images were processed using the FreeSurfer suite (http://surfer.nmr.mgh.harvard.edu), version 5.3, and a surface-based pipeline can compute CTh at each location of cerebral cortex from a serial stage of processing [19]. We adopted the Desikan-Killiany atlas in the FreeSurfer analysis suite [20]. Global (whole brain) average, as well as frontal, parietal, temporal, occipital, limbic, and insular lobar average of CTh were calculated in each participant and expressed in millimeters. Additionally, ‘AD signature area’ was also calculated by averaging of the following cortical regions: entorhinal, inferior temporal, middle temporal, temporal pole, superior parietal, inferior parietal, posterior cingulate, and precuneus [21]. Participants with the lowest tertile of respective CTh would be defined as having cortical thinning (e.g., global thinning, AD signature area thinning, or frontal thinning).
In addition, volumes of cerebral cortex, gray matter, hippocampus, and white matter lesion (WML) were also calculated by FreeSurfer and adjusted for total intracranial volume to correct for inter-subject variation in brain size [22]. Because of the skew distribution and relatively small volume after correction, the volume of WML underwent natural log transformed before entering the final analyses.
Assessment of kidney function
Kidney function was assessed by laboratory study at baseline health check-up. GFR was calculated by the Chronic Kidney Disease Epidemiology Collaboration (CKD-EPI) equation:
Assessment of cognitive function
A battery of neurocognitive assessment was administered by trained examiners following a standardized protocol at baseline and two follow-up visits (total 3 times). Global cognitive function was assessed by MoCA-T [26], in which a total score ranged from 0 to 30 and a higher score indicates better cognitive function. Four cognitive domains were measured by 9 individual tests. The memory domain consisted of logical memory test (the immediate free recall and theme recall, and the delayed free recall and theme recall tests) from the Taiwanese version of the Wechsler Memory Scale-Third Edition (WMS-III) [27]. The attention domain was assessed with the digit span forward components of the WMS-III and Trail-Making Test part A [28, 29]. The executive function domain was measured with the digit span backward components of the WMS-III and Trail-Making Test part B [30]. The verbal fluency domain was assessed by naming fruits, fish, and vegetables within 1 minute [31].
For the above 9 individual tests, a Z score was computed for each participant at each assessment point, standardized on the basis of corresponding means and standard deviations of the population test score at baseline. The use of Z score allowed comparisons between cognitive tests with different scales as well as their changes over times [29, 32]. The Z score of the individual tests were averaged within a cognitive domain to derive the domain-specific Z score.
Covariates
The relevant covariates used in the present study was obtained at baseline visit. Demographic data included age, gender, body mass index, years of education, and history of smoking. Medical history such as hypertension, diabetes mellitus, and hyperlipidemia were recorded based on self-report, use of relevant medications, or medical record. Presence of depressive symptoms was defined if the participant scored equal of more than 16 on the self-report questionnaire Center for Epidemiologic Studies Depression (CES-D) scale [33]. Blood sample test included total cholesterol, triglycerides, glucose, interleukin-6, and C-reactive protein. Apolipoprotein E (APOE) ɛ4 genotype was determined by two single nucleotide polymorphisms (SNPs) rs42938 and rs7412, using TaqMan genomic assays by an ABI 7900HT fast real-time PCR system (Applied Biosystems Inc., Foster City, CA, USA) [34]. Covariates were selected a priori based on existing evidence linking them to cognitive impairment.
Statistical analyses
The characteristics between participants with or without KD were compared by Chi-square test for categorical variables, and Student’s t test or Mann-Whitney U-test for continuous variables. Since the study included three repeated measurements in each participant, generalized linear mixed models (GLMM) would better capture the changes of cognitive function (MoCA-T or domain-specific Z score) in relation to cortical thinning and KD over time. Common covariates adjusted in all models included age, gender, education years, APOE ɛ4 status, hypertension, diabetes mellitus, hyperlipidemia, presence of depressive symptoms, natural log transformed WML volume, and years apart from the first visit. Random intercept and random slope models were applied, as years from the first visit served as random slope. To test the interaction between cortical thinning and KD, an interaction term (KD multiplied by cortical thinning) was introduced. Because the kidney function and CTh were only measured at baseline, interaction terms (i.e., KD×time, cortical thinning×time, and KD×cortical thinning×time) were included in the models. Because KD and cortical thinning showed significant interaction (p < 0.05) on cognitive function, stratification analyses by KD status were performed to assess if significant association exist between cortical thinning and cognitive change in some sub-populations. Normality was required while using continuous response variables and we found that the following variables did not meet normality assumption: MoCA-T, attention domain at baseline, 1st and 2nd follow-up; executive and memory domain at 2nd follow-up. However, we compared our results before and after normal transformation, the results were consistent. We did not transform these variables because transformation may lead to large beta coefficient, which is not easy to compare the results between different response variable.
Finally, to explore whether joint effects of KD and cortical thinning existed, participants were categorized into four groups based on their status of KD and cortical thinning. Participants without KD nor cortical thinning were treated as reference group, while participants without KD but with cortical thinning, with KD but without cortical thinning, and with both KD and cortical thinning were compared with reference group, respectively. The statistical analyses were performed by SAS version 9.4 (SAS Institute Inc, Cary, NC, USA). The figures were created by SAS, Microsoft Excel and Prism 8 (GraphPad Software, La Jolla, CA, USA). All statistical tests were two-sided, and p values <0.05 were considered statistically significant.
RESULTS
Demographic profile of the included participants
A total of 397 participants had received brain MRI. After excluding those with exclusion criteria as well as those without complete follow-up data, 244 participants were included in the present analysis (Supplementary Figure 1). Their average age was 71.6±4.9 years. The average GFR estimated by CKD-EPI formula was 76.8±14.4 ml/min/1.73 m2, 81.4±18.3 ml/min/1.73 m2 by MDRD formula, and 67.6±12.8 ml/min/1.73 m2 by BIS formula. Thirty-five participants (14.3%) were classified as KD according to the results of CKD-EPI formula and urinalysis. Participants with KD were generally older and had higher prevalence of hypertension and hyperlipidemia than those without KD (Table 1). The score of cognitive tests, including global MoCA-T score, attention and executive function were lower in participants with KD. In addition, participants with KD had thinner global CTh (2.35±0.11 mm versus. 2.30±0.10 mm, p = 0.01), thinner CTh of frontal, temporal, parietal, occipital and insular lobes, smaller volume of hippocampus (2.39±0.25 cm3 versus 2.59±0.32 cm3, p = 0.001), and larger volume of WML (3.69±4.16 cm3 versus 2.10±1.49 cm3, p = 0.03).
Population characteristics by kidney dysfunction at baseline (2011–2013)
a Age at the time of MRI scan. b According to CKD-EPI formula. c Cognitive score at the time of MRI scan. For MoCA-T, the score was in its original scale (0–30); for attention, executive function, logical memory and verbal fluency, the original scores underwent Z-transformation and domain averages were calculated. Numbers in bold indicated statistical significance. AD, Alzheimer’s disease; APOE, apolipoprotein E; GFR, glomerular filtration rate; MoCA-T, Taiwanese version of the Montreal Cognitive Assessment.
The change of cognitive scores over time were presented in Fig. 1. The Z-scores of attention and verbal fluency domains showed gradually decreased from baseline to 2nd follow-up visits, while MoCA-T and other domains did not showed decline. In each cognitive domain, participants with KD had lower scores than participants without KD.
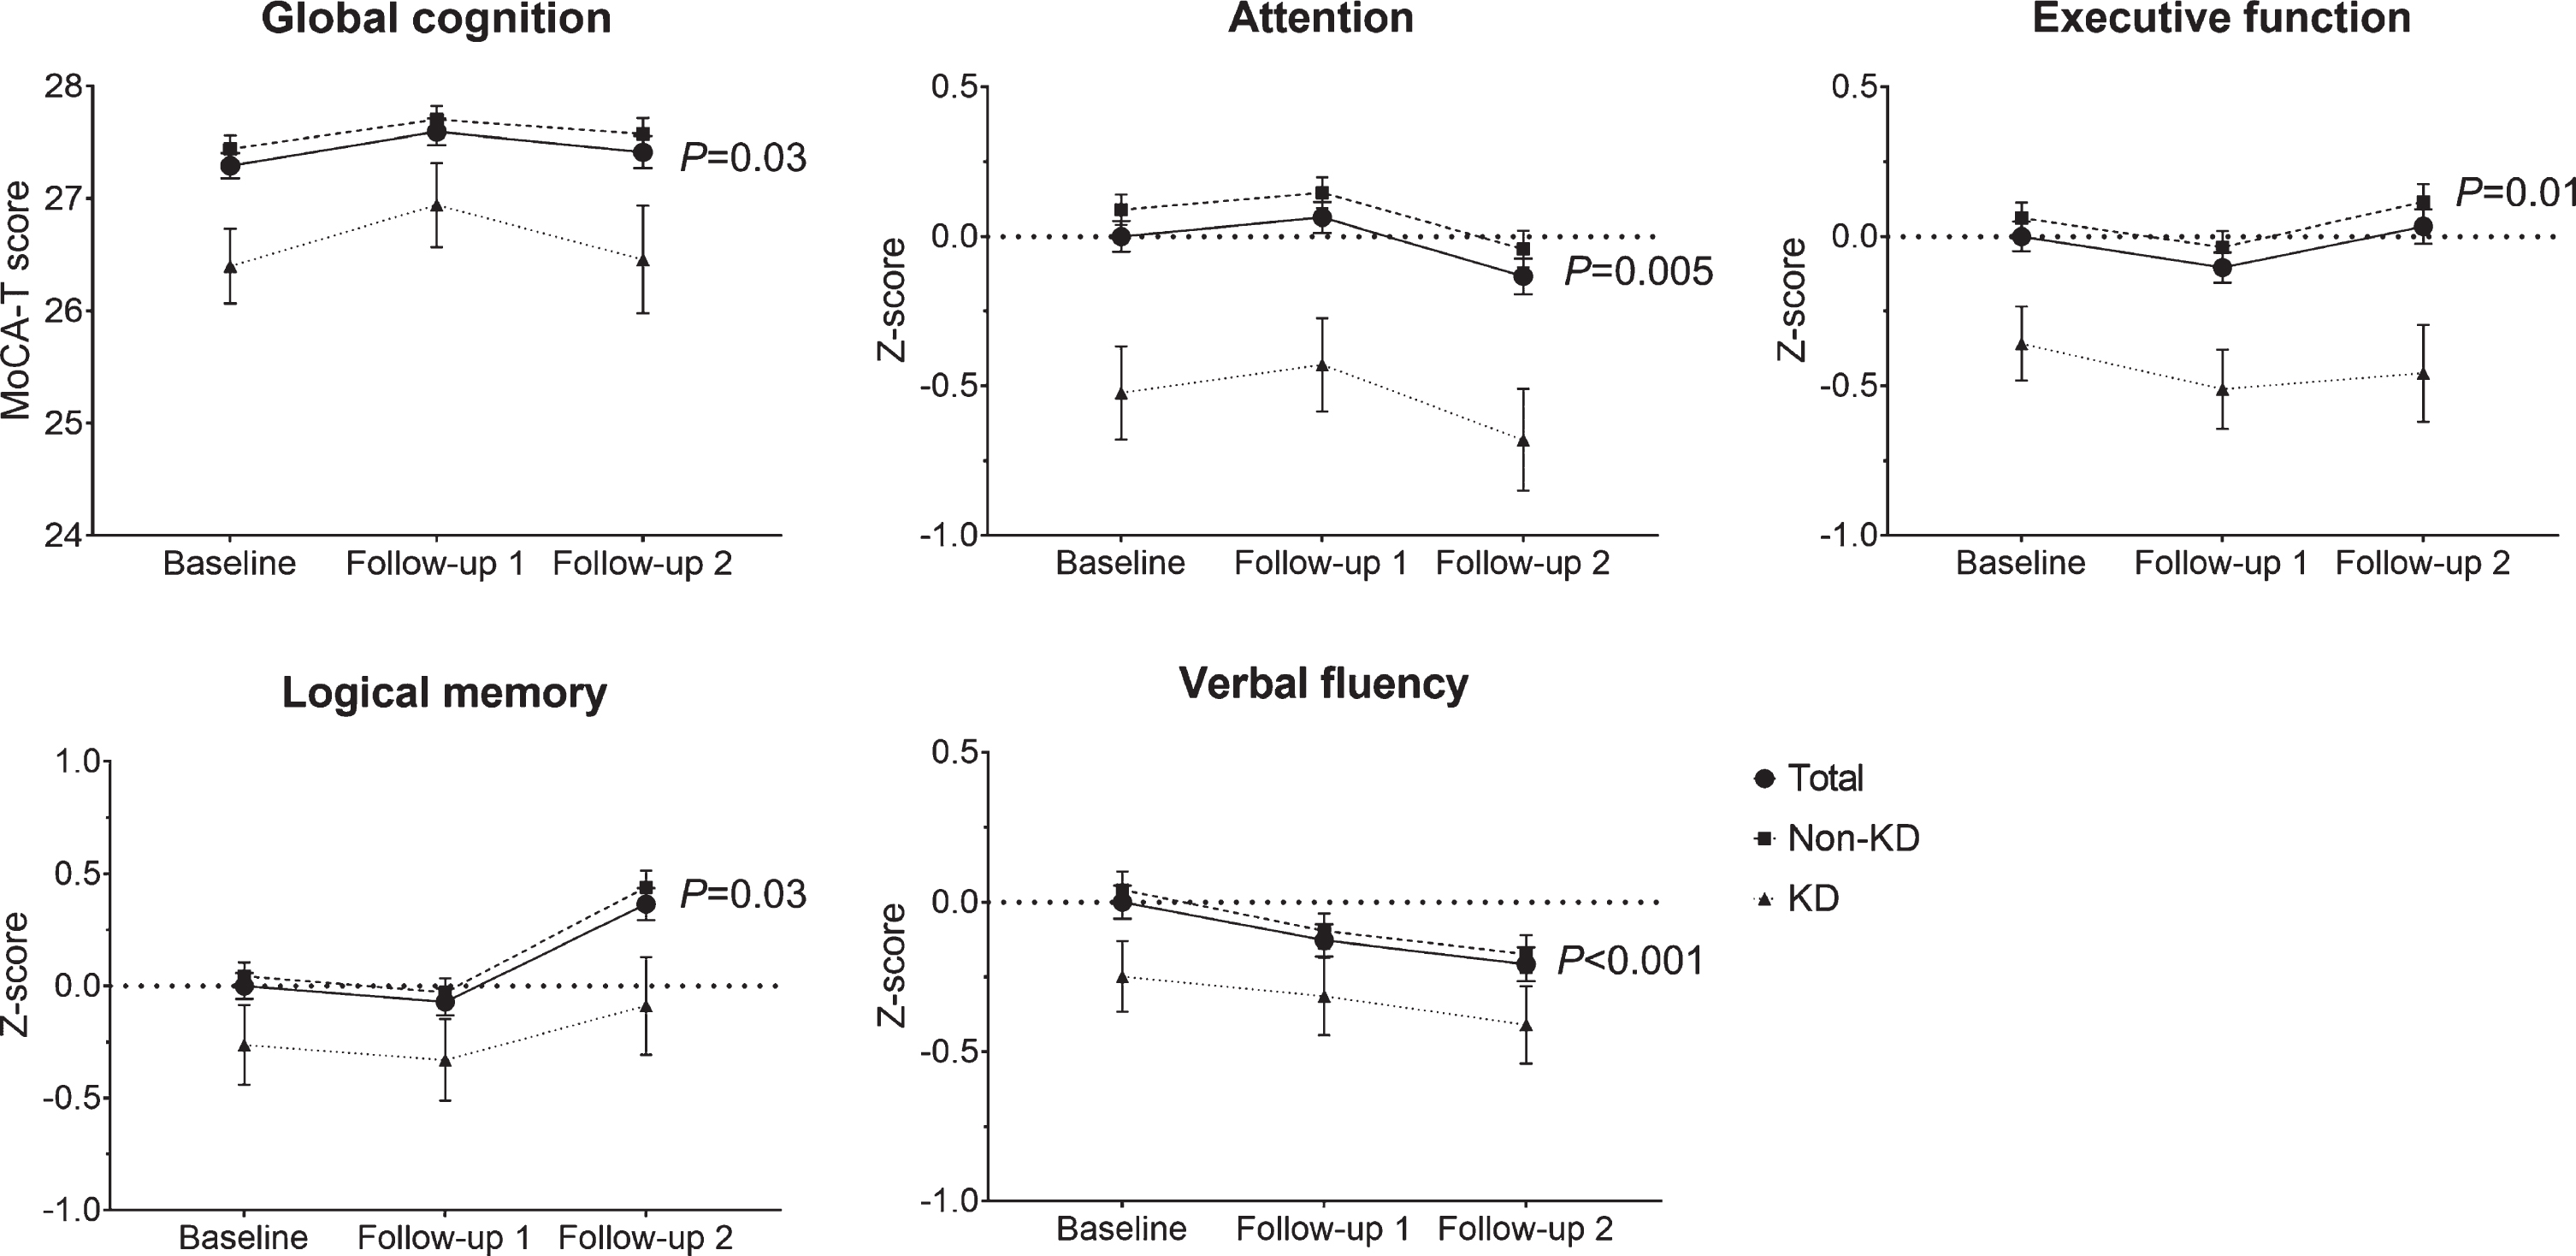
Change of cognitive score according to kidney dysfunction. The cognitive score had significant changes over three visits (all p < 0.05) in the whole participants. Error bars represent standard error of the mean. KD, kidney dysfunction; MoCA-T, Taiwanese version of the Montreal Cognitive Assessment.
Impacts of kidney function and cortical thinning on cognitive change over 4 years
The effectsof different parameters of kidney function, including GFR calculated by CKD-EPI, MDRD, BIS, presence of GFR < 60 or KD, on cognitive change over 4 years were presented in Supplementary Table 1. Among them, presence of KD at baseline resulted in decline of performance in attention (β= –0.29, 95% confidence intervals [CI] = –0.52 to –0.05) and executive function domains (β= –0.25, 95% CI = –0.50 to –0.002). Other parameters did not have significant impacts on cognitive change.
The main effects of cortical thinning, KD, and their interaction were presented in Table 2. For time interaction terms, we found that temporal lobe thinning was associated with change in MoCA-T over time (β= –0.19, 95% CI = –0.36 to –0.02). Additional associations were found between decline in verbal fluency over time with global (β= –0.06, 95% CI = –0.11 to –0.01), AD signature area (β= –0.06, 95% CI = –0.11 to –0.01), temporal (β= –0.06, 95% CI = –0.11 to –0.01), and parietal (β= –0.06, 95% CI = –0.11 to –0.01) lobes thinning. For the primary effects, consistent associations we found were between decline on the performance of logical memory and cortical thinningin global (β= –0.31, 95% CI = –0.55 to –0.07), AD signature area (β= –0.33, 95% CI = –0.57 to –0.10), temporal (β= –0.31, 95% CI = –0.57 to –0.05), and occipital (β= –0.28, 95% CI = –0.51 to –0.04) lobes. In addition, AD signature area thinning was associated with lower performance in attention (β= –0.23, 95% CI = –0.43 to –0.02), and frontal thinning was associated with lower performance in executive function (β= –0.22, 95% CI = –0.44 to –0.01). Meanwhile, KD was mainly associated with lower performance in MoCA-T and attention domain. We also re-analyzed our data that included participants who were lacking a cognitive score on follow-up 2 (total n = 293), and the results were presented in Supplementary Table 2. Consistent findings were that thinning of global (β= –0.06), AD signature area (β= –0.08), frontal (β= –0.06), temporal (β= –0.07), parietal (β= –0.06), and insular lobes (β= –0.06) predicted poor verbal fluency over time, while thinning in frontal (β= –0.21) and temporal lobe (β= –0.22) predicted poor MoCA-T score.
Effects of cortical thinning and kidney dysfunction on cognitive change over 4 years
a Generalized linear mixed model with random intervals and slope (years), change of cognitive score as dependent variable, KD, cortical thinning, and KD×cortical thinningas independent variables, with cortical thinning×time, KD×cortical thinning×time as time interaction variables; age, sex, years of education, APOE ɛ4 status, hypertension, diabetes mellitus, hyperlipidemia, depressive symptoms, natural log transformed white matter lesion volume and years from baseline as covariates. b False discovery rate q value < 0.05. Numbers in bold indicated significant findings (before correction for multiple comparisons). AD, Alzheimer’s disease; CI, confidence intervals; CTh, cortical thickness; KD, kidney dysfunction; MoCA-T, Taiwanese version of the Montreal Cognitive Assessment.
Stratified analyses based on the presence of KD
Significant interactions were found between KD and thinning in global (p interaction = 0.01), frontal (p interaction = 0.007), and limbic (p interaction = 0.0001) lobes on logical memory domain, as well as between KD and global thinning (p interaction = 0.006) on global cognition (MoCA-T score). Stratified analyses based on the status of KD at baseline were then performed (Table 3). In participants without KD, thinning in global, frontal, and limbic lobes were associated with lower performance in logical memory domain (β= –0.33 [95% CI = –0.55 to –0.10], –0.19 [–0.43 to 0.05], and –0.13 [–0.37 to 0.11], respectively). The associations reversed in participant with KD, that is, cortical thinning resulted in a better logical memory (β= 0.40 [–0.18 to 0.98], 0.64 [0.05 to 1.23], and 1.09 [0.51 to 1.68] for global, frontal, and limbic thinning, respectively). Similar findings were seen in the associations between global thinning and global cognition (β= –0.32 [–0.75 to 0.12] and 0.35 [–0.69 to 1.39] in participants without and with KD).
Associations between MRI and cognitive change stratified by kidney dysfunction at baseline
a Generalized linear mixed model was conducted separately in participants with and without kidney dysfunction, and change of cognitive score was dependent variable, while MRI marker was independent variables, and age, sex, years of education, APOE ɛ4 status, hypertension, diabetes mellitus, hyperlipidemia, depressive symptoms, natural log transformed white matter lesion volume and years from baseline as covariates. Numbers in bold indicated statistical significance.CI, confidence intervals; MoCA-T, Taiwanese version of the Montreal Cognitive Assessment.
Joint effects of KD and cortical thinning on cognitive change
Participants were divided into four groups according to their status of KD and cortical thinning. Compared to participants without both KD and global thinning, those with both KD and global thinning (β= –0.51, 95% CI = –0.83 to –0.20) had significantly poor performance in attention domain, which indicated the existence of a joint effect (p trend = 0.008; Supplementary Table 3). Similar joint effects in attention domain were also observed when combining KD with thinning in AD signature area (p trend = 0.02), frontal (p trend = 0.009), occipital (p trend = 0.01), limbic (p trend = 0.02), and insular (p trend = 0.02) lobes (Fig. 2). Other notable joint effects with the same direction as attention domains existed in global cognition (MoCA-T) with combination of KD and thinning in global (p trend = 0.01) or occipital (p trend = 0.04) lobes; executive function domain with combination of KD and thinning in AD signature area (p trend = 0.04) or frontal (p trend = 0.02) lobes; and logical memory domain with combination of KD with thinning in global (p trend = 0.02), AD signature area (p trend = 0.02), and limbic (p trend = 0.002) lobes.
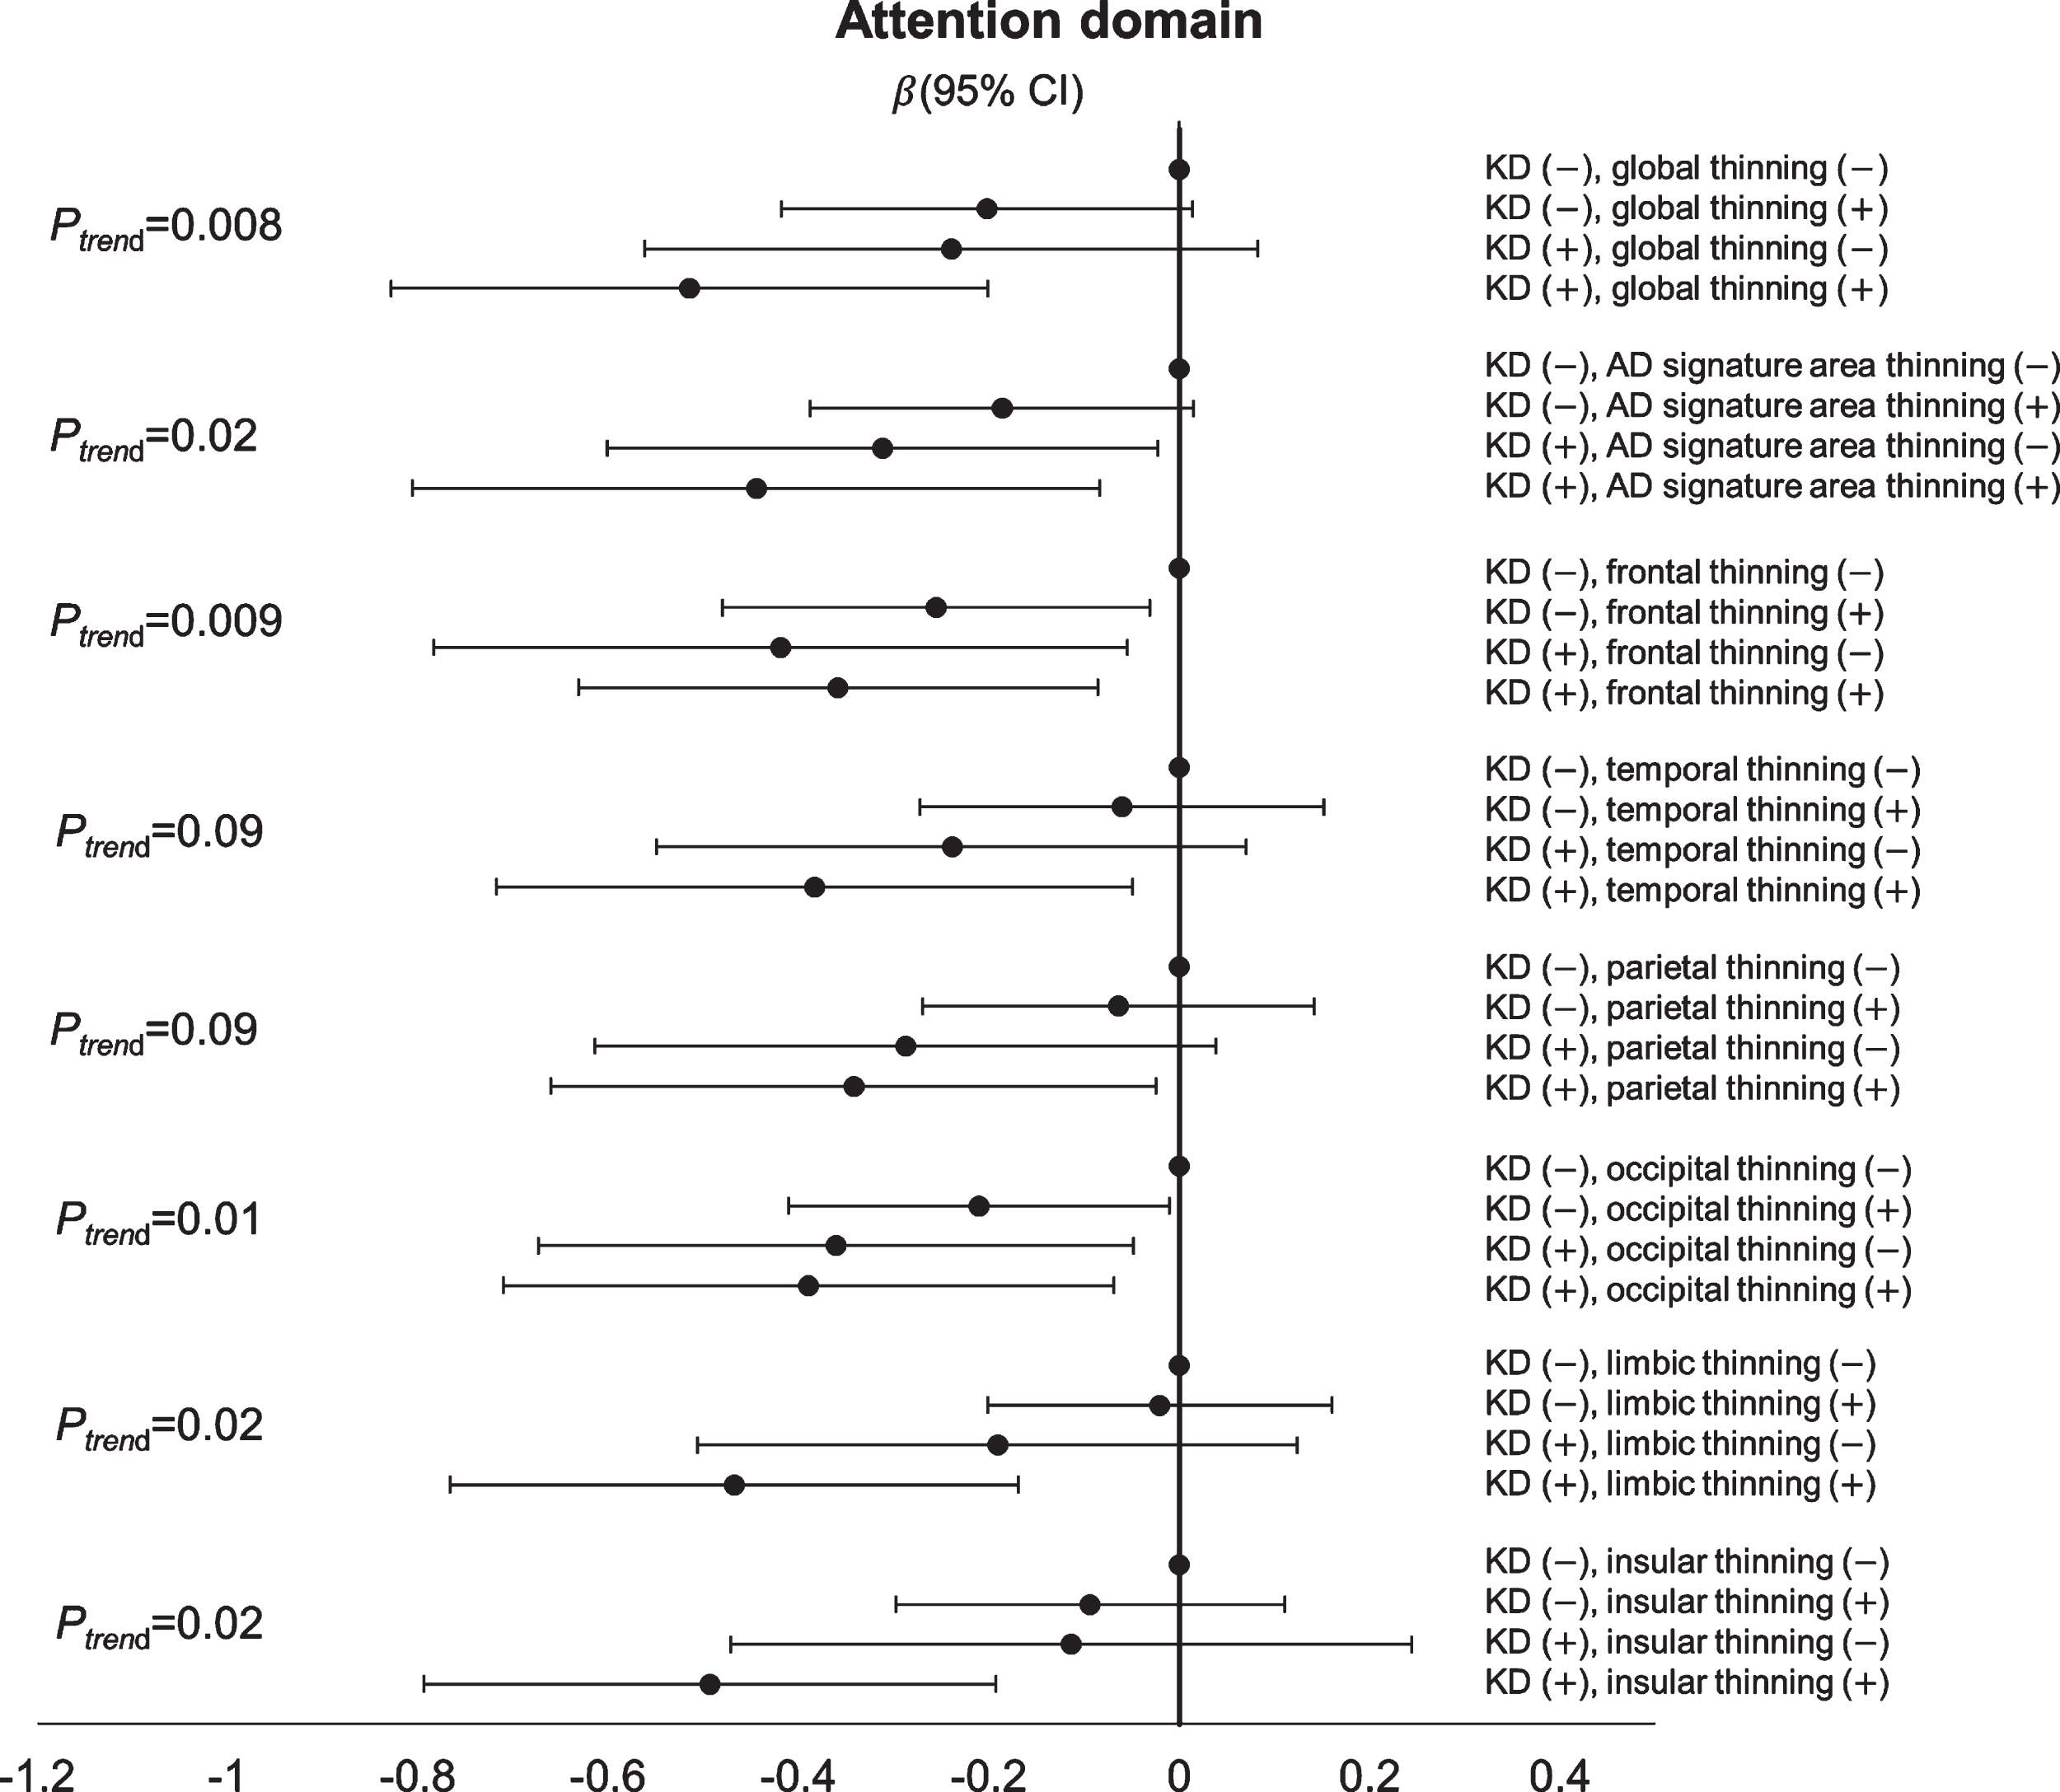
Joint effect of kidney dysfunction and cortical thinning on attention domain. The figure showed that the joint effect existed on the change of attention domain, such that a trend was observed with worse attention function (β< 0) toward participants with both kidney dysfunction and regional cortical thinning (global, AD signature area, frontal, occipital, limbic, and insular lobes) compared with those without either condition.
DISCUSSION
This longitudinal cohort study showed that in a group of non-demented community dwelling older adults, baseline KD resulted in decline of attention function, while cortical thinning was associated with poor logical memory over time. In addition, KD modified the relationship between thinning in global, frontal, and limbic lobes and logical memory. KD and cortical thinning had joint effects on cognitive impairment, including global cognition, attention, executive function, and logical memory. To the best of our knowledge, this is the first study combining kidney parameters and cerebral cortical morphology to evaluate their effects on cognitive change.
In early stage of CKD, decline in attention and executive function were commonly noted [35]. In a meta-analysis, almost every cognitive domain was impaired in patients with CKD, while the performance of orientation, attention, and language were particularly affected [7]. The present study was consistent with findings above that baseline KD was associated with decline in attention and executive function over 4 years. This phenomenon of “slowness” or “dysexecutive” cognitive profile in patients with CKD, contrast to the common finding of early memory decline in typical AD, might indicate that a vascular cognitive impairment predominantly contributed to the underlying pathophysiology [36].
Only few previous studies investigated the interplay between kidney function, brain morphology, and longitudinal cognitive change. One Japanese study focused on the role of deep WML in community-dwelling older people, and they found that deep WML was associated with worse cognitive function, and baseline CKD may predict the progression of deep WML within 5 years [14]. Another Japanese study found that baseline CKD predict mild cognitive impairment or dementia over a median of 7.5 years, and the association persisted even after controlling of various MRI markers of cerebral small vessel disease (SVD) [15]. One study included 68 older patients with diabetes mellitus and performed repeated MRI and cognitive tests over 4 years, and they found that albuminuria was associated with cognitive decline, while no effects were seen on the change of MRI markers [16]. In a cohort of post-stroke older patients, baseline CKD was associated with brain atrophy and larger WML, and also linked to worse cognitive performance and incident dementia over time [17]. They further demonstrated that presence of both diabetes mellitus and CKD was associated with abnormal brain structure and quadrupled the risk of cognitive decline in the same cohort [18].
As studies above, brain lesions that related to SVD, such as silent brain infarct or WML, were the main focus in CKD related cognitive impairment. It was not surprising because a systemic SVD can affect both the brain and kidney, resulting in classical MRI findings of cerebral SVD in the brain and glomerular dysfunction and proteinuria in the kidney [6, 37]. Beyond vascular process, additional pathway linking CKD to cognitive decline included oxidative stress, inflammation, uremic toxin, malnutrition, or anemia [6, 15]. The effects of these factors on the brain morphological change might not be explicit though, not to say in the early stage of CKD. Cortical thickness, a validated biomarker for dementia and an intuitive index of neurodegeneration, might play a role between CKD and cognitive decline beyond SVD.
In our analyses, we found that baseline cortical thinning in frontal, temporal, and parietal areas as well as global thinning, can predict decline in verbal fluency over 4 years. In our cohort, verbal fluency test was the only cognitive domain showing consistent decline over time (Fig. 1), suggesting the difficulty of the task. Verbal fluency test not only involved participants’ language function, but also their executive function and attention [38], and they were highly dependent on the fronto-temporo-parietal circuits. Besides, cortical thinning in global, AD signature area, temporal, occipital, and insular lobes were independently associated with change in logical memory. This observation echoed some recent studies that AD signature area thickness was not only predictive of clinical evident AD [21], but also a biological marker of memory function in adults [39 –41]. Meanwhile, cortical thinning in frontal lobe was significantly associated with poor attention and executive function over time. Prefrontal cortex has been implicated in attention and executive function, and CTh of fronto-parietal network also predicts executive performance in older adults [42, 43]. The above associations remained independent even after adjustment of WML, which had significantly negative contribution to almost all cognitive domains in our analyses (data not shown). This might imply in addition to pure vascular pathology, an underlying amyloid and tau related neurodegeneration exerts its mechanism on the cortical thinning related cognitive changes [40, 41].
In our study, the effects of KD on logical memory was not significant in the primary model. However, in stratified analyses we found that KD might modify the relationship between certain regions of cortical thinning and memory, suggesting KD as an effect modifier. In our participants with KD, cortical thinning at baseline, especially the frontal and limbic lobes, was associated with better memory over time (β> 0). Similar finding was noted that in participants with KD, global thinning was associated with better global cognition (MoCA-T score). This counterintuitive finding was unexpected and had not been reported before, though some explanations could be suspected. One possible reason was that the contribution of WML to memory function in participants with KD. We found that after removing WML from the model, the β coefficient decreased slightly. Another explanation was that in participants with KD, they were more likely to suffer from neurodegeneration since they were older and had more vascular risk factors. At this stage, their CTh could not directly reflect their cognitive reserve, but paradoxically a survival bias was observed in those with thinner CTh [44]. That might explain why memory function was primarily affected since it was most closely related to the change of CTh. Still another possibility was that the finding was by chance or there were residual confounding factors not adjusted in the models. However, it was less likely since the interactions were found consistently in global, frontal, and limbic cortical thinning, and the models already contained several relevant covariates. Further studies to test the hypothesis on this curious finding are strongly warranted.
On the other hand, we demonstrated a joint effect of cortical thinning and KD on the impairment of multiple cognitive function, including global cognition, attention, executive function, and logical memory. As stated above, cortical thinning possibly indicated an amyloid or tau mediated neurodegeneration, while KD reflected a systemic SVD. Our findings might imply that even in non-demented older adults, both AD and vascular pathology already interacted and contributed to the cognitive decline in susceptible individuals [45]. A postulated mechanism linking KD, cortical thinning and cognitive change is summarized in Fig. 3.
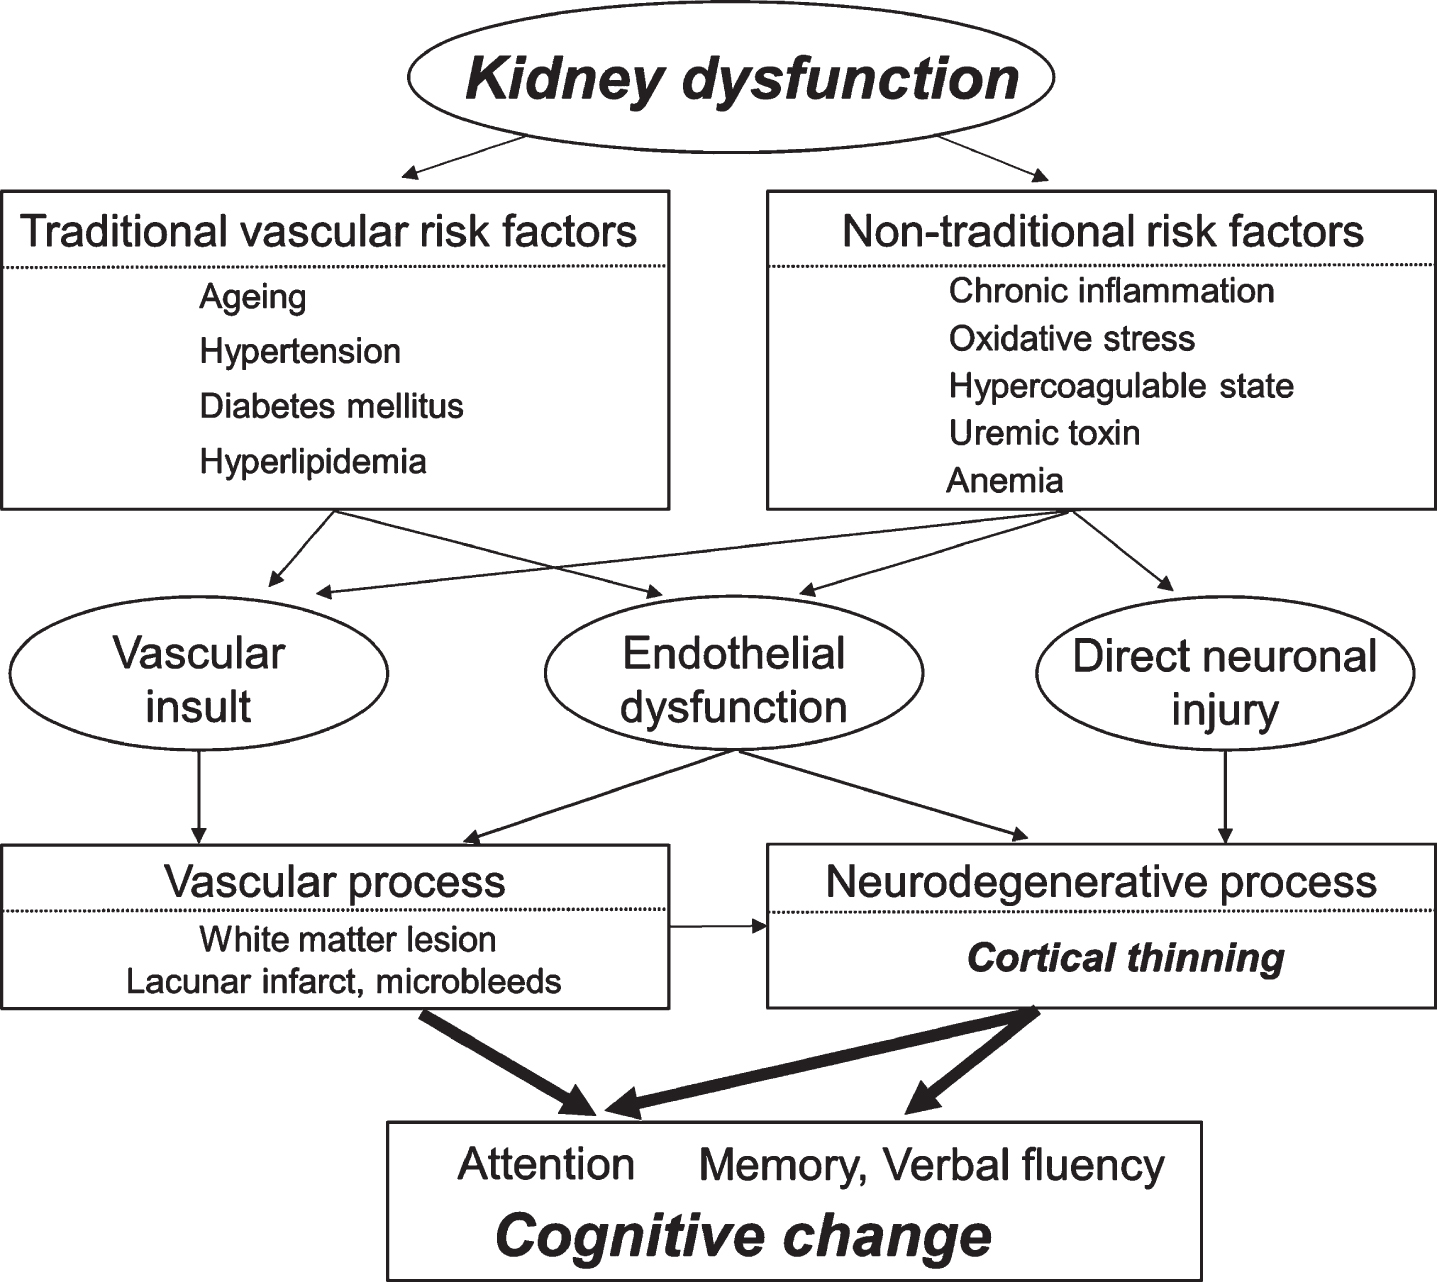
Postulated mechanism linking kidney dysfunction, cerebral cortical thinning, and cognitive change.
The strength of our study included a longitudinal follow-up at least 4 years to see the interplay between kidney function, brain morphology and cognitive change in a prospective cohort. In addition to commonly used neuroimaging markers of SVD, we also applied cerebral CTh to test its association. We not only assessed global cognition, but also individual cognitive domains since cognitive change might be subtle in non-demented individuals. We had also adjusted several important covariates including vascular risk factors and APOE ɛ4s status.
There were still several limitations in the present study. One of them was that we only used semi-quantitative analysis of proteinuria by urine dipstick and thus were unable to test the potential linear association between level of albuminuria and cognitive change. Secondly, we estimated GFR based on serum creatinine, which is known to be modulated by age, gender, muscle mass, and hydration status. A cystatin C-based GFR might be less affected by these factors especially in the older population [46]. Thirdly, we only measured the kidney function and performed MRI exam on the participants at baseline, and therefore could not evaluate whether change of kidney function or progressive cortical thinning was correlated with corresponding cognitive change. Lastly, the overall numbers of participants were relatively small, especially in the cases with KD, which may limit the statistical power and raise issues of overfitting. For example, although KD may play be the effect modifier between cortical thinning and cognitive score because of the significant interaction terms of KD×cortical thinning, the time interaction terms of KD×cortical thinning×time on the change of MoCA-T score (Table 2) were generally underpowered and nonsignificant. Therefore, our results should be interpreted cautiously as an exploratory analysis.
In conclusions, we found that presence of KD might modify the associations between CThand memory function, while that presence of both KD and cortical thinning had detrimental effects on several cognitive domains in non-demented, community dwelling older adults. Our work could be viewed as a pilot study, and further study is warranted to see whether strategies such as aggressive medical and lifestyle interventions to modify KD could have beneficial effects on cognitive change in the older population to prevent development of dementia.
Footnotes
ACKNOWLEDGMENTS
We thank all the participants that participated in this study. Funding for this study was provided by grants from the Ministry of Science and Technology in Taiwan (104-2314-B-002-038-MY3, 103-2314-B-002-033-MY3, 101-2314-B-002-126-MY3, and 100-2314-B-002-103).