
Abstract
Background:
Dysfunction of synaptic plasticity leads to memory impairment in Alzheimer’s disease (AD). Muscone (Mus) has shown neuroprotective effects in cerebral ischemic models. However, little is known of Mus effects on AD.
Objective:
To investigate the effects of Mus on memory functions and synaptic plasticity in 6-month-old APP/PS1 double-transgenic mice and explore the potential mechanisms.
Methods:
Mus was intraperitoneally injected into APP/PS1 or wild-type mice, and cognitive function was assessed by Novel object recognition and Morris water maze tests. The levels of amyloid-β (Aβ) were evaluated by immunofluorescence staining and ELISA. Synaptic morphology and plasticity were evaluated by Golgi staining and long-term potentiation. Cell viability was examined by Cell Counting Kit-8 assay. The protein levels of histone deacetylase 2 (HDAC2) were accessed by western blotting and Immunofluorescence staining. The protein levels of microtubule associated protein 2 and synaptophysin were analyzed by immunofluorescence staining. The ubiquitination of HDAC2 was examined by co-immunoprecipitation. The interaction of Mus with HDAC2 was predicted by molecular docking analysis.
Results:
Mus treatment attenuated memory dysfunction, reduced Aβ level, and enhanced synaptic plasticity in APP/PS1 mice. In addition, Mus treatment decreased the level of HDAC2 in the hippocampus of APP/PS1 mice and Aβ1–42-induced primary neurons, which might be associated with increased HDAC2 ubiquitination induced by HDAC2 and Mus interaction.
Conclusion:
Mus protected against synaptic plasticity and memory impairment in APP/PS1 mice, and enhanced HDAC2 degradation via ubiquitination, indicating that Mus was a potential drug for AD treatment.
INTRODUCTION
Alzheimer’s disease (AD), a neurodegenerative disorder, is characterized by cognitive, memory, personality, and mental impairment with the gradual development of disease [1]. The pathological features of AD include senile plaques of amyloid-β (Aβ) and neurofibrillary tangles composed of hyperphosphorylated tau. Tau plays a critical role in microtubule assembly and stabilization, and phosphorylated tau contributes to the pathogenesis of AD by inducing mitochondrial dysfunction, cytoskeletal dysfunction, and oxidative stress [2, 3]. However, Aβ has been considered as a trigger of AD, since Aβ is able to exacerbate tau hyperphosphorylation [2, 5]. In addition, increasing evidence has shown that synaptic plasticity dysfunction induced by Aβ plays a critical role in learning and memory impairments in AD early stage [6]. Extensive studies suggest that the synaptic plasticity dysfunction in AD brains represent as the synaptic structure damage, impaired transmission, and synaptic proteins decrease [7, 8]. Previous studies have shown that Aβ1–42 suppressed spontaneous synaptic activity via inhibiting P/Q-type and N-type calcium channels [9, 10]. Moreover, the Aβ-derived diffusible ligands, small neurotoxins in soluble Aβ oligomers, could alter the spine composition, density, and morphology in mature hippocampal neuron of AD brain [11–14].
In aging and AD animal models, the decrease of histone acetylation levels in brains, which is catalyzed by histone deacetylases (HDACs), is correlated to synaptic plasticity and learning behavior [15–17]. Considerable studies have shown that the HDAC family is closely correlated to synaptic plasticity of neurons [18, 19], and the inhibition of HDAC family (HDACi) provides a therapeutic strategy for learning and memory impairment [20–25]. HDAC2 is a member of class I HDACs [26], and is associated with the cognition function and synaptic plasticity [22, 27]. Previous studies have shown an increased level of HDAC2 in the brains of AD patients and AD mice [22, 28]. In addition, inhibition of HDAC2 has beneficial effects on the cognitive functions [29].
Natural musk has the functions of sedation, analgesia, detumescence, and pain relief, promoting blood circulation and removing blood stasis, and improving infantile convulsions [30]. Muscone (3-methylcyclopentadecan-1-one, Mus), a major component of native musk, has been used for treatment of cancer [31], chronic inflammation improvement [32], and stroke [33]. The two-dimensional (2D) chemical structure of Mus was shown in Fig. 1A, and the three-dimensional (3D) conformer of ball and stick with Hydrogens was shown in Fig. 1B. In addition, Mus is a main component of Xingnaojing injection [34], which improves the symptoms of AD as shown in our previous studies (unpublished). However, whether Mus could ameliorate cognitive deficiency in AD mice is not clear. In this study, we investigated that the protective effects of Mus against synaptic plasticity and memory deficits in AD mice.

Mus attenuated memory deficits in APP/PS1 mice. A) The 2D structure and CAS number of Mus. B) The 3D structure of Mus. C) Experimental design for the animal experiment. D, E) In the NOR test, the percent of explored time of the same object (D) and the novel object (E) were recorded (n = 8 13 mice per group). F-I) MWM test was performed to explore the spatial memory function. During the acquisition phase, the escape latency (F) of each group was analyzed. For the probe test in the day 6, the mean speed (G) and the times of platform location crossing (H) were recorded (n = 10∼11 mice per group). I) Typical images of tracing path of each group in the probe test. # #p < 0.01, # # #p < 0.001; *p < 0.05, **p < 0.01.
MATERIALS AND METHODS
Reagents and antibodies
Muscone (the purity: 97%) was purchased from Aladdin website (CAS: 541-91-3, Lot No. M141496; https://www.aladdin-e.com/zh_cn/), and dissolved in dimethyl sulfoxide (DMSO) to make stock solutions. The 6E10 antibody were bought from Biolegend (San Diego, USA). HDAC2 antibody was purchased from Cell Signaling Technology (Danvers, USA). Postsynaptic density protein 95 (PSD95), Microtubule associated protein 2 (MAP-2), synaptophysin (SYN), and ubiquitination (Ubi) antibodies were obtained from Abcam (Cambridge, USA). Acetylated histone H3 lysine 9 (Ac-H3K9) and GAPDH antibodies was purchased from Bioworld (Minneapolis, USA). Cycloheximide (CHX) and MG132 were purchased from MedChemExpress (New Jersey, USA).
Animals and treatment
Male APP/PS1 double-transgenic mice (APP/PS1 mice; background: C57BL/6J) were supplied by the Institute of Model Animal Research Center of Nanjing University, and male age-matched wild-type (WT) littermates were used as controls. All animal studies were reviewed and approved by the Animal Care Committee of Nanjing University (reference number: 20150105), and all efforts were made to reduce animal suffering. Mus (diluted with saline) was intraperitoneally (i.p.) injected into the 6-month-old APP/PS1 or the WT mice at approximately 10 : 00 am every day with saline+DMSO (<0.1%) as vehicle. fifteen days later, behavior tests were performed to access cognitive function, and then the mice were sacrificed for the other experiments. The timeline of experiments was showed in Fig. 1C.
Cognitive and behavioral tests
As previously described [35, 36], Novel object recognition test (NOR) was performed to detect the exploring memory of mice. Briefly, the mice were placed in the corner of an open chamber and habituated to the empty chamber freely for 10 min one day before the training session. In the training session, the mice were allowed to freely explore with two similar objects (A and B) for 10 min while recording. Then, one of the objects (B) was replaced by a novel one (C) differing in shape and color, with each mouse introduced to explore freely for 5 min. Before placing the next mice, the chamber was cleaned with 75% ethanol. Subsequently, the ANY-maze software (Stoelting, USA) was used to calculated the discrimination index which represents the time spent exploring the target object/total explored time during the test session.
Morris water maze (MWM) test was performed to evaluate spatial memory of the mice as previously described [37]. Briefly, during the acquisition phase (day 1 to day 5), the time spent finding the submerged platform and staying on it for 5 s was recorded and removed. The mouse was allowed to stayed on the platform for 0.5 min when it did not find it, and 60 s was recorded as its latency time. For the probe test in the day 6, the mice were allowed to swim freely for 60 s without platform. The swimming speed, times of platform crossing, and the tracing line were recorded. All the data were recorded and analyzed using the ANY-maze system (Stoelting, USA).
Primary cortical neuron culture
Primary cortical neuronal cultures were prepared from 15–17-day-old C57BL/6J mice embryos as previously described [38, 39]. The purity of the neurons was greater than 95% as determined by MAP-2 staining. At day-in-vitro (DIV) 9, the neurons were added the Aβ1–42 (2μM) (Millipore, Germany) for 26 h, and Mus (5 or 10μM) for 24 h. The CHX (0.1μM) or MG132 (1μM) were add 10 h before the following experiments were performed.
Cell viability assays
Primary cortical neurons were plated at 1×10⁵ cells/well in 96-well plates and treated with or without Mus or Aβ1–42 (2μM). After Mus treatment for 24 h, the culture media was removed. The Cell Counting Kit-8 (CCK-8; Dojindo Laboratories, Tokyo, Japan) was used to detect the neurons viability according to the manufacturer’s instruction. The absorbance was measured at 450 nm with a microplate reader.
Aβ extraction and measurements
As previously described [37], soluble and insoluble of Aβ were extracted and measured. The soluble fraction was respectively collected from the TBS buffer, 1% Triton X-100 (TBSX), and 70% formic aid (FA). The BCA protein assay kit (Bioworld, USA) and the Bradford protein assay kit (Bioworld, USA) were used to determine the TBS-soluble, TBSX-soluble, and FA-soluble protein levels. The amount of Aβ1–40 and Aβ1–42 was measured according to the manufacturer’s instructions by Quantikine ELISA Human Amyloid β aa1–40/aa1–42 Immunoassay kits (R&D System, USA).
Golgi staining
Golgi staining was performed as previously described [36], according to the manufacturer’s instructions of a FD Rapid Golgi staining kit (FD Neuro Technologies-Columbia, MD, USA), including solutions A to E. The brain tissues of mice were rapidly immersed in the mixture of solution A and B. The mixture was placed for 2 weeks (changed once within 24 h) at room temperature in the dark and then transferred to solution C for at least 3 days. Then, the samples were cut into 100μm thick sections using a cryostat microtome (Leica, Wetzlar, Germany). The sections were stained following the instructions of the kit. Finally, we sealed the slides with a neutral resin. The images were observed by inverted microscope (Olympus IX73, Japan) and analyzed by ImageJ NIH software.
LTP recordings
As previous described [36], the fresh hippocampal slices (300μm) were prepared and transferred it to the microelectrode array rapidly, recording data in 32°C with continuously perfused with oxygenated artificial cerebrospinal fluid (ACSF) (2 ml/min). Field excitatory postsynaptic potentials (fEPSPs) in the CA1 stratum radiatum were recorded by MEA-2100-60-System (Multi Channel Systems, Reutlingen, Germany). The slope of fEPSPs was measured to evaluate the input-output relationships of synapses. In the long-term potentiation (LTP) experiments, the half of the maximum evoked response was used as the stimulation intensity. The LTP was induced by high frequency stimulus (HFS, 100 Hz, 3 trains, 1 s duration, 10 s interval time). Initial slopes of fEPSP were normalized in each experiment by the averaged slope value during the control period. Data were acquired and analyzed by using LTP-Director software and LTP-Analyzer software respectively.
Real-time quantitative PCR
As previously described [39], total RNA was isolated from the hippocampal tissues using Trizol (Invitrogen, USA) and reverse-transcribed into cDNA with a PrimeScript RT reagent Kit (Takara, Japan). The real-time quantitative PCR (qPCR) experiment was performed using an ABI 7500 PCR instrument (Applied Biosystems, USA) through a SYBR green Kit (Applied Biosystems, USA) according to the manufacturer’s instructions with the normalized gene expression levels to GAPDH. The primers (Tsingke, China) were listed as follows:
HDAC2
Forward: CGGCAAGAAGAAAGTGTGCT;
Reverse: TCCATCGAACACTGGACAGT;
GAPDH
Forward: GCCAAGGCTGTGGGCAAGGT;
Reverse: TCTCCAGGCGGCACGTCAGA.
Immunofluorescence assay
The mice were perfused with pre-chilled 0.9% saline followed 4% paraformaldehyde, following anesthesia and scarified. The brain was dehydrated with 15% and 30% sucrose each for 24 h and cut into 18μm coronal sections by a cryostat microtome (Leica, Wetzlar, Germany). The slides and neurons were stained as previously described [38, 39]. After blocking with 2% Bovine Serum Albumin (BSA), the samples were immunostained with antibodies against 6E10 (1 : 500), MAP-2 (1 : 500), SYN (1 : 500), and HDAC2 (1 : 500) in 4°C overnight. On the second day, the sections were incubated with indicated secondary antibodies for 2 h at room temperature in the dark. The images were photographed under a fluorescence microscope (Olympus IX73, Japan).
Immunoprecipitation and western blotting
The neurons or tissues proteins were lysed with the lysis buffer (Thermo Fisher Scientific, Rockford, IL) for 0.5 h on ice. After centrifuging, the supernatants were immunoprecipitated with HDAC2 antibody (1 : 100) in 4°C overnight. The immunocomplexes were incubated with the Protein A/G Plus-agarose beads (Millipore, Germany). The BCA protein assay kit (Pierce Biotechnology, Rockford, IL, USA) was used to quantify the total protein. The extracts with equal quantities were subjected to 10–12% SDS-PAGE and transferred onto PVDF membranes (Millipore, Germany). After blocking in 5% slim milk for 2 h at room temperature, the membranes were incubated at 4°C overnight with the following primary antibodies: anti-PSD-95 (1 : 1000), anti-HDAC2 (1 : 1000), anti-Ac-H3K9 (1 : 1000), anti-Ubi (1 : 500) and anti-GAPDH (1 : 5000). Subsequently, the membranes were incubated with HRP-conjugated secondary antibodies at room temperature for 2 h. The protein levels were visualized using a Gel-Pro system (Tanon Technologies, Shanghai, China) and the band intensities were quantified with ImageJ NIH software.
Molecular docking
For molecular docking, the 3D structure of the HDAC2 protein was obtained based on sequence of house mouse (Gene ID: 15182) for modeling and geometrically optimized by Avogadro version 1.2.0. Standard Ligand Molecule preparation were performed before docking as previously described [40]. AutoDock Vina in the PyRX 0.8 Virtual Screening Tool was used to subject ligand to molecular docking. The structural molecular docking of Mus and HDAC2 were shown as surface and cartoon using PyMOL version 1.7.4.5.
Statistical analysis
All results were expressed as mean±SEM and analyzed using GraphPad Prism 7.00 (GraphPad, USA). Student’s t-test was used for comparison between two groups. For three or more groups, Bonferroni’s post hoc test was used for further comparison when a significant difference was found in one or two-way analysis of variance (ANOVA): The escape latency for the MWM tests were analyzed using two-way ANOVA with repeated measures. Sholl analyze for the Golgi staining and the fEPSP slope of hippocampal slices for LTP were analyzed by two-way ANOVA, while the other multi-groups comparisons were analyzed by one-way ANOVA. p < 0.05 were considered statistically significant.
RESULTS
Mus ameliorated cognitive deficits of APP/PS1 mice
To investigate whether Mus protected against memory deficits in AD mice, the NOR and MWM tests were performed. In the NOR test, there was no significant difference of the searching time between object A and B in the 10 min habituation (Fig. 1D), which suggested that the mice in different group had no disturbance of preferred exploring location. However, the time to explore the new object C of APP/PS1 mice was significantly decreased compared with that of WT mice, while Mus treatment could partially rescue it in APP/PS1 mice (F (3, 38) = 5.801, p = 0.0023; Fig. 1E).
MWM tests were performed to explore whether Mus could improve spatial memory in APP/PS1 mice. As shown in Fig. 1F, the average escape latency in APP/PS1 mice was increased compared with that of WT mice, while Mus treatment significantly decreased the escape latency of APP/PS1 mice (groups: F (3, 180) = 37.31, p < 0.001; days: F (4, 180) = 45.68, p < 0.001; group × day: F (12, 180) = 2.278, p = 0.0102). During the probe test, the mean speed of swimming had no statistically significant difference among the four groups (F (3, 38) = 0.5675, p = 0.6398; Fig. 1G). However, the times of crossing platform in Mus treated APP/PS1 mice were significantly increased compared with that of the APP/PS1 group (F (3, 38) = 9.51, p < 0.001; Fig. 1H, I), indicating that Mus improved spatial memory function in APP/PS1 mice.
Mus reduced Aβ levels in the brains of APP/PS1 mice
To explore the effects of Mus on Aβ deposition, the level of Aβ was determined by ELISA and immunofluorescence in the brains of APP/PS1 mice. Mus significantly decreased the levels of TBS-soluble, TBSX-soluble, and FA-soluble Aβ1–40 and Aβ1–42 in APP/PS1 mice (p = 0.0145 for TBS, p = 0.0142 for TBSX, p < 0.001 for FA, Fig. 2A; p = 0.03 for TBS, p = 0.0153 for TBSX, p = 0.0268 for FA, Fig. 2B). The results of Aβ Immunofluorescence revealed that Aβ plaque numbers and the percentage of plaque areas in the cortex or hippocampus of APP/PS1 mice were significantly decreased after Mus treatment (p = 0.0053 for cortex, p = 0.0077 for hippocampus, Fig. 2C, D; p < 0.001 for cortex, p < 0.001 for hippocampus, Fig. 2C, E).
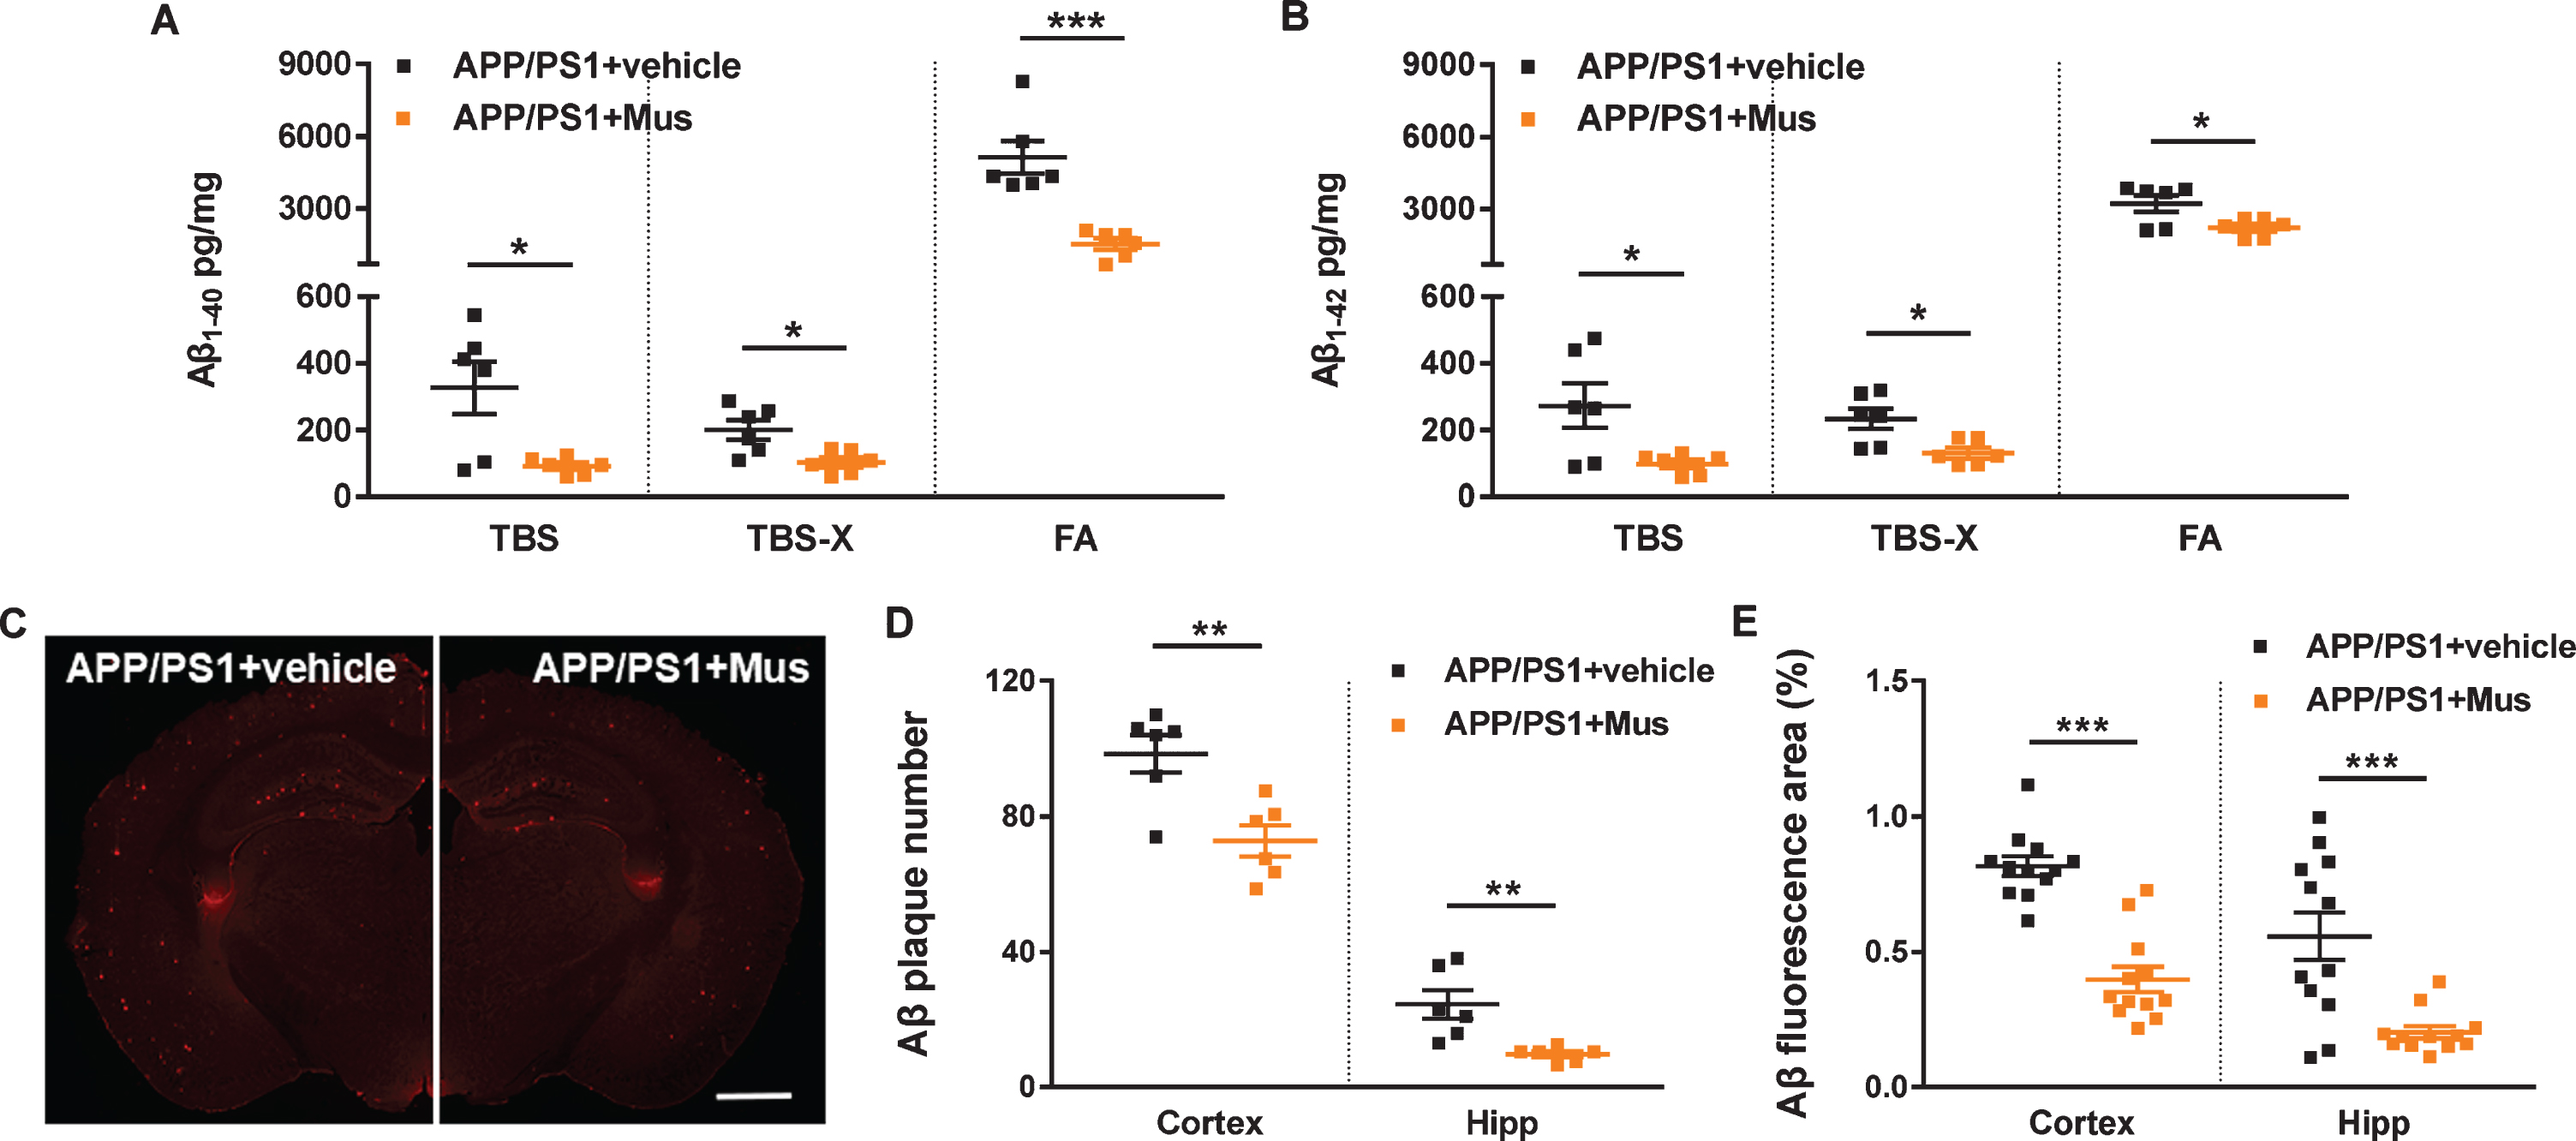
Mus treatment decreased Aβ levels in the brains of APP/PS1 mice. A, B) In the ELISA test, the levels of Aβ1–40 (A) and Aβ1–42 (B) in the TBS-, TBS-X-, and FA-soluble fraction in the brain were determined (n = 6 mice per group). C) Typical images of Aβ plaques in the brains of APP/PS1 mice with or without Mus treatment. Scale bars = 1 mm. The number of the Aβ plaque (D) and the percent of Aβ fluorescence area (E) in the brains were quantified respectively. *p < 0.05, **p < 0.01, ***p < 0.001.
Mus enhanced synaptic plasticity in the CA1 region of APP/PS1 mice
Next, we explored the effects of Mus on basal synaptic structure, transmission, and synaptic proteins of hippocampal neurons in APP/PS1 mice. As shown in Fig. 3A and 3B, the level of PSD95 of APP/PS1 group was significantly decreased compared with that in WT group, while Mus treatment could significantly increase the PSD95 level (F (3, 23) = 14.81, p < 0.001). In addition, we detected the synaptic structure (Fig. 3C) and dendritic spine densities (Fig. 3E) in the CA1 region by Golgi staining. As shown in Fig. 3D, Sholl analysis revealed that the morphological structure of neuron in CA1 region of APP/PS1 group was significantly less complex than that in WT group, which could be rescued by Mus treatment (groups: F (3, 340) = 67.05, p < 0.001, distance: F (16, 340) = 140.3, p < 0.001; groups × distance: F (48, 340) = 4.699, p < 0.001). Moreover, the spine density of Mus treated APP/PS1 mice was much higher than that in APP/PS1 group (F (3, 28) = 3.445, p = 0.030; Fig. 3F), of which the mushroom spine density was significantly increased (F (3, 28) = 22.56, p < 0.001; Fig. 3G). Collectively, these results demonstrated that Mus treatment promoted dendrite branching of hippocampal neurons of APP/PS1 mice.

Mus treatment promoted synaptic plasticity of hippocampal neurons in the APP/PS1 mice brains. A) The levels of PSD95 in the hippocampus of each group were examined by western blotting. B) Quantification of the signal intensities of PSD95 normalized to GAPDH as a loading control (n = 3∼8 mice per group). C) Low-magnification microphotographs of the of CA1 region of hippocampal depicted in the Golgi stain., Scale bar = 50μm. D) Schematic diagram of the Sholl analysis of neurons and the number of branch crossings along the Sholl grid (n = 6 neurons and N = 3 mice per group). E) Typical images of dendrite morphology of each group. F, G) The quantitative analysis of the total dendritic spine density (F) and the mushroom spine density (G) in each group respectively (n = 8 spines and N = 3 mice per group). H) The fEPSP amplitude of hippocampal slices with or without Mus treatment of APP/PS1 mice. I) Typical traces of fEPSC at baseline and 60 min after HFS and LTP magnitudes of hippocampus slices in the CA1 region of APP/PS1 mice with or without Mus treatment (n = 23 slices from 5 mice). Scale bar = 30 ms. J) The averages of normalized fEPSP slopes in the last 5 min of LTP recording (n = 18 slices from 4 mice). #p < 0.05, # #p < 0.01, # # #p < 0.001; *p < 0.05, **p < 0.01, ***p < 0.001.
Then, we explored the basal synaptic transmission and synaptic plasticity of hippocampal neurons in APP/PS1 mice treated with Mus. As stimulus intensity increased, the fEPSP slope of hippocampal slices was significantly increased in Mus treated mice comparing with APP/PS1 group (group: F (1, 315) = 31.4, p < 0.001; stimulus intensity: F (9, 315) = 13.14, p < 0.001; group × stimulus intensity: F (9, 315) = 0.7378, p = 0.6741; Fig. 3H), indicating synaptic transmission rescued. The synaptic strength was examined by LTP, which revealed that Mus treated mice presented higher LTP magnitudes after HFS stimulated (n = 23 slices from 5 mice, Fig. 3I). For the last 5 min of recording, Mus treated mice presented higher averages of normalized fEPSP slopes compared with APP/PS1 group (p < 0.001, n = 18 slices from 4 mice, Fig. 3J). These data demonstrated that Mus rescued long-term synaptic plasticity impairment significantly in APP/PS1 mice.
Mus protected against Aβ1–42-induced neuronal death and morphological changes
To further examine the effects of Mus on Aβ1–42-induced neurotoxicity, CCK-8 assay and immunofluorescence were used to examined the neuronal viability and structure in the primary cortical neuron. As shown in Fig. 4A, the neuronal viability was decreased when Mus concentration reached 20μM (F (10, 92) = 5.908, p < 0.001). Aβ1–42 treatment significantly decreased neuronal viability in CCK-8 assay, whereas 5 or 10μM Mus treatment for 24 h partially reversed these effects (F (6, 77) = 40.99, p < 0.001; Fig. 4B). In addition, the Aβ1–42 induced damage of neurons was ameliorated by 10μM Mus as demonstrated by MAP-2 (F (3, 32) = 11.31, p < 0.001; Fig. 4C, D) and SYN (F (3, 32) = 6.702, p = 0.0012; Fig. 4C, E) staining, while Mus treatment at the dosage of 5μM did not affect the level of MAP-2 and SYN (Fig. 4C–E). These results showed that Mus could improve the neuronal viability and morphology in Aβ1–42 treated neurons.

Mus protected against Aβ1–42-induced neuronal death and morphological changes. The viability of primary cortical neurons treated with various concentrations of Mus without (A) or with Aβ1–42 (B) was determined by CCK-8 assay. C) Typical images of MAP2 (red) and SYN (green) in neurons. Scale bar = 50μm. D, E) Total immunoreactive area was measured for MAP-2 (D) and SYN (E). Various concentrations of Mus versus Ctl in (A), **p < 0.01, ***p < 0.001; Various concentrations of Mus versus Aβ in (B), *p < 0.05, ***p < 0.001; Ctl versus Aβ in (B), # # #p < 0.001.
Mus decreased HDAC2 level via the ubiquitination pathway in AD models
The level of histone acetylation depends on the dynamic maintenance of histone acetyltransferases (HATs) and HDACs [41, 42], and HDAC2 plays a critical role in memory and synaptic functions [22]. Based on the 3D structure of Mus (Fig. 1B), docking analysis by computer modeling was used to create a potential model for binding of Mus and HDAC2 protein. The results implied that Mus might insert into the HDAC2 protein binding pocket shown as cartoon and molecular surface (Fig. 5A).
Next, we sought to determine whether Mus could decrease the level of HDAC2, and found that HDAC2 was significantly decreased after Mus treatment in the hippocampus of APP/PS1 mice by Immunofluorescence (p < 0.001; Fig. 5B, C). Similar result was observed using western blotting (F (3, 21) = 8.993, p < 0.001; Fig. 5D, E). In addition, we detected that the protein level of Ac-H3K9 was increased in hippocampus of APP/PS1 mice with Mus treatment (F (3, 12) = 29.3, p < 0.001; Fig. 5D, F). In vitro, Mus treatment significantly reduced the level of HDAC2 in Aβ1–42-induced neuron (F (3, 12) = 6.547, p = 0.0072; Fig. 5G, H). In addition, the level of Ac-H3K9 was also increased in Aβ1–42-induced neuron with Mus treatment (F (3, 8) = 12.87, p = 0.002; Fig. 5G, I). Interestingly, the mRNA of HDAC2 was not changed in APP/PS1 mice treated with Mus (p = 0.8293, Fig. 5J). Therefore, we speculated that the reduction of HDAC2 was associated with the translational or post-translational modification.
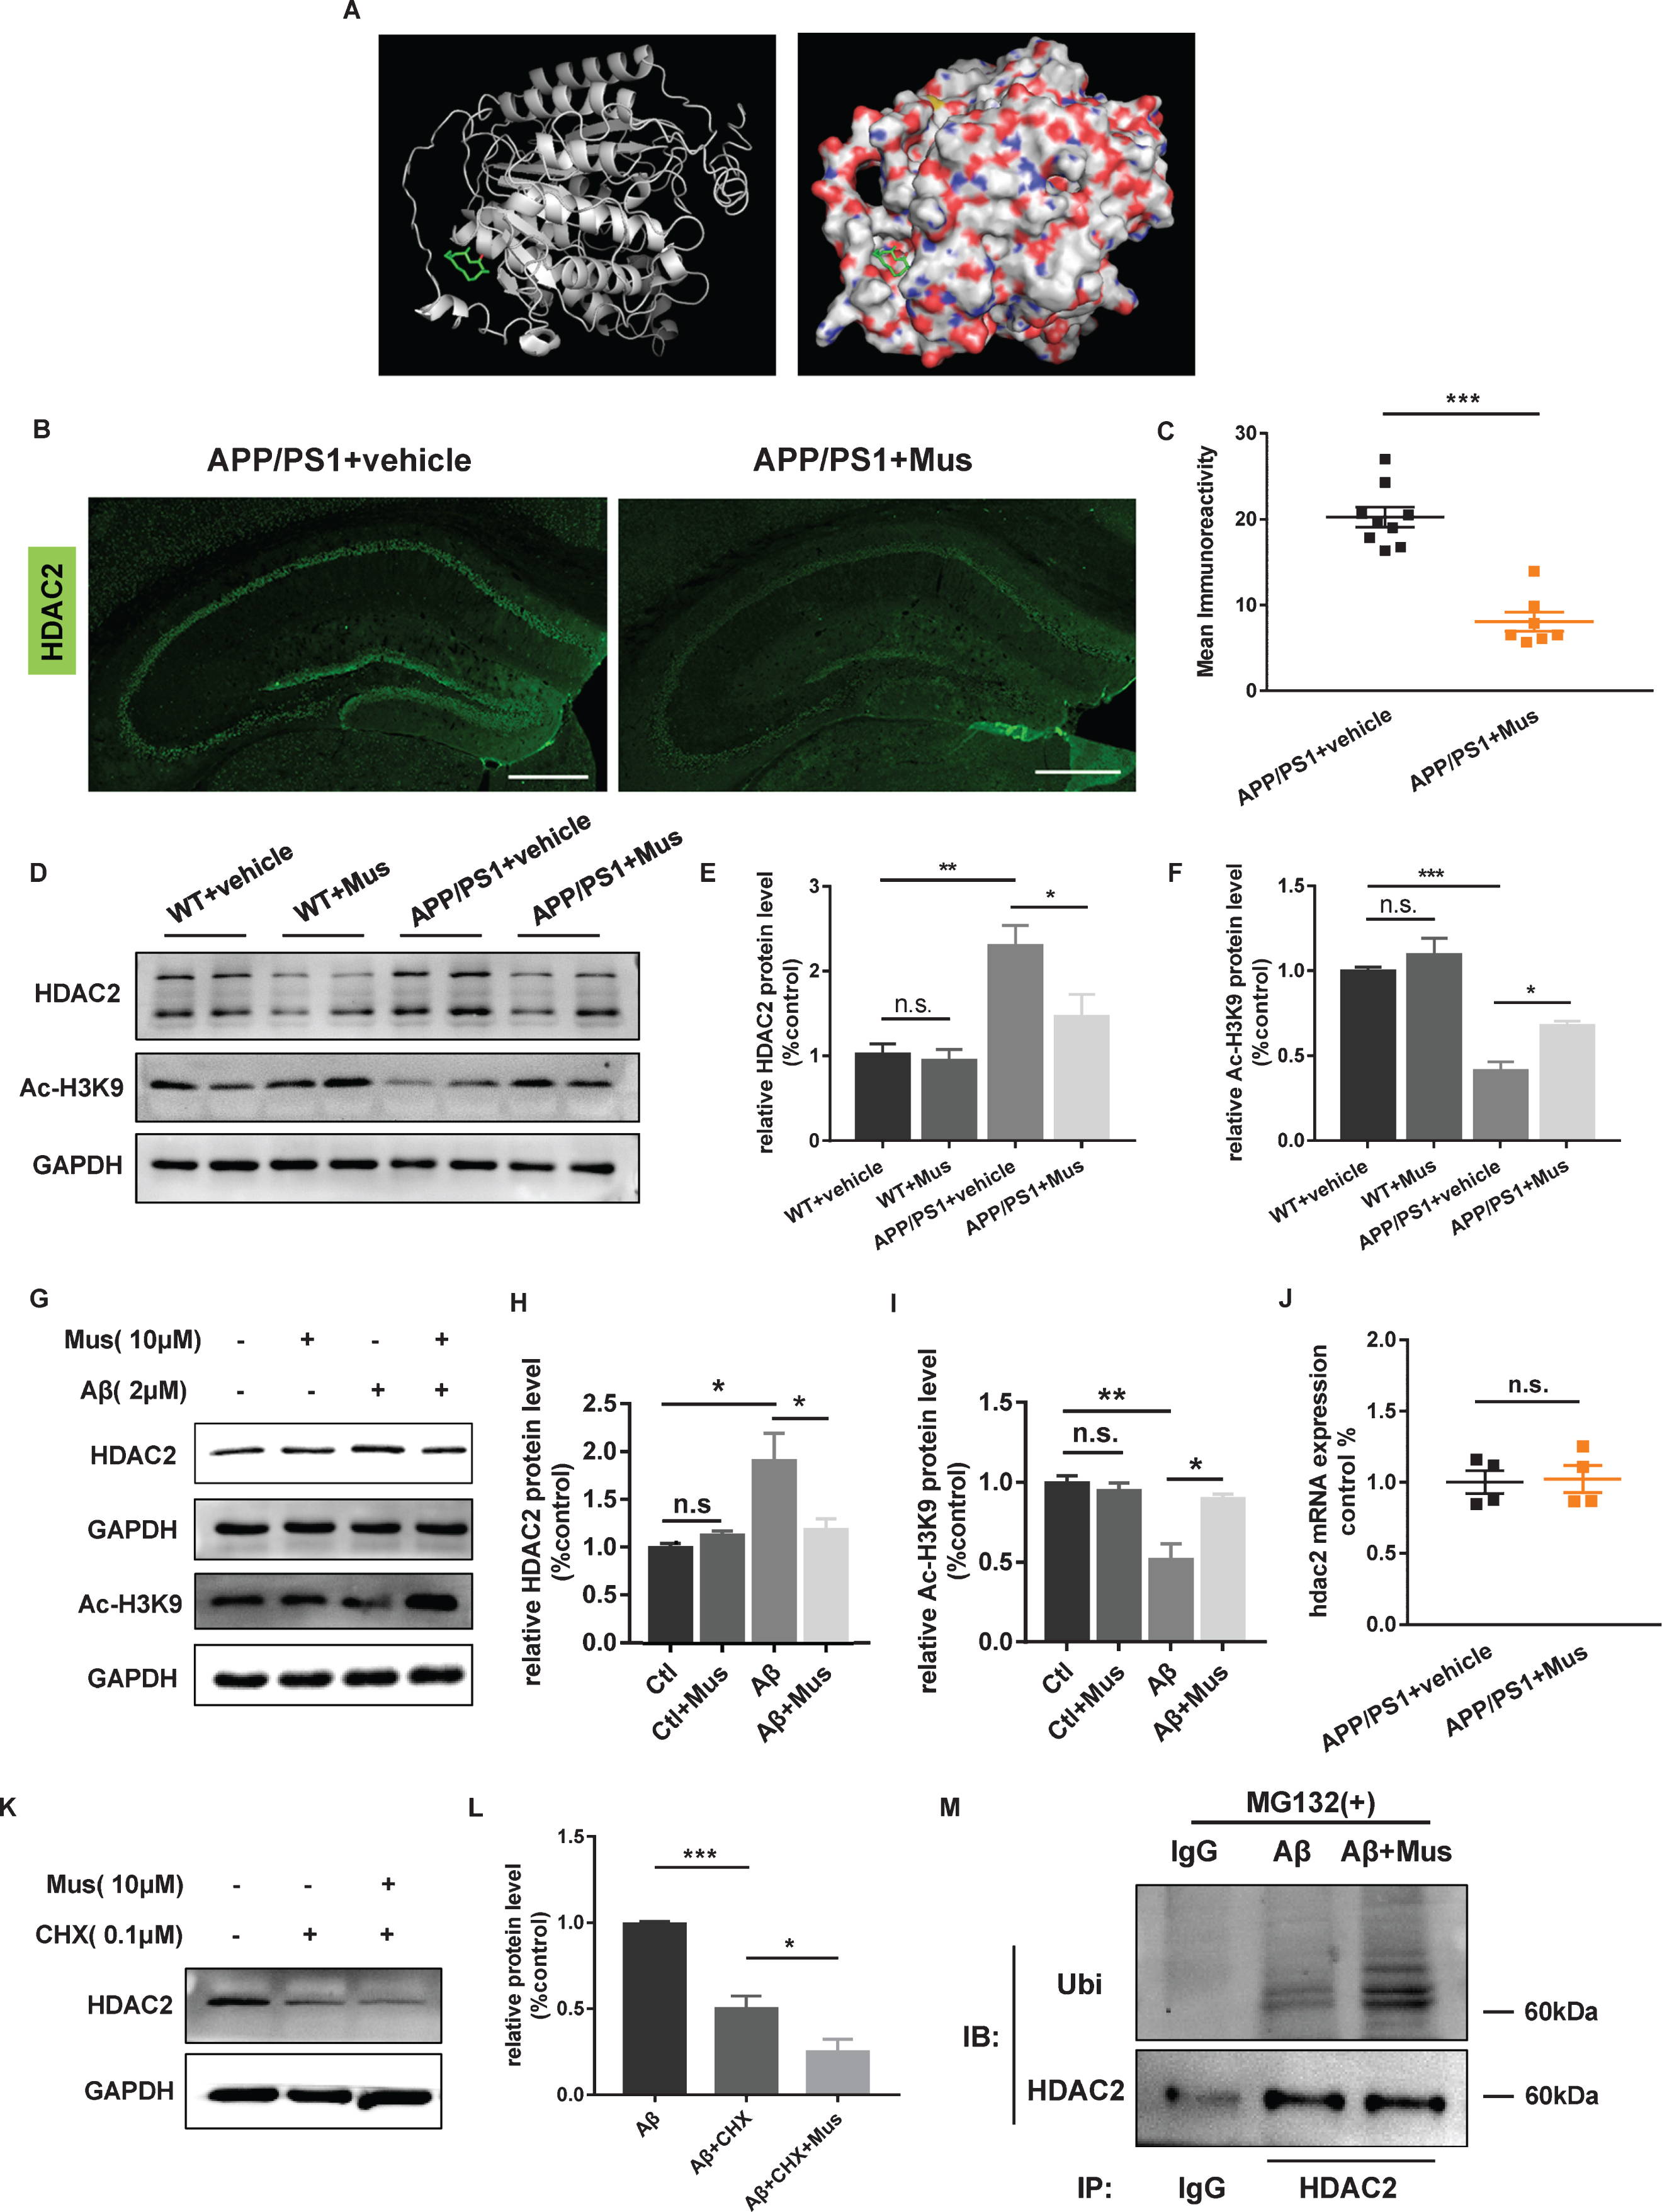
Mus treatment decreased the protein level of HDAC2 via the ubiquitination pathway. A) Docked structure and interactions of Mus binding to HDAC2. Left panel shows as the cartoon and the right showed as the molecular surface in the binding. B) The level of HDAC2 was detected in the hippocampus of APP/PS1 mice by Immunofluorescence assay. Scale bar = 500μm. C) Quantitative image analysis was performed for HDAC2 immunoreactivity. D) The levels of HDAC2 and Ac-H3K9 in the hippocampus were examined by western blotting. E, F) Quantification of the signal intensities of HDAC2 (E, n = 6 mice per group) and Ac-H3K9 (F, n = 4 mice per group) normalized to GAPDH as a loading control. G) The levels of HDAC2 and Ac-H3K9 in primary neurons. H, I) Quantification of the signal intensities of HDAC2 (H, n = 4 mice per group) and Ac-H3K9 (I, n = 3 mice per group) normalized to GAPDH as a loading control. J) The HDAC2 mRNA expression was detected by qPCR after Mus treatment in the hippocampus of APP/PS1 mice. K) Primary cortical neurons were treated with CHX (0.1μM) and Mus (10μM), and the levels of HDAC2 and GAPDH were examined by western blotting. L) Quantification of the signal intensities of HDAC2 (n = 4 mice per group) normalized to GAPDH as a loading control. M) Cells were treated with MG132 (1μM) and then with Aβ1–42 and Mus. HDAC2 and Ubi protein levels were determined by co-immunoprecipitation. *p < 0.05, **p < 0.01, ***p < 0.001.
To further validate whether the effect was due to reduced protein production or increased degradation, we used CHX to block the protein production in Aβ1–42 stimulated neurons. The results showed that Mus treatment augmented CHX induced inhibition of HDAC2 (F (2, 9) = 39.83, p < 0.001; Fig. 5K, L), indicating that Mus might promote the degradation of HDAC2 protein. Next, we used MG132 to inhibit proteasome function to observed the ubiquitinated level, and found that Mus increased the ubiquitination of HDAC2 in Aβ1–42 and MG132 induced neurons (Fig. 5M). Collectively, these results showed that Mus might bind to HDAC2 and enhance HDAC2 degradation by ubiquitination in AD models.
DISCUSSION
In this study, we have demonstrated for the first time that Mus treatment rescued synaptic dysfunction and cognitive deficits in APP/PS1 mice. In addition, Mus treatment reduced the Aβ levels and amyloid load in the brains of APP/PS1 mice. Moreover, Mus enhanced HDAC2 degradation by ubiquitination in AD models, which indicated that Mus might be a potential drug for AD treatment.
Mus, the main active ingredient extracted from natural musk, has less toxicity and side effects compared with the natural musk, and thus is widely used in clinical studies [43]. Currently, Mus has been used for the treatment of myocardial infarction [32], diabetic peripheral neuropathy [44], alcohol-induced osteonecrosis of the femoral head [45], and cerebral vascular diseases [46]. Previous studies have shown that Mus could inhibit NF-κB and Nod-like receptor protein 3 (NLRP3) inflammasome activation [32] and Wnt/β-catenin signaling pathway [30]. Mus also modulates the autophagy and apoptosis by AKT/mTOR signaling pathway [44], and alleviates cell viability by reducing the release of lactate dehydrogenase [47]. In the treatment of cerebral vascular diseases, administration of Mus improves the permeation of blood-brain barrier induced by P-gp and MMP-9 inhibition [46]. Here, our study showed that Mus was able to ameliorate the searching time to explore the new object in NOR and the explore ability for platform in MWM, which suggested the cognitive deficiency in APP/PS1 mice was rescued. In addition, Mus treatment could reduce the amyloid load in the brains of APP/PS1 mice, and whether the decrease was due to amyloid-β protein precursor (AβPP) production inhibition or Aβ clearance promotion, and the other pathological features of AD including tau phosphorylation and glial reactivation, needs further investigation. Moreover, we mainly explored the effects of Mus on the cognitive impairment of AD, and the other neurocognitive disorders including anesthesia neurotoxicity and the associated perioperative cognitive dysfunctions will be studied in the following experiments.
Synaptic plasticity impairment has been considered to be the strongest mechanism of cognitive deficiency of AD pathology from developing dementia [48, 49]. Aβ deposition, one of the classical hallmarks of AD, is deeply involved in the impairment of synaptic plasticity through affecting presynaptic, postsynaptic and trans-synaptic [50]. It is reported that Aβ accumulation disrupts the synaptic function via altering calcium dynamics and spine disassembly before synapse loss in AD [51]. One of the severely detrimental effects on synaptic function is the loss of synapse-associated proteins, such as PSD95 [52, 53]. Previous studies have shown that the damaged synaptic function could be confirmed by LTP impairment through electrophysiological test [54]. In addition, previous studies have shown that synaptic function is linked to the morphology of dendritic spines [55]. For example, the density of thin and mushroom spines is more essential than that of stubby spines for cognitive maintenance [49]. Here we observed synaptic plasticity impairment evidenced by synaptic protein, neuron processes and dendritic mushroom spine density decreased, LTP inhibition and memory deficits in APP/PS1 mice, while treatment of Mus could rescue the dysfunction.
Recent studies have shown that the epigenetic modifications, particularly histone acetylation induced by HDACs, play a critical role in regulating gene expression for learning and memory [56]. HDAC2, mainly localized in the nucleus, plays negative roles in synaptic plasticity and development of neuron [22, 58]. Using AD models, emerging evidence suggests a critical role of HDAC2 in AD pathogenesis, such as the Aβ oligomer-induced synaptic dysfunction [59], the AβPP process, and memory impairment [27]. HDAC2 knockdown ameliorates the neurite outgrowth deficits via increasing histone H3 Lys9 acetylation (Ac-H3K9) levels [60] and regulates the synaptic protein [28]. In addition, HDAC2 inhibition prevents Aβ-induced neurotoxicity and mitochondrial dysfunction by enhancing endophilin-B1 expression [61]. Here, our results showed that Mus treatment suppressed the level of HDAC2 and upregulated the level of Ac-H3K9. Interestingly, we found that Mus only inhibited the expression of HDAC2 in the protein level, which might be associated with enhanced ubiquitination degradation. Ubiquitin-specific peptidase 4 (USP4) interacts with and deubiquitinates HDAC2, leading to p53 and NF-κB inhibition upon DNA damage [62]. In addition, HDAC2 ubiquitination and degradation induced by Mcl-1 ubiquitin ligase E3 (Mule) plays a key role in DNA damage-induced apoptosis [63], which indicates that ubiquitination affects the function of HDAC2 and contributes to cell survival. Thus, we speculated that Mus might bind to and inhibit HDAC2 expression by promoting ubiquitination mediated degradation in AD models.
Conclusion
In conclusion, our results showed that Mus treatment ameliorated learning and spatial memory impairment, decreased Aβ deposition and toxicity, and promoted hippocampal neuronal dendrite branching and synaptic plasticity in AD mice, which might be associated with its degradation of HDAC2 via ubiquitination.
Footnotes
ACKNOWLEDGMENTS
This research was supported by the National Natural Science Foundation of China (81630028, 81920108017, 81671055, 81971009), The National Key Research and Development Program of China (2016YFC1300504, 2018YFC1704405), the Key Research and Development Program of Jiangsu Province of China (BE2016610), Jiangsu Province Key Medical Discipline (ZDXKA2016020).