
Abstract
Background:
Cognitive dispersion, variation in performance across cognitive domains, is posited as a non-invasive and cost-effective marker of early neurodegeneration. Little work has explored associations between cognitive dispersion and Alzheimer’s disease (AD) biomarkers in healthy older adults. Even less is known about the influence or interaction of biomarkers reflecting brain pathophysiology or other risk factors on cognitive dispersion scores.
Objective:
The main aim of this study was to examine whether higher cognitive dispersion was associated with cerebrospinal fluid (CSF) levels of amyloid-β (Aβ42), total tau (t-tau), phosphorylated tau (p-tau), and amyloid positivity in a cohort of older adults at various severities of AD. A secondary aim was to explore which AD risk factors were associated with cognitive dispersion scores.
Methods:
Linear and logistic regression analyses explored the associations between dispersion and CSF levels of Aβ42, t-tau, and p-tau and amyloid positivity (Aβ42 < 1000 pg/ml). Relationships between sociodemographics, APOE ɛ4 status, family history of dementia, and levels of depression and dispersion were also assessed.
Results:
Dispersion did not emerge as associated with any of the analytes nor amyloid positivity. Older (β= –0.007, SE = 0.002, p = 0.001) and less educated (β= –0.009, SE = 0.003, p = 0.009) individuals showed greater dispersion.
Conclusion:
Dispersion was not associated with AD pathology, but was associated with age and years of education, highlighting individual differences in cognitive aging. The use of this metric as a screening tool for existing AD pathology is not supported by our analyses. Follow-up work will determine if dispersion scores can predict changes in biomarker levels and/or positivity status longitudinally.
INTRODUCTION
Alzheimer’s disease (AD) is now widely accepted to lie on a continuum, with an asymptomatic neurodegenerative antecedent progressing towards cognitive and functional impairment that ultimately culminates in the Alzheimer’s dementia syndrome. Individuals without overt cognitive impairment meeting criteria for preclinical AD (pAD) based on biomarker evidence of AD pathophysiology show subtle cognitive signs detectable on precise neuropsychological tests [1–3]. Recommendations for cognitive testing in pAD exist [4, 5] and several new experimental measures have been proposed as sensitive and specific to the emergence of neuropathological change in regions vulnerable to AD [6–8]. Typically, cognitive impairment is determined by deterioration over time in an individual’s performance or alternatively by cut-off scores comparing mean performance between groups or an individual’s performance against the mean. More recently, research attention has turned to the application of sensitive scoring schemes that rely on existing traditional measures but repurpose their performance metrics to incorporate variations in cognitive performance within an individual participant. The term cognitive dispersion refers to variations in performance for a given individual between cognitive domains, tasks or performance across cognitive tests, while cognitive intra-individual variability describes variations in performance between trials within a single task at the same testing occasion or over time. Here, we will focus on cognitive dispersion. There are several approaches to quantify cognitive dispersion [9, 10], but no consensus on the most appropriate method. The individual standardized deviation (iSD) metric [11], comprising the standard deviation in individual performance across a set of cognitive measures, is one of the most widely used [10]. For this metric, raw scores are z-transformed on the basis of the distribution of scores from a reference sample and the variability between scores is calculated across the number of domains, tasks, or tests within the assessment.
Studies of cognitive dispersion reveal significant differences between age groups, with children and older adults showing greater dispersion in cognitive performance cross-sectionally [12–15]. Patterns of dispersion in cognitive function in childhood and later-life may reflect developmental and healthy aging processes, respectively. However, in older adults, higher baseline dispersion scores have been shown to predict progression to mild cognitive impairment (MCI) and dementia [11, 16–19], suggesting such performance dispersion may mark the emergence of a pathological process. In healthy aging, increased cognitive dispersion may reflect the emergence of impaired attention and executive functions alongside otherwise preserved cognitive domains, in turn reflecting a breakdown in compensatory mechanisms [20] as a result of age-related changes in neurotransmitter efficiency [21], grey and white matter integrity or the disruption of the default node network [22]; mechanisms that become increasingly compromised when a disease process accelerates. It has also been shown, as with most mean or normative indices of cognitive performance, that educational attainment may influence cognitive dispersion in mid-older adults (∼65 years old), but not in late-older adults (∼80 years old), suggesting that the former age group may uniquely benefit from early life brain stimulation acquired through education [20]. Apart from age and education, there has been little attempt to understand which other established AD risk factors (e.g., APOE ɛ4, gender, family history, or depression) or interactions thereof might influence cognitive dispersion scores.
Importantly, in some studies, cognitive dispersion indices have been shown to be associated with later cognitive impairment where mean performance methods or individual cognitive tasks have not (e.g., [11, 23]), underscoring their usefulness in prediction models of the risk of dementia or a means to identify and then target interventions toward higher risk individuals for secondary prevention of later stages of neurodegeneration. In fact, cognitive dispersion indices have been shown to predict MCI and dementia comparably to APOE ɛ4 carrier status and hippocampal atrophy [17] and independently of cerebrospinal fluid (CSF) analytes [16], further endorsing their use as a cost-effective and less invasive screening tool.
The correlates of cognitive dispersion with structural brain regions have been less well studied, but higher dispersion scores have been associated with smaller corpus callosum volumes [24], global and regional white matter degeneration [21, 25], faster entorhinal and hippocampal atrophy rates [26], as well as postmortem neurofibrillary tangles in AD dementia, MCI, and healthy individuals.
Preclinical AD is characterized by a CSF analyte profile of lower levels of amyloid-β, reflecting higher amyloid load in the brain, and higher levels of tau pathologies [27]. Only two studies have directly explored relationships between inconsistencies in testing and CSF analyte values of AD biomarkers, both finding significant associations in the expected directions [28, 29]. However, their dispersion scores were restricted to intra-individual variability in processing speeds between separate cognitive tasks. Given that in the asymptomatic stages of AD some cognitive domains, such as episodic memory and executive function, may be more sensitive markers of emerging pathology at an earlier stage of disease than others [30], increased dispersion across domains and/or tasks more sensitive to AD-specific regions at an early stage of disease might constitute a good marker of CSF identified cerebral pathology.
In summary, there is growing interest surrounding cognitive dispersion as a non-invasive and less costly marker of early neurodegeneration before clinical symptoms are evident. Consequently, we believe that there is a need for further exploration of the associations between cognitive dispersion and the pathological hallmarks of AD in adults without dementia [16]. In response to this, our main aim was to examine the hypotheses that higher cognitive dispersion will be associated with a) lower amyloid-β (Aβ42) levels; b) higher total tau (t-tau); c) higher phosphorylated tau (p-tau) levels, and d) amyloid positivity status in a cohort of older adults (>64 years) with variable risks for AD dementia, using a battery of tasks comprising traditional and novel experimental measures recommended for pAD research [4–6]. In addition, we explored which AD risk factors were associated with cognitive dispersion scores in our cohort to better understand the possible influence of such factors upon this index in this age group.
METHODS
Participants
Participants were recruited from the European Prevention of Alzheimer’s Dementia (EPAD) Longitudinal Cohort Study (LCS) [31]. EPAD is a multi-site pan-European project comprising individuals recruited from parent cohorts across affiliated delivery centers. Eligibility criteria include: aged 50 years or older; possession of at least seven years of formal education and availability of a study partner willing to provide corroborative information (for functional and behavioral measures). Potential participants are excluded at the screening stage if they were unable to consent to the research, had known genetic mutations associated with autosomal-dominant AD, had significant and unstable physical or mental illness, had or had experienced cancers within last five years (with the exception of localized prostate cancer and basal or squamous carcinoma). The EPAD project will provide a longitudinal observational research cohort in preclinical AD. The current study made use of the EPAD V500.0 data release, which provides baseline visit data from the first 500 participants across all research sites [32]. All participants provided informed consent and local ethical approval was obtained from ethics committees specific to each research site. All procedures were done in accordance with the ethical standards of the Helsinki Declaration.
Cognitive testing and construction of cognitive dispersion index
EPAD makes use of both traditional and exploratory measures that have been recommended for the assessment of cognitive change in pAD. The cognitive measures used for construction of our primary cognitive dispersion score included the Repeatable Battery of Assessment for Neuropsychological Status [33] subscale scores: Verbal Episodic Memory (List Learning & Story Memory); Visual Episodic Memory (Figure Recall); Visuospatial/Constructional (Figure Copy & Line Orientation); Language (Picture Naming); Attention/Executive Functioning (Semantic Fluency, Digit Span, Coding). In addition, we sought to explore if the inclusion of our experimental measures and/or the MMSE [34] in the dispersion composite influenced relationships with biomarkers and AD risk factors. These additional experimental measures included: the Flanker task [35] (set-shifting); the Four Mountains Task [6] (allocentric spatial processing); the Virtual Reality Supermarket Trolley [8] (egocentric spatial processing) and Favourites [35] (paired associate learning).
Biomarker ascertainment
The biomarkers presently available in the EPAD database are CSF measures of Aβ42, t-tau, and p-tau, and APOE ɛ4 status. Participants volunteered for their initial lumbar puncture within three months of their baseline cognitive assessment. All samples are shipped from sites and stored centrally at the EPAD BioBank at the University of Edinburgh before CSF samples, taken in Sarstedt tubes, are shipped to the Clinical Neurochemistry Lab, University of Gothenburg, Sweden for analysis using the Roche Diagnostics Elecsys Platform [36]. Results are then forwarded to the IQVIA Master Database and then transferred to the Aridhia Analytical Database. Amyloid positivity is defined in EPAD at a cut-off of Aβ42 < 1000 pg/ml following agreement from the EPAD consortium as an approach to best optimize sensitivity and specificity [31]. Blood was taken at screening and Taqman Genotyping was carried out in a single laboratory at the University of Edinburgh on QuantStudio12K Flex to establish APOE variants. APOE ɛ4 positivity was defined as possessing at least one APOE ɛ4 allele.
Other information
Demographic information (age, years of education, gender) were self-reported and taken at the baseline visit. Participants reported family history of dementia, which was defined as having at least one first-degree relative (sibling or parent) with dementia and, if they reported they had a first-degree relative with dementia, they were asked to report the age at diagnosis. Depression was measured using the Geriatric Depression Scale (GDS) [37].
Statistical analyses
Descriptive statistics were produced using standard techniques. Individualized standard deviations were calculated to derive dispersion scores using RBANS index scores and the four experimental tasks. The method [11] first requires the z-transformation of raw scores of each test using parameters from the distribution of the entire sample, and then, the application of the formula:
where T ik is the k-th test for participant i, K is the number of tests, and S i is participant i’s mean of the transformed scores.
Initially, univariate regression analyses were used to evaluate the association of dispersion scores as a function of a core set of sociodemographic data (age, sex, and education), family history of AD dementia, APOE ɛ4 genotype, and depression scores. Then, multivariable linear regression models where all independent variables were included simultaneously were fitted to test for an association between dispersion scores and the set of variables described before. Next, following the same steps, we tested the association of dispersion scores with CSF p-tau, t-tau, and Aβ42 values fitting univariate and multivariable linear regression analyses to data from the three biomarkers adjusted for dispersion scores, sociodemographic data, family history of AD dementia, APOE ɛ4 allele status, and depression scores. Although the distribution of the biomarkers was right skewed and some deviations from the normality assumptions were present in the data, the large sample size ensured that model assumptions were asymptotically satisfied. Generalized linear models with a Gamma distribution and a log link were also fitted to the data and results remained unchanged. These analyses added confidence to the results presented here showing their robustness to departures from linear regression models’ standard distributional assumptions.
Logistic regression was also used to test whether dispersion scores predicted amyloid positivity after adjustment for sociodemographic variables, family history of AD dementia, and APOE ɛ4 allele status and depression scores.
All analyses were repeated in the subsample of individuals who reported that a first-degree relative had dementia. In this subgroup, we further adjusted the models for a variable that measured the time elapsed between the participant’s age and the age of diagnosis of the first-degree relative who had dementia, as a proxy for preclinical AD [4]. If the participant’s mother had dementia, we used the mother’s age at diagnosis in the calculations and the father’s age at diagnosis if not.
Sensitivity analyses were conducted after two alternative derivations of dispersion scores. First, we derived dispersion scores using results from the RBANS subscales, the MMSE, and the four experimental tasks, maximizing the use of all data on cognitive function in the study. Second, we derived a third version of dispersion scores only including the EPAD experimental tasks. All analyses were repeated using these newly derived versions of dispersion scores in the full sample and the subsample of individuals with family history of dementia.
RESULTS
See Table 1 for descriptive statistics of the sample. The total number of individuals who contributed data to the derivation of the dispersion scores was 439, after exclusion of data from 61 individuals with missing values for either biomarker tests or cognitive tasks. These individuals did not differ from the individuals with complete data on the cognitive tests in terms of age (t-test, p = 0.09), sex (t-test, p = 0.62), education (t-test, p = 0.76), family history (t test, p = 0.65), APOE ɛ4 (t test, p = 0.68) status, or depression scores (t-test, p = 0.32). Graphical display of the characteristics of the sample are depicted in Fig. 1. Participants were split into separate categories according to sociodemographic and AD risk factors: age (51–64 years; 65–74 years; >75 years); gender (male/female); above or below the median years of education (±14 years); APOE ɛ4 status (APOE ɛ4, not APOE ɛ4); Family history of AD dementia (family risk, no family risk). We opted to categorize the age and education variables along similar cut-offs used by other groups (e.g., [15, 38–40]) for the purpose of comparability. As depicted, dispersion is higher for older individuals (ANOVA, p < 0.001), those who have had fewer years in formal education (t-test, p < 0.001) but no differences were found between carriers and noncarriers of at least one APOE ɛ4 allele (t-test, p = 0.27).
Descriptive characteristics of analytical sample (N = 439)
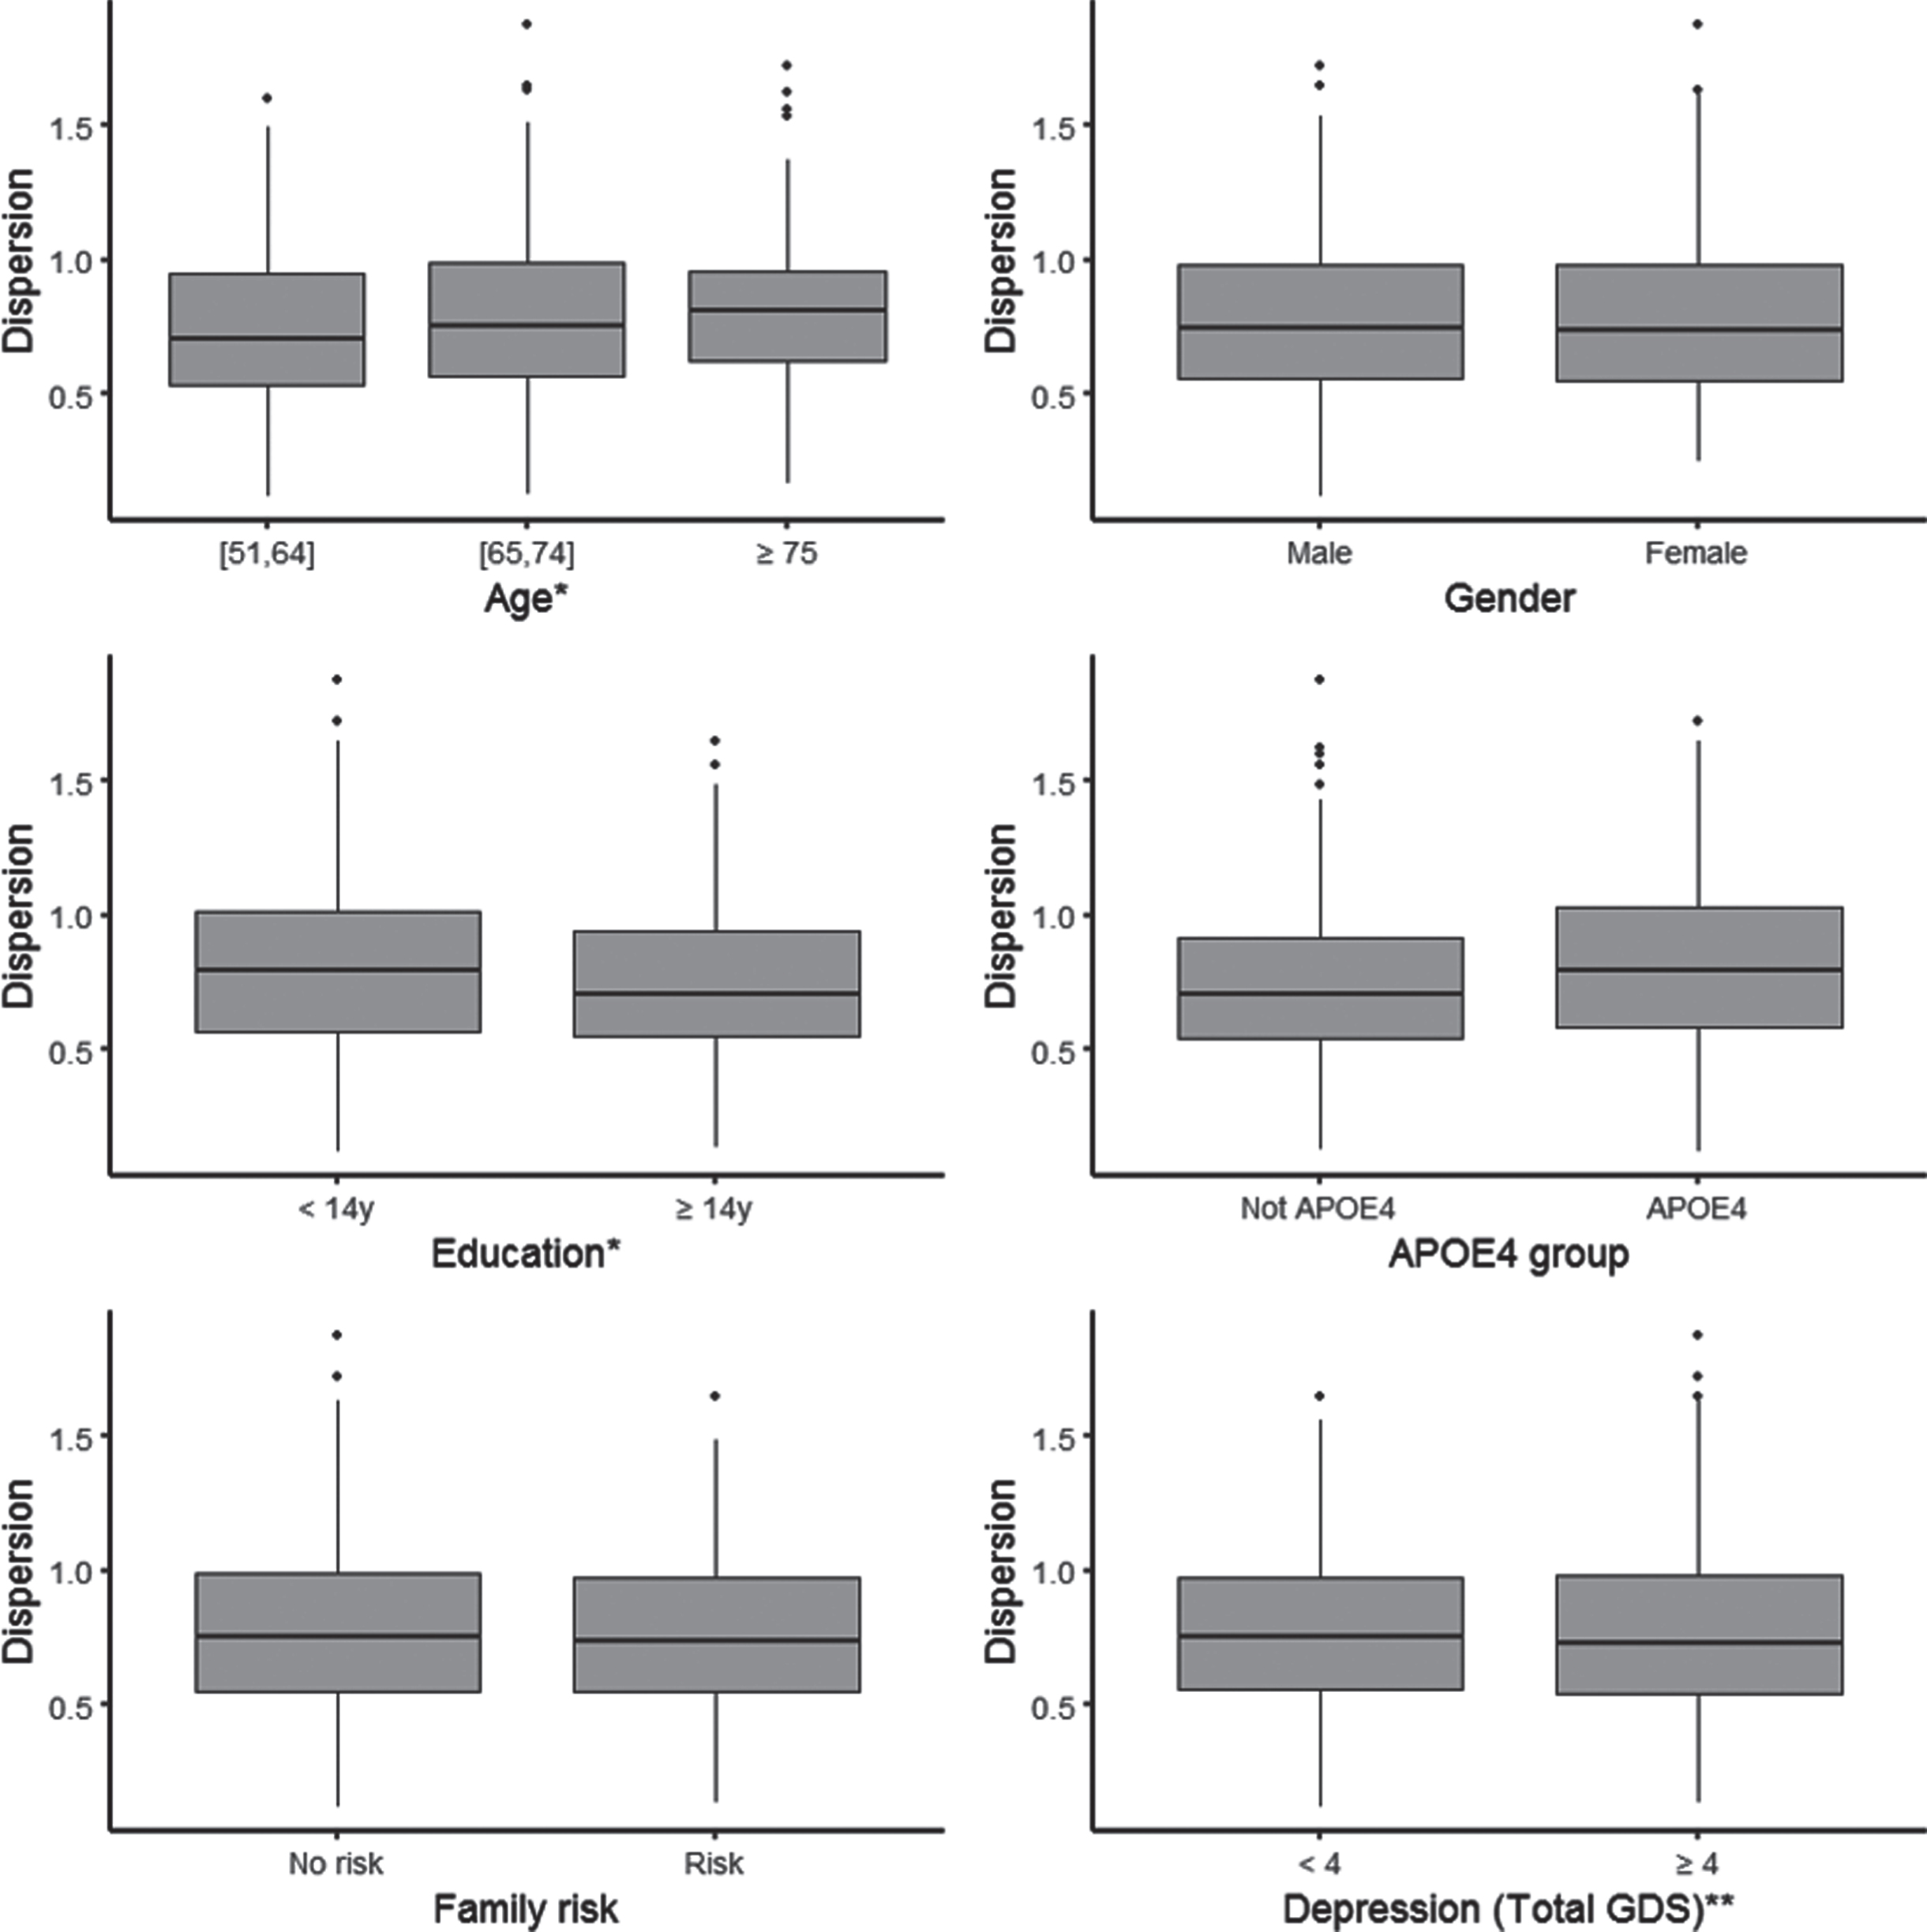
Dispersion by sociodemographic and AD risk factors. *Age: We split the sample in three groups according to age: from 51 to 64 years old (N = 186), from 65 to 74 years old (N = 206) and 75 and older (N = 47). Education: We split the sample in two groups according to the median years of education: less educated are below the median (less than 14 years; N = 200) and the others (14 years or more; N = 239).
Genetic, depression and sociodemographic risk factors associated with dispersion scores: of all variables examined, age and education were the only variables that emerged as associated with dispersion scores. Older adults had higher dispersion scores (β= 0.007, SE = 0.002, p = 0.001) and individuals with more education had less dispersion (β= –0.009, SE = 0.003, p = 0.009). Results are shown in Table 2.
Results from multivariable linear regression analyses of RBANS subscale dispersion scores and four experimental tasks adjusted for sociodemographic variables
Dispersion, variability across RBANS indices and four experimental tasks.
Dispersion scores and AD biomarkers: dispersion scores did not emerge as associated with p-tau, t-tau, or Aβ42 in the univariate or multivariable linear regression analyses that tested for an association between dispersions scores and the three biomarkers (Table 3). Older adults were found to have higher values of p-tau (β= 0.52, SE = 0.07, p < 0.001) and t-tau (β= 5.02, SE = 0.67, p < 0.001). Similarly, APOE ɛ4 carriers were found to have higher values of p-tau (β= 2.83, SE = 0.92, p = 0.002) and t-tau (β= 24.86, SE = 8.77, p = 0.005), as well as lower values of Aβ42 (β= –361.31, SE = 58.59, p < 0.001). In these analyses, depression scores were found to be associated with Aβ42. Specifically, individuals who scored higher in the GDS scale had lower values of Aβ42 (β= –13.73, SE = 6.09, p = 0.025).
Results from linear regression models fitted to p-tau, t-tau, Aβ42, and logistic regression analysis of amyloid positivity to study their association with cognitive dispersion scores derived using RBANS Subscale and four experimental task dispersion
Dispersion, variability across RBANS subscale indices and four experimental tasks.
When dispersion scores were used in univariate and multivariable logistic regression to test their association with amyloid positivity (multivariable logistic regression results shown in Table 3), the association did not reach traditional significance levels (OR = 0.96, CI = [0.46,2.00], p = 0.914 and OR = 0.63, CI = [0.28,1.44], p = 0.280 for univariate and multivariable results respectively). Older age (OR = 1.06, CI = [1.03,1.10], p < 0.001), APOE ɛ4 (OR = 2.29, CI = [1.50,3.51], p < 0.001), and depression (OR = 1.06, CI = [1.01,1.11], p = 0.011) increased the odds of amyloid positivity in fully adjusted logistic regression models.
The analyses of the subsample of participants who reported family history of dementia (n = 195) did not alter our findings in relation to the null association of dispersion scores with p-tau, t-tau, and Aβ42 or amyloid positivity (results not shown).
Sensitivity analyses
Analyses of the extended formulation of dispersion scores that included RBANS index and the MMSE did not change results in a meaningful manner. Similarly, results remained robust when associations were tested using dispersion scores that only included experimental tasks (Flanker and Four Mountains Tasks, Virtual Reality Supermarket Trolley, and Favourites). Results from these sensitivity analyses are presented in Supplementary Tables 1–3.
DISCUSSION
The current study investigated the association between dispersion in cognitive scores with sociodemographic factors, depression, APOE ɛ4 status, and familial risk and the core AD CSF biomarkers p-tau, t-tau, Aβ42, and (derived) amyloid positivity in the EPAD V500.0 database, from the EPAD LCS study. The main aims of the current work were to assess cognitive dispersion as a sensitive indicator of AD pathology and also explore sociodemographic and other AD risk factors impact upon cognitive dispersion scores. In our analyses, we failed to find an association of dispersion scores with amyloid (Aβ42 or amyloid positivity), t-tau, or p-tau. Yet, dispersion scores emerged as associated with increasing age and fewer years of formal education, in keeping with previous studies [14, 41].
Very few studies have examined predictors of dispersion scores or assessed dispersion as a marker for AD pathology. Our work takes some steps to address this. From a selection of established risk factors for AD, we found that cognitive dispersion increased with age—findings that resonate with comparisons between age-groups [14, 42]—and decreased in individuals with higher educational attainment, possibly reflecting more efficient compensatory strategies in response to neuronal senescence [20]. This latter suggestion could be explored further through exploring structural and functional neuroimaging changes and their association with cognitive dispersion to better understand the influence of cognitive or brain reserve on variability in older age.
Most previous work has compared the predictive value of cognitive dispersion in relation to CSF analytes and other AD biomarkers for the conversion to later cognitive impairment [16, 17]. Our aim departs from these studies, in that we were interested to explore whether cross-sectional dispersion scores, ascertained at a baseline assessment, could predict current levels of CSF biomarkers and/or amyloid positivity in people without dementia since this would be informative for enrichment strategies within clinical trials of preclinical AD. We did not find any support for cognitive dispersion as an indicator of current AD pathology, beyond established risk factors, such as age and APOE ɛ4 carrier status. This remained the case even when additional (experimental) cognitive measures were included in the calculation of the dispersion composite (see Supplementary Table 1). In previous smaller samples of healthy older adults (n = 291 [29]; n = 29 [28]), cognitive dispersion scores, computed from reaction times within a task-switching test [29] and a cued-Stroop task [28] did show significant associations with Aβ42 levels [28, 29] and with ratios of tau/Aβ42 [29] and p-tau/Aβ42 [28, 29] in the expected directions. The lack of replication for these relationships in our larger study questions the robustness of these previously observed effects but might be explained by differences in sample characteristics, CSF sampling methods, dispersion measures, and the cognitive tests used between studies. The dispersion metric adopted in these studies, coefficient of variation (CoV), constitutes a ratio of the intra-individual standard deviation and intra-individual mean performance and is typically used for reaction time data. It differs from the iSD metric, in that it takes into account overall performance to mitigate the confounds of the mean. However, the metric has been criticized for clouding underlying contributions toward any observed effects, as these might be explained by either increased variability or, in the cases of reaction time data, mean slowing [10]. We did not deem the CoV to be suitable for the purposes of our study because we were interested in variations in performance between cognitive domains and tasks from a neuropsychological battery purposefully selected in order to be sensitive to early AD changes; not trial-to-trial variability within a task loading on one cognitive domain. Importantly, we wanted to construct a dispersion composite that reflected standardized assessment practices in research and clinic settings which typically emphasize accuracy metrics over reaction time measures.
Given the cross-sectional nature of our work, we cannot rule out that our baseline dispersion scores could be a valuable indicator for the development of or deterioration in future AD pathology at follow-up. Antemortem cognitive dispersion scores were positively associated with neurofibrillary tangles, but not diffuse or neuritic plaques, the defining AD lesions, at postmortem [43]. Moreover, in previous research, baseline dispersion indices were not associated with cross-sectional entorhinal cortex or hippocampal volumes but did predict reduction in entorhinal cortex volumes at a two-year follow-up of healthy older adults [26]. Together with our results, these findings suggest that the value of cognitive dispersion as an indicator of AD pathology may not be realized until longitudinal changes in disease hallmarks are evident.
A major limitation of the current work is its cross-sectional design; although, we were specifically interested in assessing relationships between dispersion and current pathology in the context of baseline data in order to explore its potential usefulness as a screening or enrichment tool in aging cohorts. Future longitudinal work with this cohort will explore dynamic relationships between dispersion measures and CSF analytes, as well as structural (and functional) neuroimaging changes in individuals with and without genetic and other AD risks, to better elucidate evolving associations between these variables over time and toward AD dementia. It is possible that change scores over time in both biomarkers and dispersion may be more sensitive than either change score alone in predicting dementia onset. Additionally, the quantification method and composition of our dispersion indices, as well as the number and nature of tests used, might also have influenced the results obtained. While no consensus has been reached on which measures or approach is preferable, future work could compare which combination of measures and quantification approaches are most sensitive to CSF and other biomarkers changes in AD.
In conclusion, cognitive dispersion scores were positively and negatively associated with age and education years, respectively. Our investigation of sensitivity of results to the tasks and tests included in the derivation of the dispersion scores was a first step toward future research to gain a better understanding of the optimal selection of tests to maximize the use of dispersion scores as an early marker of poor brain health. Furthermore, additional research is also needed to identify which variables moderate cognitive dispersion, as this would further highlight the contribution of individual differences to successful cognitive aging. Our study failed to provide support for cognitive dispersion as an indicator of AD pathology obtained through CSF. This latter observation contrasts with previous findings from smaller cohorts and questions the usefulness of cognitive dispersion for the purposes of screening for existing CSF abnormalities in older adults. Nonetheless, follow-up work will determine if dispersion scores can predict changes in CSF levels and/or positivity status over time. If so, this could inform secondary prevention trial designs by providing an inexpensive adjunct screening tool to enrich aging or readiness cohorts with individuals possessing emerging abnormal CSF profiles.
Footnotes
Acknowledgments
The authors would like to thank the participants enrolled on EPAD who continue to provide their invaluable contribution to brain health research. The European Prevention of Alzheimer’s Dementia project has received support from the EU/EFPIA Innovative Medicines Initiative Joint Undertaking EPAD grant agreement number 115736. KB is supported by the Swedish Research Council (#2017-00915), the Alzheimer Drug Discovery Foundation (ADDF), USA (#RDAPB-201809-2016615), the Swedish Alzheimer Foundation (#AF-742881), Hjärnfonden, Sweden (#FO2017-0243), the Swedish state under the agreement between the Swedish government and the County Councils, the ALF-agreement (#ALFGBG-715986), and European Union Joint Program for Neurodegenerative Disorders (JPND2019-466-236).