
Abstract
Background:
Higher glucose levels are associated with dementia risk in people with and without diabetes. However, little is known about how this association might vary by hypertension status and antihypertensive treatment. Most studies on modifiable dementia risk factors consider each factor in isolation.
Objective:
To test the hypothesis that hypertension and antihypertensive treatments may modify associations between glucose levels and dementia.
Methods:
Analyses of data generated from a research study and clinical care of participants from a prospective cohort of dementia-free older adults, including glucose measures, diabetes and antihypertensive treatments, and blood pressure data. We defined groups based on blood pressure (hypertensive versus not, ≥140/90 mmHg versus <140/90 mmHg) and antihypertensive treatment intensity (0, 1, or ≥2 classes of antihypertensives). We used Bayesian joint models to jointly model longitudinal exposure and time to event data.
Results:
A total of 3,056 participants without diabetes treatment and 480 with diabetes treatment were included (mean age at baseline, 75.1 years; mean 7.5 years of follow-up). Higher glucose levels were associated with greater dementia risk among people without and with treated diabetes. Hazard ratios for dementia were similar across all blood pressure/antihypertensive treatment groups (omnibus p = 0.82 for people without and p = 0.59 for people with treated diabetes).
Conclusion:
Hypertension and antihypertensive treatments do not appear to affect the association between glucose and dementia risk in this population-based longitudinal cohort study of community-dwelling older adults. Future studies are needed to examine this question in midlife and by specific antihypertensive treatments.
INTRODUCTION
Associations between diabetes and increased risk for Alzheimer’s disease and dementia have been consistently reported [1]. Potential mechanisms that may underlie this association between diabetes and risk for Alzheimer’s disease include effects of glucose, effects of insulin resistance and responses to in-sulin resistance, and effects of concomitant metabolic derangements and cardiovascular risk factors, including elevated blood pressure [2–9]. High glucose lev-els may increase risk for tau hyperphosphorylation [10]. Similarly, glycation exacerbates the neurodeg-eneration associated with α-synuclein in synucleinopathies [11], and has been implicated in amyloid processing [12]. While glucose metabolism derangements including diabetes are a well-established ind-ividual modifiable risk factor for Alzheimer’s disease, co-occurrence of risk factors is common [13]. A systematic review and meta-analysis of 79 studies on the impact of multiple co-occurring modifiable risk factors for cognitive decline and dementia reported a possible dose response between a higher number of modifiable risk factors and AD. The authors concluded that future research should examine specific combinations of risk factors [13]. Importantly, the new Lancet Commission report ‘Dementia prevention, intervention, and care’ includes diabetes and hypertension as modifiable risk factors for dementia. This report also states that “antihypertensive treatment for hypertension is the only known effective preventive medication for dementia,” emphasizing the importance of examining not only hypertension but also its treatment when studying how risk factors might interact [14].
As two common and often co-occurring conditions, diabetes and hypertension are ideal candidates for such an analysis.
Genetic studies have suggested mechanistic links between Alzheimer’s disease and diabetes-related metabolic alterations [15], and also between Alzhe-imer’s disease and blood pressure [16]. Among people with impaired glucose metabolism, hypertension may increase risk for impairments in some cognitive domains [17]. Hypertension and elevated glucose may be synergistic in promoting Alzheimer’s disease risk; however, the specific mechanisms underlying such an effect are unknown.
It is possible that the relationship between blood glucose levels and dementia risk is particularly relevant for only some people. For the reasons noted above, it is possible that there is an interaction bet-ween blood pressure and the glucose-dementia risk relationship. If there were such an interaction, the association between glucose and dementia risk could be particularly prominent among some subset of people identified by their blood pressure status. Such a finding would be important, as it would focus attention in future studies of relationships between glucose and dementia risk on only that group of individuals. Such studies ultimately could be the basis of personalized medicine approaches where recommendations to reduce dementia risk would be targeted to the specific subgroup where they could have greatest impact.
Among people treated for hypertension, observed blood pressure measures reflect both the underlying blood pressure and the effects of antihypertensive treatments. Furthermore, hypertension severity can be indexed by the number of medication classes used for blood pressure control. These considerations led us to consider six different groups defined by the presence versus absence of high blood pressure (defined as ≥140/90 mmHg), and antihypertensive treatment intensity defined as 0, 1, or ≥2 classes of antihypertensive drugs. This approach enables us to examine the potential relevance of antihypertensive treatment intensity and level of blood pressure control on the relationship between glucose levels and dementia risk.
Glucose levels observed among people with and without diabetes are very different from each other, as mean glucose levels for people with diabetes are much higher than those without diabetes. As in our prior paper on associations between glucose levels and dementia risk [18], we stratified all analyses to evaluate any interaction between blood pressure and antihypertensive treatments and the glucose-dementia relationship separately for people with and without diabetes. We did not have reliable data on diet-controlled diabetes, but had essentially complete pharmacy data for our cohort, so we defined diabetes on the basis of treatment for diabetes.
We evaluated extensive longitudinal clinical data from a prospective cohort with research-quality case ascertainment to test the hypothesis that hypertension and its treatments may modify the association between glucose levels and dementia.
MATERIALS AND METHODS
Sample and primary stratification
We used data from the Adult Changes in Thought (ACT) prospective cohort study [19]. The ACT study initially included an original cohort of 2,581 randomly selected dementia-free members of Kaiser Permanente Washington (KPWA, formerly Group Health) with a goal to identify risk factors for incident dementia and Alzheimer’s disease. Eligibility criteria were that participants had to be 65 years of age or older at the time of enrollment, which occurred from 1994 through 1996, and had to be free of dementia and living in the community (not a nursing home) at enrollment. An additional 811 participants were enrolled between 2000 and 2003. In 2004 ACT began continuous enrollment of 10–15 participants per month. With this strategy, we replaced people who died, dropped out of the study, or developed dementia, with a goal to keep at least 2000 people consistently enrolled and at-risk for dementia outcomes. Participants were invited to return at 2-year intervals for the purpose of identifying incident cases of dementia.
Because people with and without treated diabetes have very different glucose exposure profiles, we performed all analyses separately for these two groups. We classified participants as having treated diabetes on the basis of diabetes-related medication data from KPWA pharmacy records (Supplementary Table 1). At least two filled prescriptions in a single year were required for the classification, with the onset date for treated diabetes defined as the date when the second prescription was filled. Once a participant was classified as having treated diabetes, the classification was retained for the remainder of the study.
The sample for the current study was limited to participants who: 1) had at least one follow-up visit, 2) had been enrolled in KPWA for at least 5 years before study entry, and 3) had at least 1 measurement of glucose, hemoglobin A1c, or glycated hemoglobin in the 5 years before study entry, as well as at least 1 during follow-up. Glycated hemoglobin is the older measurement used to characterize long-term glucose levels that was replaced by the hemoglobin A1c assay. We then excluded 2% of the sample due to missing covariate information (variables described in Exposure and Adjustment sections later below). These criteria resulted in 3,056 people without diabetes and 480 people with diabetes for analysis.
All study procedures were approved by the Kaiser Permanente Washington IRB, and all participants signed consent forms indicating their informed consent to participate in the study.
Time-to-event outcome: Dementia diagnosis
Study participants had their cognitive functioning assessed every 2 years with the Cognitive Abilities Screening Instrument, for which scores range from 0 to 100, and in which higher scores indicate better cognitive functioning [20]. Patients with scores of 85 or less underwent further clinical and psychometric evaluation, including a battery of neuropsychological tests (see Supplementary Methods 1). The results of these evaluations, along with laboratory test results and imaging records were then reviewed in a consensus conference. Diagnoses of dementia were made on the basis of DSM-IV criteria [21]. Dementia-free participants continued with scheduled follow-up visits. The incidence date for dementia was recorded as the halfway point between the study visit at which dementia was diagnosed and the previous visit [19]. For our analyses, participants were followed until the earliest of dementia onset, KPWA disenrollment, or last ACT visit prior to the study period end of September 30, 2016.
Longitudinal exposure: Glucose measures (random glucose or HbA1c)
KPWA clinical measures of random glucose, gly-cated hemoglobin, and hemoglobin A1c were cap-tured from computerized laboratory data. Values for total glycated hemoglobin were transformed to hem-oglobin A1c values using the formula: hemoglobin A1c = (0.6×total glycated hemoglobin) + 1.7 [18].
Each random glucose measure provides a momentary level of glucose, while glycated hemoglobin pro-vides information about glucose levels over the life of hemoglobin molecules, which is about 3 months. Glycated hemoglobin values provide much more precision than a single random glucose in terms of long-term average glucose exposure. However, not all study participants had glycated hemoglobin assessed, and the availability of glycated hemoglobin measures varied substantially across participants; as exp-ected, they were much more commonly observed among people with diabetes. Our model (described later) incorporated both random glucose and glycated hemoglobin values, distinguishing between the measurement types to account for the different variability in the two measures.
Exposure groups: Blood pressure and antihypertensive treatment
Blood pressure (BP) was measured on participants at the time of each of their ACT visits. Specifica-lly, BP was calculated as the average of two measurements taken five minutes apart on the left arm while the person was seated. Over 95% of blood pressure occasions included two measures. Uncontrolled BP was defined as having average systolic BP ≥140 or average diastolic BP ≥90. Antihypertensive treatment was determined based on antihypertensive medication fills from KPWA pharmacy records in the year prior to the ACT study visit, with 2+ fills being considered treated. The number of different antihypertensive classes filled was also recorded (Supplementary Table 2 lists antihypertensive classes and specific medications). Based on the BP and tre-atment data, we then constructed six time-varying groups defined by BP (controlled versus uncontrolled, based on the 140/90 cutoff) and presence and intensity of antihypertensive treatments (no treatment, treatment with 1 antihypertensive class, treatment with ≥2 antihypertensive classes). Group membership was time-dependent in our analyses and could change when BP status or treatment intensity changed across visits.
Adjustment covariates
Factors with the potential to confound the relationship between glucose levels and dementia were defined predominantly with the use of data collected from participants at ACT study visits (see Supplementary Methods 2). In addition to demographic information such as age, gender, and education collected at enrollment, at each study visit a research staff member administered a questionnaire that asked participants about their exercise level, smoking status (current, former, or never) and whether a doctor had ever told them they had coronary artery disease (myocardial infarction, coronary artery bypass grafting, coronary angioplasty, or angina), or cerebrovascular disease (stroke, transient ischemic attack, or carotid endarterectomy). History of atrial fibrillation, which was not asked about at ACT visits, was determined for participants in our sample using diagnoses from KPWA clinical encounters, specifically by use of codes 427.3, 427.31, and 427.32 from the International Classification of Diseases, 9th Revision (ICD-9) and codes I48.x from ICD-10, in accordance with procedures at KPWA.
Statistical methods
We utilized Bayesian joint models, estimated separately for people with and without diabetes, to exa-mine whether the glucose-dementia relationship differs among cardiovascular risk factor groups defined by blood pressure status and hypertension treatments. A joint model [22] can be useful in est-imating the association between a longitudinal exposure measure (i.e., glucose levels) and a time-to-event outcome (i.e., dementia onset), particularly when the longitudinal measure is subject to measurement error, the measure is postulated to be related to the outcome, and measurement occurs at irregular times with no temporal association to the outcome. All of these are true for this research question. Joint models can simultaneously estimate the longitudinal exposure and time-to-event model leading to efficient use of all available data. The joint models were fit under a Bayesian framework using Markov chain Monte Carlo (MCMC) algorithms.
Joint modeling typically entails specifying a linear mixed effects model for the longitudinal exposure, a survival model for the time-to-event outcome, and the hypothesized functional form representing how the longitudinal exposure relates to hazard of the event. We describe each of these three steps in detail below.
We used linear mixed effects models to estimate an underlying longitudinal trajectory of glucose levels for each participant; information is borrowed for participants with few glucose values by shrinking toward the population mean, whereas participants with many glucose values have a trajectory influenced primarily by their own data [23]. We included an intercept and linear or natural cubic spline [24] representations for age in both fixed and random effects, and we added a random indicator for measurement type (i.e., 1 if measured by hemoglobin A1c, 0 otherwise) in models to account for different precision from hemoglobin A1c and random glucose measures. We selected the most appropriate model (see Supplementary Methods 3) based on Bayesian information criterion (BIC) and prediction performance on both the individual and population levels.
The survival model utilized was a Cox model with age as the time scale, adjusted for covariates of enrollment cohort, gender, education, exercise, coronary artery disease, atrial fibrillation, smoking, and the blood pressure/antihypertensive treatment gro-ups. We defined the reference group as people with controlled blood pressure and treated with ≥2 drug classes, as this was a large group. We stratified on cerebrovascular disease status, which allowed for different baseline hazard functions across these strata in the estimation of model parameters, consistent with our prior work [18].
Lastly, for the functional form relating glucose to the dementia hazard in the joint model, we included as our primary analysis a linear term corresponding to a participant’s current glucose level and interaction terms between glucose level and the cardiovascular risk factor groups of interest (previously specified). As an exploratory analysis, we also explored inclusion of model terms representing the rate of change in glucose (i.e., slope of glucose level trajectory at any given time).
Our null hypothesis was that there is no difference in the glucose-dementia association among the 6 risk groups. We tested this composite hypothesis with the use of a two-sided posterior-based Wald test [25] for the interaction terms with omnibus α= 0.05. The hazard ratios of glucose on dementia for each risk group are reported, and we also provide comparisons of the dementia risk between these risk groups, graphically and numerically.
Data were prepared and cleaned using SAS software, version 9.4 (SAS Institute), and statistical ana-lyses were performed using the JMbayes package [26] in R, version 3.5.3 (R Foundation for Statis-tical Computing). The JMBayes package was chosen because 1) it can accommodate left-truncation due to using age as the time scale in the survival model; 2) it can incorporate time-varying adjustment covariates and risk groups, and 3) it allows flexibility in specification of the fixed and random effects of the longitudinal exposure process. Before reporting our final results, we ensured the Bayesian model achieved MCMC convergence by checking diagnostics including trace, auto-correlation and kernel density estimated plots, and when necessary, increased the number of iterations, added thinning, increased burn-in, etc.
RESULTS
Description of study sample
Mean age among all participants at baseline was 75.1 years. Characteristics of participants at baseline for our analyses are provided in Table 1A for those without diabetes treatment and Table 1B for those with diabetes treatment. Among the 3,056 participants without diabetes treatment prior to study entry, those being treated with multiple antihypertensive classes tended to have higher rates of comorbidity and report slightly less physical activity than those with no antihypertensive treatment or treatment with a single class of antihypertensive medication. This pattern was present both for those with controlled and uncontrolled BP. The proportion of participants with post-secondary education was slightly lower among those with uncontrolled BP, while the distributions of age and gender were similar across the six groups. Similar relationships between groups were observed among the treated diabetes sample of 480 participants, though the sample size was smaller.
Baseline characteristics in people without treated diabetes
BP, blood pressure; HTN, hypertension.
Baseline characteristics in people with treated diabetes
BP, blood pressure; HTN, hypertension.
For people without diabetes, there were an average (standard deviation, SD) of 8.6 (9.4) overall glucose values, of which 1.1 (2.8) were HbA1c measures and 7.5 (8.6) were random glucose measures. For people with diabetes, there were an average (SD) of 22.4 (19.5) overall glucose values, of which 12.4 (10.8) were HbA1c and 9.9 (10.8) were random glucose values.
The 6 risk groups were defined as follows: Group 1: controlled BP, no antihypertensive; Group 2: controlled BP, 1 class of antihypertensive; Group 3: controlled BP, 2 + classes of antihypertensive; Group 4: uncontrolled BP, no antihypertensive; Group 5: uncontrolled BP, 1 class of antihypertensive; Group 6: uncontrolled BP, 2 + classes of antihypertensive. There were an average of 7.5 years of follow-up. The distribution of blood pressure values for each group is shown in Supplementary Tables 3 and 4. Dementia incidence rates (per 100 person-years of follow-up) in the risk groups were: 2.6, 2.9, 3.4, 2.5, 3.3, and 2.5, respectively, for those never treated for diabetes, and 2.0, 3.5, 4.2, 2.3, 3.5, and 3.3, respectively, for those treated for diabetes. The median mo-del-estimated glucose exposure for participants never treated for diabetes across all timepoints was 105 mg per deciliter (10th and 90th percentile range, 93 to 132 mg per deciliter), and the median model-est-imated glucose exposure for those with treated diabetes across all timepoints was 165 mg per deciliter (10th and 90th quantile range, 135 to 207 mg per deciliter). These values informed the reference point shown in Table 2A and 2B.
Hazard ratios for each risk group defined by blood pressure and antihypertensive treatment for people not treated for diabetes
BP, blood pressure; CI, confidence interval; HR, hazard ratio; HTN, hypertension. *for a 10 mg/dl increase in glucose level. #hazard ratio comparing between risk groups at median glucose = 105 mg/dl.
Hazard ratios under each risk group treated for diabetes
BP, blood pressure; CI, confidence interval; HR, hazard ratio; HTN, hypertension. *for a 10 mg/dl increase in glucose level. #HR comparing between risk groups at median glucose = 165 mg/dl.
Findings for people without diabetes
Primary model results for people without treated diabetes are shown in Table 2A. Based on our primary joint model, the test of interactions between risk groups and the association between glucose level and dementia risk yielded an omnibus p-value of 0.82 for people without treated diabetes. Thus, we found no statistical evidence that blood pressure status and antihypertensive treatments—measured by count of antihypertensives classes—modified the relationship between glucose level and dementia risk.
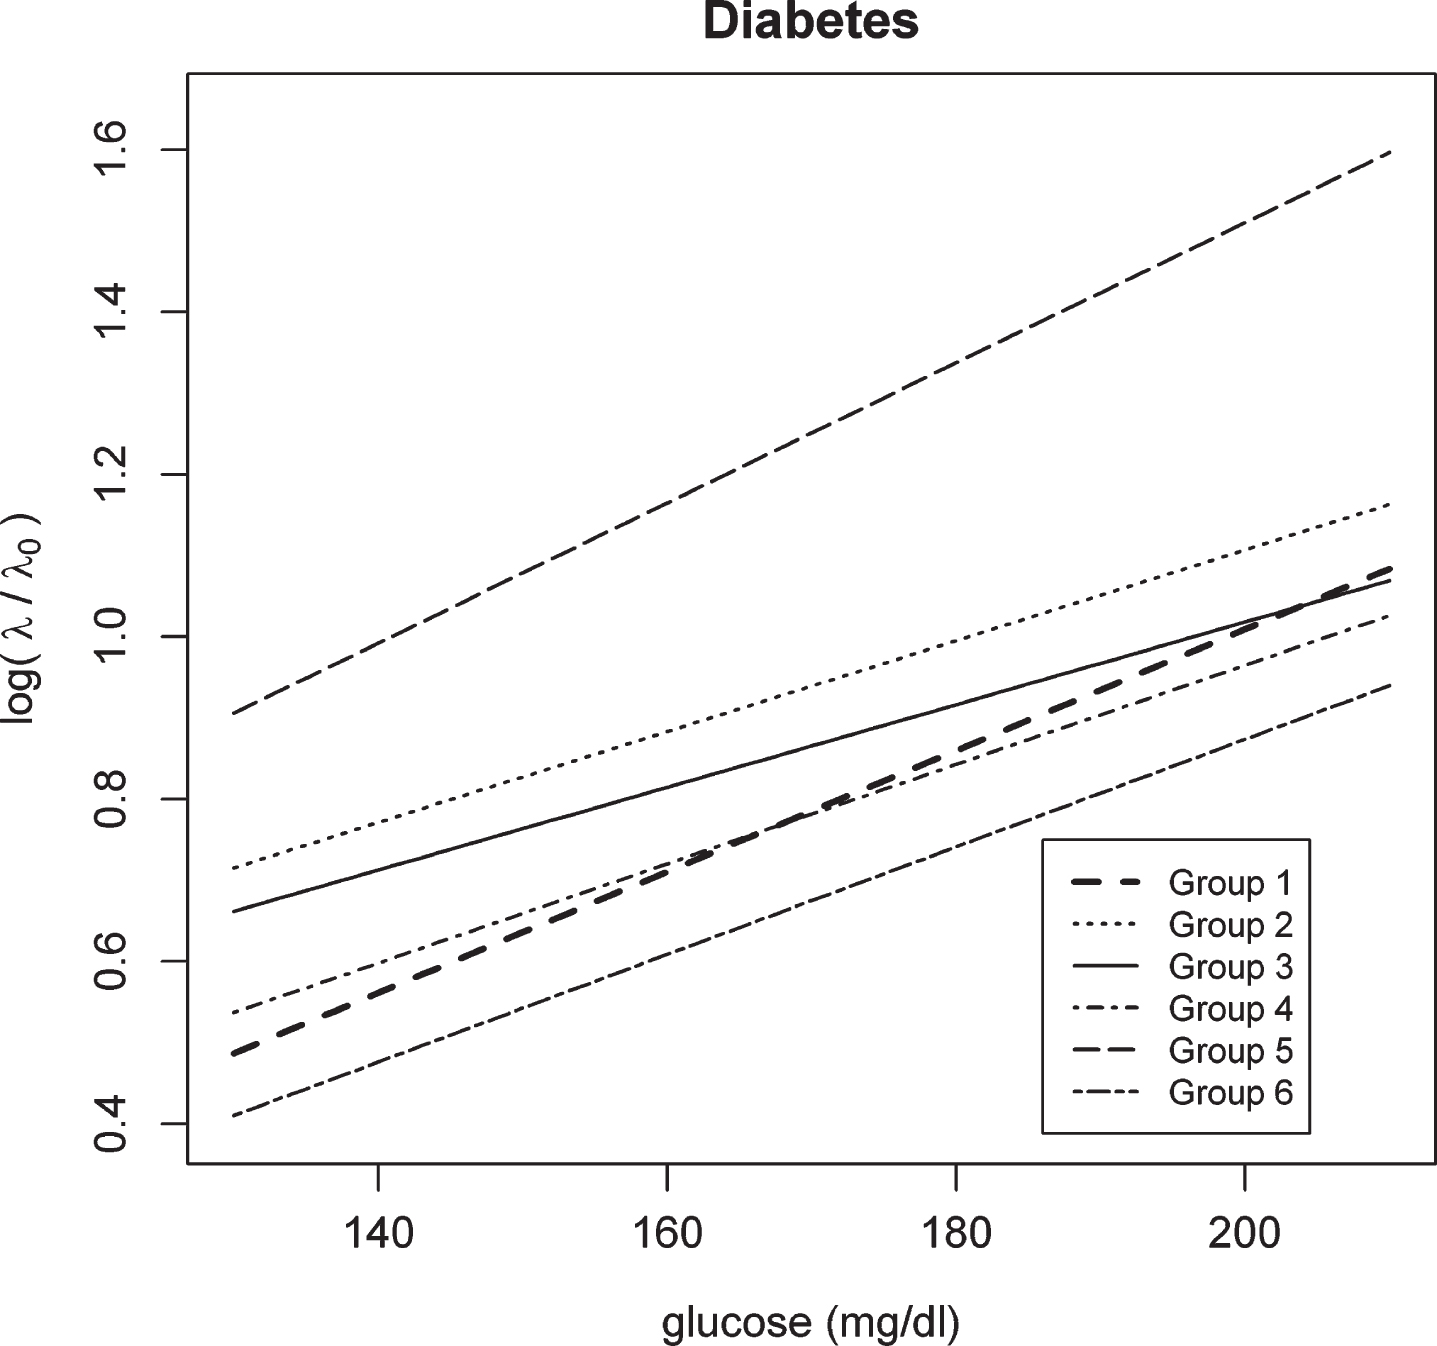
We plotted the log hazard ratio as a function of glucose level for people without treated diabetes in Fig. 1. In this figure each line denotes the log hazard ratio under each risk group with respect to baseline hazard λ0 (with baseline referring to someone who is in the original cohort, a male, with no college education, not having regular exercise, without heart disease, a non-smoker, and without atrial fibrillation). The 6 lines are nearly parallel to each other, showing the lack of significant interaction/modification effect from the risk groups on the glucose-dementia association.

Log hazard ratio of dementia given glucose levels under each risk group for people without diabetes treatments*. Note: Group 1: controlled blood pressure & No hypertension treatment; Group 2: controlled blood pressure & 1 class of antihypertensive treatment; Group 3: controlled blood pressure & 2 + classes of antihypertensive treatment; Group 4: uncontrolled blood pressure & No antihypertensive treatment; Group 5: uncontrolled blood pressure & 1 class of antihypertensive treatment; Group 6: uncontrolled blood pressure & 2 + classes of antihypertensive treatment. *Over an average of 7.5 years of follow-up among our study sample, 670 of the 3,056 (21.9%) participants never treated for diabetes developed dementia.
The first column of results in Table 2A shows the numeric values of hazard ratios for a 10 mg/dl higher estimate of glucose exposure on dementia under each group. All of these hazard ratios are very similar to each other. In Fig. 1, the vertical distance between any two lines characterizes the hazard ratio of dementia on the log scale between the corresponding risk groups for a given value of estimated glucose level. The first 5 groups are relatively close to each other while group 6 (i.e., uncontrolled BP & ≥2 drug classes) is distinct. This result is also reflected in the last column of Table 2A which shows the hazard ratios for each risk group compared to reference Group 3 when glucose = 105 (the median value, chosen for illustrative purposes). Group 6 shows lower risk compared to group 3 (HR = 0.67, 95% CI: 0.48, 0.96).
Findings for people with diabetes
Primary model results for people with treated diabetes are shown in Table 2B. Findings were similar to those for people without treated diabetes presented above. This can be seen in Fig. 2 and the first HR column in Table 2B, which show no evidence of differences in the glucose-dementia association by group (test of interactions yielded an omnibus p-value of 0.59), with all log HRs nearly parallel to each other in Fig. 2, and roughly 5–9% greater hazard for each 10 mg/dL higher glucose shown in Table 2B. In addition, from Fig. 2, we can also see that group 5 (i.e., uncontrolled BP & 1 drug class) is the only group distant from the other 5 groups, though this is not statistically significant (HR = 1.44, 95% CI: 0.62, 2.95 from Table 2B).
Log hazard ratio of dementia given glucose levels under each risk group for people with diabetes treatments*. Note: Group 1: controlled blood pressure & No antihypertensive treatment; Group 2: controlled blood pressure & 1 class of antihypertensive treatment; Group 3: controlled blood pressure & 2 + classes of antihypertensive treatment; Group 4: uncontrolled blood pressure & No antihypertensive treatment; Group 5: uncontrolled blood pressure & 1 class of antihypertensive treatment; Group 6: uncontrolled blood pressure & 2 + classes of antihypertensive treatment. *Over an average of 7.5 years of follow-up among our study sample, 93 of the 480 (19.4%) participants never treated for diabetes developed dementia.
We performed exploratory analyses to examine whether adding a term for glucose rate of change itself or with its corresponding interactions with risk groups had any additional impacts on dementia-association findings from our primary model. None of these additional models suggested evidence of modification of the glucose-dementia association by risk groups for either people without treated diabetes or people with treated diabetes (data not shown). The glucose rate of change also did not appear to be associated with dementia risk. We also performed sensitivity analyses in which we removed data from people with hypotension, defined as systolic BP values <90, or diastolic BP values <60. We performed modeling exactly as described above for our main joint models with these data removed. Results were very similar to our primary analyses (see Supplementary Tables 5 and 6), which suggests that our findings are not driven by hypotension at the time of ACT study visits.
DISCUSSION
In this prospective cohort study of community-dwelling older adults with a mean age of 75 years, we did not find differences in associations between glucose levels and dementia risk across groups defined by blood pressure and antihypertensive treatment for people without or people with treated diabetes. This suggests that blood pressure/antihypertensive relationships with dementia and glucose relationships with dementia may be independent of each other in later life.
We previously reported associations between glucose levels and dementia risk in people with and without treated diabetes [18]. This association has now been confirmed in a variety of settings [27–42]. There even appears to be an association between higher glucose levels and Alzheimer’s disease risk among people with Type 1 diabetes [43]. We used a joint model in this study and confirmed our prior finding of associations between higher glucose levels and dementia risk, but did not find that this differed across groups defined by blood pressure levels and antihypertensive treatment intensity.
Glucose lowering may be one of the mechanisms that reduced risk in the FINGER trial. FINGER involved a multi-modal intervention including diet, exercise, vascular risk factor monitoring, and individualized cognitive training. Investigators evaluated whether the success of their intervention was consistent across different groups of participants including people with hypertension and people with diabetes. They found no differences in the effects of the FINGER intervention on overall cognitive performance across these groups [44]. Our observational findings are consistent with this result from the FINGER study, as we did not see differences in associations between glucose levels and dementia risk across groups defined by blood pressure levels and antihypertensive treatments. However, it is important to note that our outcome of all-cause dementia is different than the primary outcome from the FINGER study (cognitive performance measured by a comprehensive neuropsychological test battery). Moreover, the SPRINT-MIND trial found that treating ambulatory patients (mean age 67.9 years) to a systolic BP goal of less than 120 mmHg versus less than 140 mmHg did not reduce the risk of probable dementia, but it did reduce the risk of mild cognitive impairment by 19% [45, 46]. Unfortunately, SPRINT-MIND excluded people with diabetes so it is not known how the intervention effect might differ among older adults with diabetes. The ongoing SMARRT trial will test the effect of a personalized, multidomain dementia risk reduction strategy in higher-risk older adults by aiming for optimal control of cardiovascular risk factors including hypertension and diabetes [46].
Our findings in a sample of this size likely rule out a large difference among these 6 groups in the association between glucose levels and dementia risk; however, power may be limited in smaller subgroups. While the finding of lower dementia risk in those with uncontrolled blood pressure compared to those with controlled blood pressure among the heavily treated (i.e., ≥2 drug classes) for people without diabetes is interesting, there are reports of high blood pressure being associated with lower risk for mortality [47] or with J-shaped relationships [48]. In addition, blood pressure declines with age on average; a decline in blood pressure in later life has been associated with increased dementia risk [49–51]. Furthermore, there have been several studies that have suggested that blood pressure variability may be especially associated with risk of Alzheimer’s disease and Alzheimer’s disease progression [52–54]. These published data and our findings suggest the need for analyses specifically focused on the specific impact of blood pressure, blood pressure variability, and antihypertensive treatments on dementia risk, which was not the focus of this investigation.
A key strength of our study is the use of a joint model. This model can handle glucose measured with error while allowing for different measurement precision from hemoglobin A1c and random glucose measures. Glucose can be irregularly assessed and does not need to be observed at each event time in our model. The model also borrows information for subjects with sporadic glucose measurements. By using a joint model, we efficiently used all available data to simultaneously estimate associations of interest in a single joint model process instead of the two-step process we used previously: in the first step we modeled glucose and then used those estimates to model dementia risk, in which case uncertainty of glucose estimates from the first step is not promulgated through to the modeling of associations between glucose levels and dementia risk in the second step [18].
Our findings should be considered in the context of weaknesses of our study. Our study cohort had limited ethnic diversity so generalizability to non-European ancestry populations may be limited. We controlled for a wide variety of potential confounders in our models, however, unmeasured and residual confounding could be present, as in any observational study. Our groups were defined on the basis of blood pressure and antihypertensive treatments, and did not incorporate blood pressure variability, which has been increasingly studied recently in terms of its importance to Alzheimer’s and dementia risk. We assessed antihypertensive treatment intensity using a count variable of antihypertensive medication classes as a proxy. However, we do not report any dose- or duration-response associations. Similarly, accumulating evidence suggests that certain antihypertensive sub-classes may be associated with a reduced risk of dementia [55]. Future studies should examine whether certain antihypertensive sub-classes moderate the glucose-dementia association. Finally, our outcome was all-cause dementia, and we are unable to meaningfully report results by underlying etiology (e.g., vascular dementia) due to small sample sizes.
In conclusion, we found no evidence of differences in the glucose-dementia relationship across groups defined by blood pressure and treatment with antihypertensive medications, for people with and without treated diabetes. While blood pressure and higher glucose levels may be independent risk factors for dementia and Alzheimer’s disease, our study showed no evidence of a synergistic or interactive relationship between these factors and dementia risk.
Footnotes
ACKNOWLEDGMENTS
The ACT study is funded by the National Institute on Aging, U01 AG 006781 (E Larson and P Crane). Z Marcum is supported by the National Institute on Aging, K76AG059929. The sponsor had no role in study design, collection, analysis, or interpretation of data, in the writing of this report, or in the decision to submit this article for publication.