
Abstract
Background:
Advanced machine learning methods can aid in the identification of dementia risk using neuroimaging-derived features including FDG-PET. However, to enable the translation of these methods and test their usefulness in clinical practice, it is crucial to conduct independent validation on real clinical samples, which has yet to be properly delineated in the current literature.
Objective:
In this paper, we present our efforts to enable such clinical translational through the evaluation and comparison of two machine-learning methods for discrimination between dementia of Alzheimer’s type (DAT) and Non-DAT controls.
Methods:
FDG-PET-based dementia scores were generated on an independent clinical sample whose clinical diagnosis was blinded to the algorithm designers. A feature-engineered approach (multi-kernel probability classifier) and a non-feature-engineered approach (3D convolutional neural network) were analyzed. Both classifiers were pre-trained on cognitively normal subjects as well as subjects with DAT. These two methods provided a probabilistic dementia score for this previously unseen clinical data. Performance of the algorithms were compared against ground-truth dementia rating assessed by experienced nuclear physicians.
Results:
Blinded clinical evaluation on both classifiers showed good separation between the cognitively normal subjects and the patients diagnosed with DAT. The non-feature-engineered dementia score showed higher sensitivity among subjects whose diagnosis was in agreement between the machine-learning models, while the feature-engineered approach showed higher specificity in non-consensus cases.
Conclusion:
In this study, we demonstrated blinded evaluation using data from an independent clinical sample for assessing the performance in DAT classification models in a clinical setting. Our results showed good generalizability for two machine-learning approaches, marking an important step for the translation of pre-trained machine-learning models into clinical practice.
Keywords
INTRODUCTION
Dementia of the Alzheimer’s type (DAT) is a pro-gressive and incapacitating neurodegenerative disease and represents an increasingly prevalent global health challenge, with 40–50 million people currently living with DAT worldwide [1]. It is now recognized that pathophysiological changes associated with DAT, including amyloid deposition, occur many years before symptom onset [2]. Therefore, DAT spans a continuum of escalating functional impairment, from the clinically asymptomatic to the severely incapacitated. At present, there is no effective cure for DAT, so detection at the earliest possible stage and accurate diagnosis is vital for patient care, treatment planning, and subject selection in clinical trials. To this end, the diagnosis of DAT can be improved by the use of biomarkers; biological measures of functional impairment, neuronal loss, and protein deposition [3].
Brain glucose hypometabolism measured with 18F-fluorodeoxyglucose positron emission tomography (FDG-PET), which reflects glucose metabolism mainly from neurons [4], is a biomarker of neurodegeneration in DAT, showing good accuracy in identifying patients who subsequently convert to DAT (for review, see [5]). Abnormal brain glucose metabolic patterns in DAT can be detected years prior to the onset of cognitive symptoms [2, 6]. A distinctive pattern of FDG-PET hypometabolism is observed in both individuals with DAT and amnestic mild cognitive impairment (MCI) when compared to cognitively normal control subjects (NC), and includes reduced cerebral metabolic rate for glucose (CMRgl) in the bilateral posterior cingulate, precuneus, parietotemporal, and frontal cortex [7].
Automatic, or machine learning, methods have been developed to aid in the classification of DAT based on high dimensional features extracted from neuroimaging biomarkers [8–10], including FDG-PET [11–15]. In distinguishing DAT subjects from NC, accuracy ranging from 82% –93%, sensitivity ranging from 78% –100%, and specificity ranging from 78% –100% have been reported in the literature [16]. The observed variability in both sensitivity and specificity among previously reported automated classification models is likely to result from variations in study sample size, evaluation schemes, and demographic distributions (e.g., race and ethnicity, age, sex, years of education) of samples. Further, these techniques have not yet been implemented for use in routine care or clinical trials, owing in part due to poor performance when evaluated on independent data [17].
When an independent test set is not available, researchers employ evaluation schemes using subsets of existing data, such as hold-out [12], repeated hold-out [18], leave-one-out cross-validation [19], and k-fold cross-validation [20, 21]. However, the performances obtained using these evaluation schemes may still over-estimate classification accuracy and be of limited effectiveness for generalization to novel data sets. Without proper validation on a completely independent and clinically relevant test set, it is unclear whether a proposed method is generalizable to novel data, i.e., to images acquired under different protocols, using different hardware, and of varying quality. Accordingly, researchers have recently attempted validation of automatic methods with data from large, independent samples. In one case, Haense et al. [22] performed an independent test of their automated procedure for discrimination between DAT and NC, developed on the European Network for Standardization of Dementia Diagnosis (NEST-DD), using FDG-PET images obtained from the Alzheimer’s Disease Neuroimaging Initiative (ADNI), reporting 78% specificity and 83% sensitivity. More recently, Ding and colleagues [12] validated their automatic method on an independent clinical data set. In this case, training and evaluation was performed using FDG-PET images from ADNI, and they achieved 81% sensitivity and 94% specificity. On an independent clinical test set, they reported 100% sensitivity and 82% specificity. While model performance on the independent test set was very high, the study was limited by small sample size (26 NC and 7 DAT) and consisted of highly selected patients.
The performance of models trained with participants whose diagnosis remains unchanged throughout a study (e.g., stable DAT and stable NC) can overestimate classification performance when tested on data obtained from independent clinical samples. Importantly, real-life cohorts consist of subjects presenting with cognitive and functional impairment spanning the entire DAT continuum. To this end, Popuri et al. [23] tested their kernel-based probabilistic classifier on a sample of participants across the entire clinical spectrum, including normal controls who converted to MCI or DAT, and individuals with MCI who either remained stable throughout the study period or who converted to DAT upon follow-up. Importantly, this model was tested on a very large sample of 1767 validation images that were not included in the training set. They reported an area under the curve (AUC) of 0.78 and a balanced accuracy of 0.70, as well as 71% sensitivity and 70% specificity. While these values are not as high as those reported in previous research, given the very large, independent set of validation images consisting of participants across the full clinical spectrum, the achieved performance is more likely to be unbiased and generalizable.
Recently, automated diagnostic classification using non-feature-engineered learning approach has gain its popularity. Specifically, three dimensional convolutional neural networks (3D CNN) has increasingly being used to automatically extract imaging-based features directly from raw 3D medical images to achieve disease classification [24]. This method has reportedly matched performance of conventional clinical diagnostic methods in Alzheimer’s disease classification [25, 26]. To this end, Yee et al. [27] have proposed a probabilistic classifier for DAT using a 3D CNN with residual blocks [28] as the backbone. Using raw 3D FDG-PET images as input, they output DAT probability scores, and tested their model on participants ranging the full clinical spectrum. The reported model accuracy was 72.5% among images comprising the entire DAT spectrum.
In the present study, we aimed to evaluate the clinical value of our previously reported classification performances applied to a generalizable sample of data representing individuals spanning the full DAT continuum. We evaluated and compare the performance of two of our machine learning classification methods of DAT, one using ROI-based input FDG-PET features [23] and one with raw FDG-PET signal [27], on a completely independent clinical sample for which their corresponding DAT status were completely blinded to the classifier. To this aim, a set of unlabeled FDG-PET images was received from clinicians at the Jewish General Hospital (JGH) in Montreal, Quebec, Canada. Images were acquired from patients who presented for clinically suspected dementia. The pre-trained models from both classifiers were applied on the obtained FDG-PET images and a predicted probability of DAT score for each unlabeled image was generated to identify DAT cases from non-DAT controls. Subsequently, the performance of both models was assessed by comparing the automatically predicted DAT classifications with the expert clinical ratings from trained nuclear physicians regarding the presence or absence of Alzheimer’s disease, which were generated independently at JGH and blinded to the algorithm evaluators.
METHODS
Participants
In this study, all data were obtained from a retrospective analysis of 546 available brain FDG-PET scans from JGH collected between 1 January 2010 and 4 July 2018. FDG-PET scans were acquired in patients seeking diagnostic clarification for suspicion of underlying neurodegenerative disease. Approval from the Research Ethics Committee of the JGH was obtained for the data collection procedure, including a waiver of informed consent and the use of anonymous data. Of the 546 total scans, 12 were excluded due to missing DICOM data and 15 were excluded because the clinical indication was not related to dementia. A further 13 were deemed of insufficient quality to be used with currently available algorithms. For the remaining 506 scans, reports generated for clinical purposes by two out of five trained nuclear physicians (between 5 and 30 years of experience) were again reviewed for this study and classified as either positive or negative for Alzheimer’s disease. For every report that had an equivocal formulation or that described equivocal findings, images were reviewed and reprocessed to reconstruct statistical mapping using 3-dimensional stereotactic surface projection NEUROSTAT [29] software. Consensus between the two readers (one trained and one in-training nuclear physician) was then obtained using all the available images. In total, 48 cases were reviewed, and consensus obtained. Demographic and clinical information of all subjects were obtained after single blinding was removed. Briefly, the sample consisted of 240 female and 266 male patients; mean age, 69 years [range 28–88 years]. Detailed demographic information of the participants were presented in Table 1.
Demographic information of the participants in the JGH clinical evaluation cohort in terms of mean age of male (first row) and female (middle row) as well as both sex (bottom row), for the overall participant (left panel); the DAT+group (middle panel), and DAT- group (right panel)
FDG-PET scanning procedures
All scans were collected using the standardized 3D brain FDG PET/CT protocol of the Jewish General Hospital on a hybrid PET/CT scanner (Discovery ST, General Electric Medical Systems, Waukesha, WI, USA). Patients were required to fast for at least 4 h prior to scanning. Dedicated images of the brain were acquired 45 to 90 min after injection of a clinically appropriate activity of 18F-FDG IV, in accordance with JGH institutional protocol.
Construction of dementia score with feature-engineered and non-feature-engineered probabilistic classifiers
Two probabilistic classification methods previously developed were applied on the obtained FDG-PET images to generate a predicted probability of DAT score for each unlabeled image. Data used in the training and evaluation of previously reported methods was obtained from the ADNI database. Both classifiers were trained on the baseline data from the stable normal control (sNC) subjects and stable DAT (sDAT) subjects in the ADNI database [30]. Here, stable means the clinical diagnosis of the subjects are unchanging across the study period of ADNI. Details of the data stratification strategy are described in the original papers [23, 27]. Detailed description of the ADNI recruitment procedure, image acquisition protocols and diagnostic criteria can be found at www.adni-info.org. Both methods output a DAT score between 0 and 1, with 1 indicating highest likelihood of belonging to a patient with DAT and 0 a normal control (NC).
FDG-PET DAT score (FPDS)
The first probabilistic classifier for the blinded clinical evaluation [23] is an ensemble model that computes the standardized uptake value ratios (SUVRs) in gray matter patches (sub-regions of FreeSurfer atlas-based regions of interest derived using k-means clustering) using a probabilistic multi-kernel classifier [31] and sub-bagging technique [23], and outputs a probabilistic FDG-PET DAT score (FPDS) ranging from 1 (highest probability the image belongs to DAT class) to 0 (representing the NC). The SUVRs were computed by extracting the patch-wise parcellations of the structural magnetic resonance imaging (MRI) images and transferring the parcellations patches to the FDG-PET space. The data from JGH consists of only clinical FDG-PET images with no corresponding MRIs available. As such, the regions-of-interest (ROIs) used to calculate the SUVRs was defined at the structural level rather than the sub-structural patch level to ensure sufficient spatial correspondence. An MNI152 MRI template was processed using Freesurfer to obtain 85 gray matter ROI masks based on FreeSurfer’s cortical [32] and subcortical [33] atlases. FDG-PET images were registered directly to the MNI 152 MRI template via a 9-parameter transformation using the FSL-FLIRT program (https://fsl.fmrib.ox.ac.uk/fsl/fslwiki/FLIRT) [34]. The computed mapping was used to transfer the 85 gray matter ROI masks from the MNI 152 space onto the native FDG-PET space. The mean FDG-PET image intensity value in each ROI was computed and divided by the mean intensity value in the brainstem to obtain the SUVR. 85 SUVR features were used as the input to the classifier model, which consists of a t-statistic based feature selector that selects the 38 most discriminative features and an ensemble of 100 probabilistic kernels that outputs a probability score. The probabilistic prediction output by the ensemble model was taken to be the FDG-PET DAT score.
3D Convolutional Neural Network DAT score (3D CNN)
The second probabilistic classifier adopted a non-feature-engineered approach by training a 3D CNN using the raw FDG-PET images as input, outputting a DAT probability score [27]. The input FDG-PET images were registered directly to the MNI 152 FDG-PET template via a 7-parameter transformation using FSL-FLIRT [34, 35] to correct for the head pose and global scale, and rescaled to the intensity range between 0 and 1. The DAT probability score was obtained by training a 3D CNN classifier with the registered and intensity-normalized FDG-PET image from the sNC and sDAT subjects in the ADNI dataset, with the stratified group defined the same as in the feature-engineered approach. The 3D CNN comprised 3 convolutional blocks, followed by 2 convolutional layers, a global averaging pooling layer and a SoftMax layer. Each convolutional block had 2 convolutional layers and a max pooling layer. In total, the 3D CNN had 8 convolutional layers, each with 2, 4, 16, 16, 64, 64, 72, and 96 filters, respectively [27].
Performance evaluation of classifiers with blinded clinical evaluation
To evaluate the performance of both the feature-engineered and non-feature-engineered classifiers, we applied both classifiers to the set of unlabeled FDG-PET images from JGH to obtain the inferenced DAT probabilistic scores. Accuracy, sensitivity, specificity, and area under the curve (AUC) of the receiver operating characteristic curve (ROC) were computed by thresholding the DAT probability score at 0.5 such that probability greater than 0.5 was considered as DAT. The distribution of predicted DAT probability scores among the clinically diagnosed DAT and non-DAT participants were also compared. To evaluate the similarity and difference between the feature-engineered and non-feature-engineered classifiers, we further separated the scans in which the FPDS and 3D CNN models reached consensus and evaluated the model performance for both the consensus and non-consensus subsets separately.
We further evaluated the distribution of the model-predicted DATs across the entire test data set by calculating the standardized DAT score (z-score) [32], of the raw feature at each ROI. Z-score is calculated as Z i = (X i - μ X CN )/ - σ X CN where Xi is the measurement FDG value of the ROI, μ XCN is the mean FDG measurements for the same ROI of the normal non-DAT subjects collected from the ADNI data, and σ X CN is the corresponding standard diviation. The Z-score measures the difference between the raw ROI measurement and the reference (non-AD) mean, normalized by the reference standard deviation (SD) [36].
It is worth noting that both DAT scores were originally trained on sNC and sDAT subjects from the ADNI database and were designed to distinguish DAT subject from the cognitive normal subjects. On the other hand, in our clinical evaluation, the subjects were patients all of whom presented in the clinic for assessment for suspected dementia. Therefore, this retrospective study mainly evaluates the power of the imaging-based DAT scores to distinguish DAT subjects who might be diagnosed with DAT from non-DAT subjects who may also harbor other causes of cognitive impairment or even other non-DAT dementias that led to their seeking assessment in this clinical setting.
RESULTS
Overall, the prevalence of DAT in the independent data set from JGH was 34%, N = 173 for DAT and N = 333 for NC. We have reported the detailed performance and evaluation results in the following sections.
Comparison of probability distribution of DAT scores between feature-engineered and non-feature-engineered classifiers
A histogram is presented in Fig. 1A, showing distribution of DAT scores obtained using the FPDS method across all 506 scans. DAT scores below 0.1 were the most frequent, with almost 30% of images receiving a score in this range. DAT scores greater than 0.9 were the second most frequent, with around 15% of the images receiving DAT scores in this highest category (i.e., most indicative of a DAT metabolic pattern).
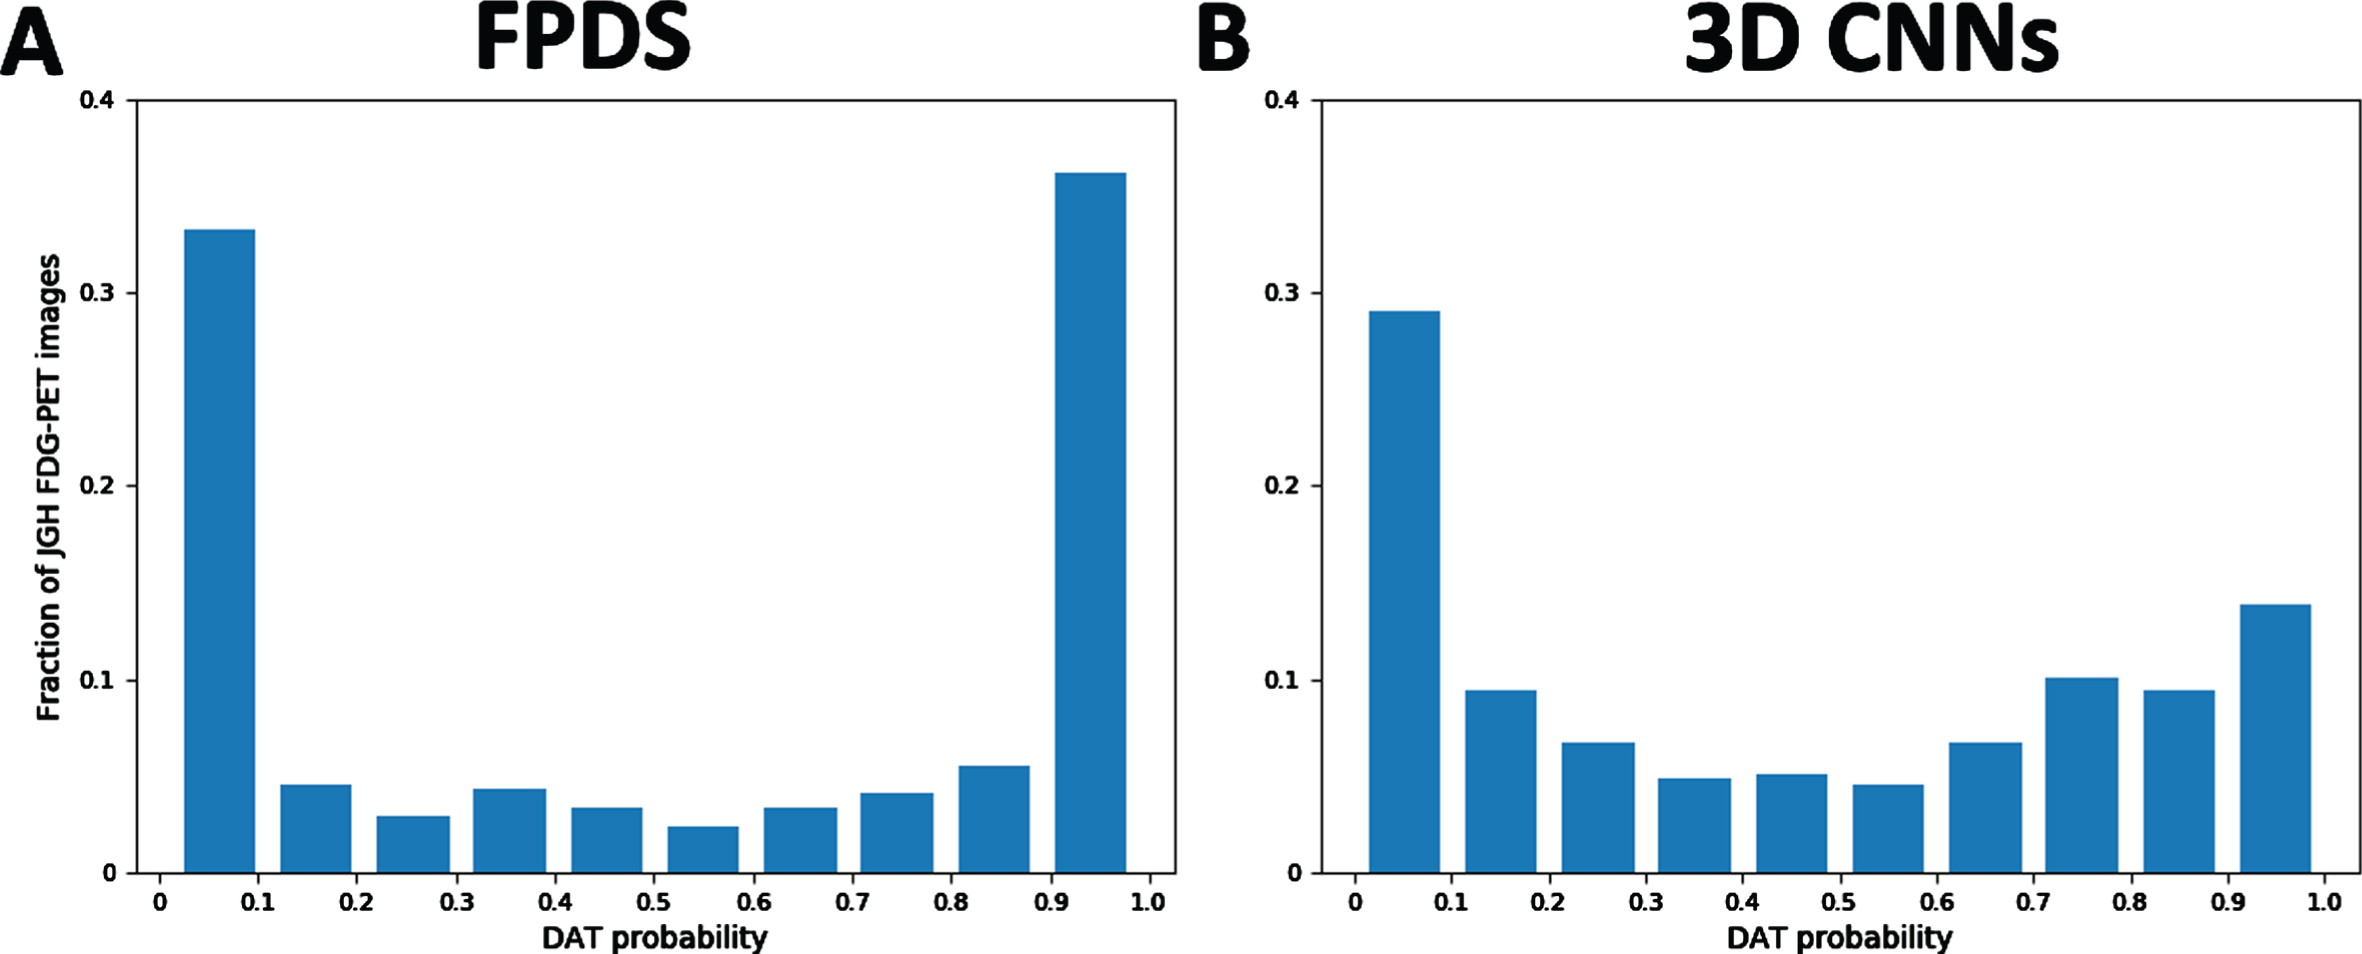
Probability distribution of DAT scores predicted using A) FPDS. (N = 506) and B) 3D CNN. (N = 506).
In Fig. 1B, a histogram displays distribution of DAT scores obtained using the 3D CNN method across all 506 scans. Over one third of scans received DAT scores below 0.1, somewhat greater than in the FPDS method. However, the most frequent range of DAT scores obtained with the 3D CNN method were those receiving a DAT score greater than 0.9, representing 37% of scans. Overall, there were lower frequencies of DAT scores in the intermediate ranges in the 3D CNN method than the FPDS method.
Visualization DAT score across all structures expanded the whole test set of clinical data
Figure 2 shows a panoramic heatmap visualization of the standardized score, Z-score, of the normalized FDG-PET SUVRS within each ROI over the entire test set—which we termed as Zscape. The Z-score highlights the difference in each ROI with respect to the reference mean, and the SD-standardization enables comparison across all the ROIs. Each column of the Zscape represents all the FreeSurfer-derived ROIs for each subject, with red color representing higher mean normalized FDG-PET SUVRs than reference group (non-DAT) mean, and blue color reflecting lower-than-reference-mean normalized FDG-PET SUVRs. The Z scape allows for visual assessment of patterns across all subjects (N = 506) and all ROIs simultaneously for both the FPDS (Fig. 2 Top) and 3D CNN methods (Fig. 2 Bottom). Specifically, the individual subjects are ordered by column from highest to lowest mean DAT score across all subjects measured, from left to right. The overall similar pattern of the subject ordering with some local alteration reflects the similar performance in the prediction of the DAT probabilistic scores between the two classifiers with some non-consensus cases for some individual subjects.

The Zscape of both the feature-engineered classifier (top row, FPDS) and non-feature-engineered classifier (bottom row, 3DCNN) showing the normalized FDG-PET SUVRS within each ROI over the entire test set. The individual subjects (represented by each columns) are ordered from left to right by the DAT scores inferenced from (top) the FPDS and (bottom) the 3D CNN classifier. Color spectrum from blue to red represent the value of the Z-score ranging from –10 to +10 SD of reference group (non-AD) mean.
Blind evaluation of model performance on unseen clinical data
In Table 2 and Fig. 3, we presented the classification performances for DAT scores obtained using the FPDS and 3D CNN methods. The 3D CNN achieved higher AUC of 0.842 (Fig. 3), indicating higher performance across classification thresholds and better separation of the two classes. Sensitivity of the 3D CNN was 84.5%, while the sensitivity of the FPDS was 74.1%. On the other hand, the 3D CNN misclassified more non-DAT images, resulting in lower specificity of 67.0%, in comparison to the 71.9% specificity of the FPDS. Accuracy was similar across methods (72.8% in 3D CNN and 72.6% in FPDS). 3D CNN outperformed FPDS in balanced accuracy (mean of sensitivity and specificity measures). The AUC of ROC shown in Fig. 3 also indicated improved model performance of 3D CNN compared to the FPDS, which agree with the results shown in Table 2.
Classification performances on JGH FDG-PET images
AUC, area under the curve; FPDS, FDG-PET DAT score; CNN, convolutional neural network.
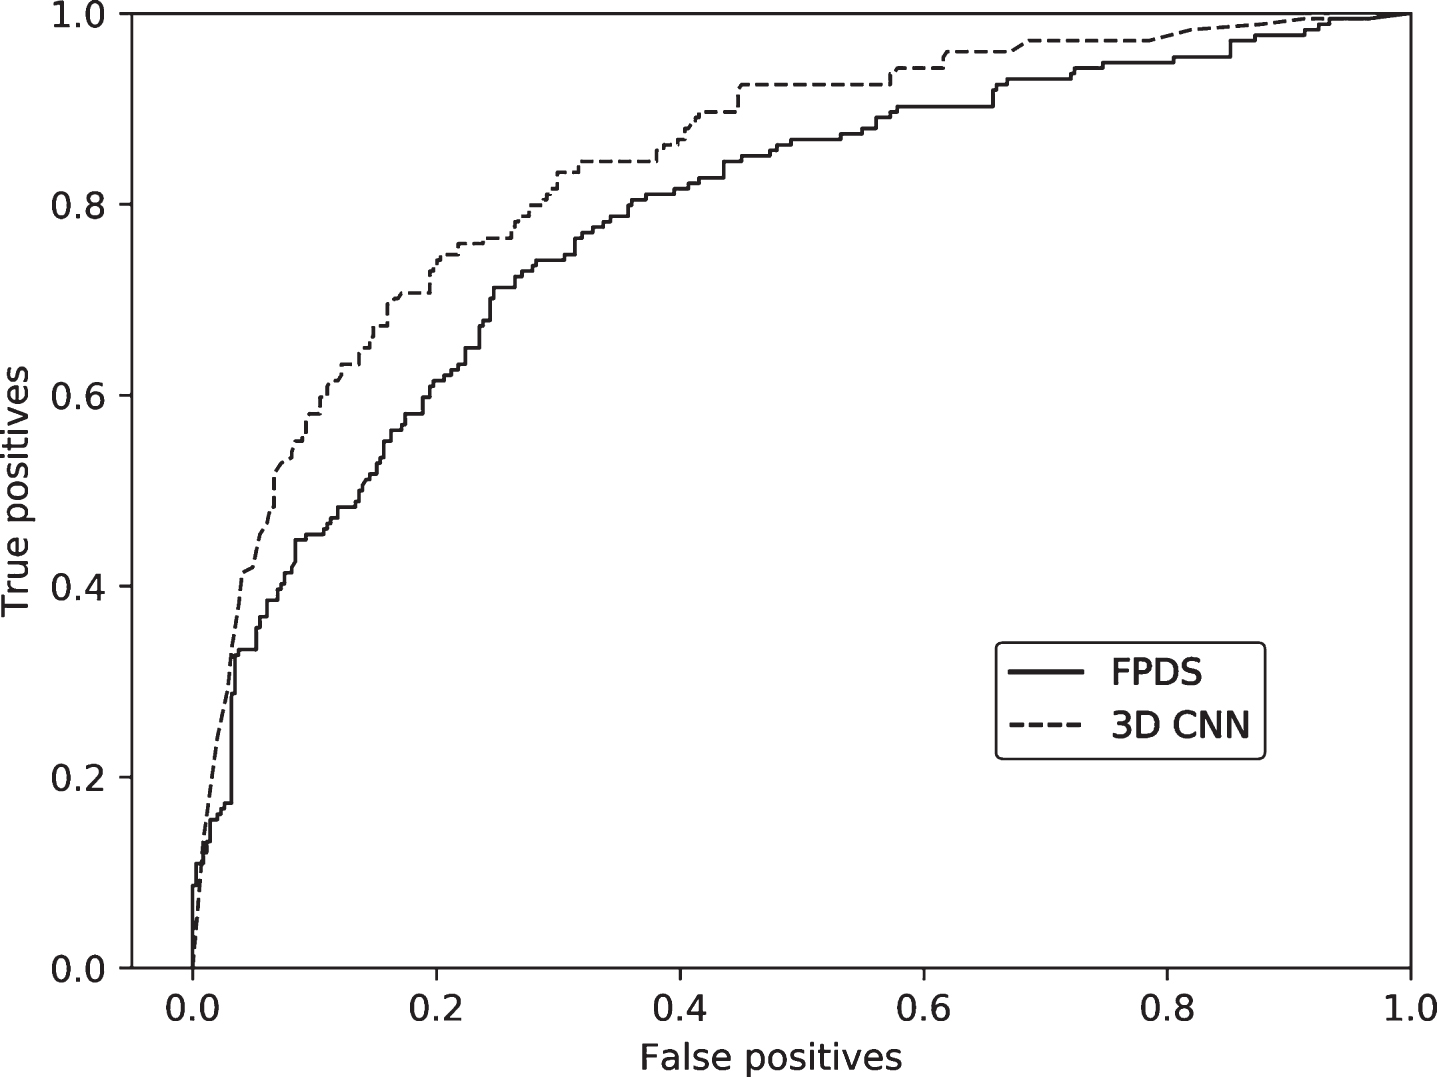
Receiver Operating Characteristic (ROC) curves for classification performance of DAT scores obtained using FPDS and 3D CNN methods. FPDS, FDG-PET DAT score; CNN, convolutional neural network.
We further evaluated the model performances for both the non-DAT and DAT group. Figure 4 shows the distribution of DAT probability scores for non-DAT and DAT predicted using FPDS and 3D CNN methods. Among patients labelled by a trained nuclear physician as DAT, the 3D CNN method produced higher mean DAT scores with less dispersion when compared to the FPDS method. In patients labelled by a trained nuclear physician as non-DAT, the FPDS method produced higher mean DAT scores with less dispersion for compared to the 3D CNN method.
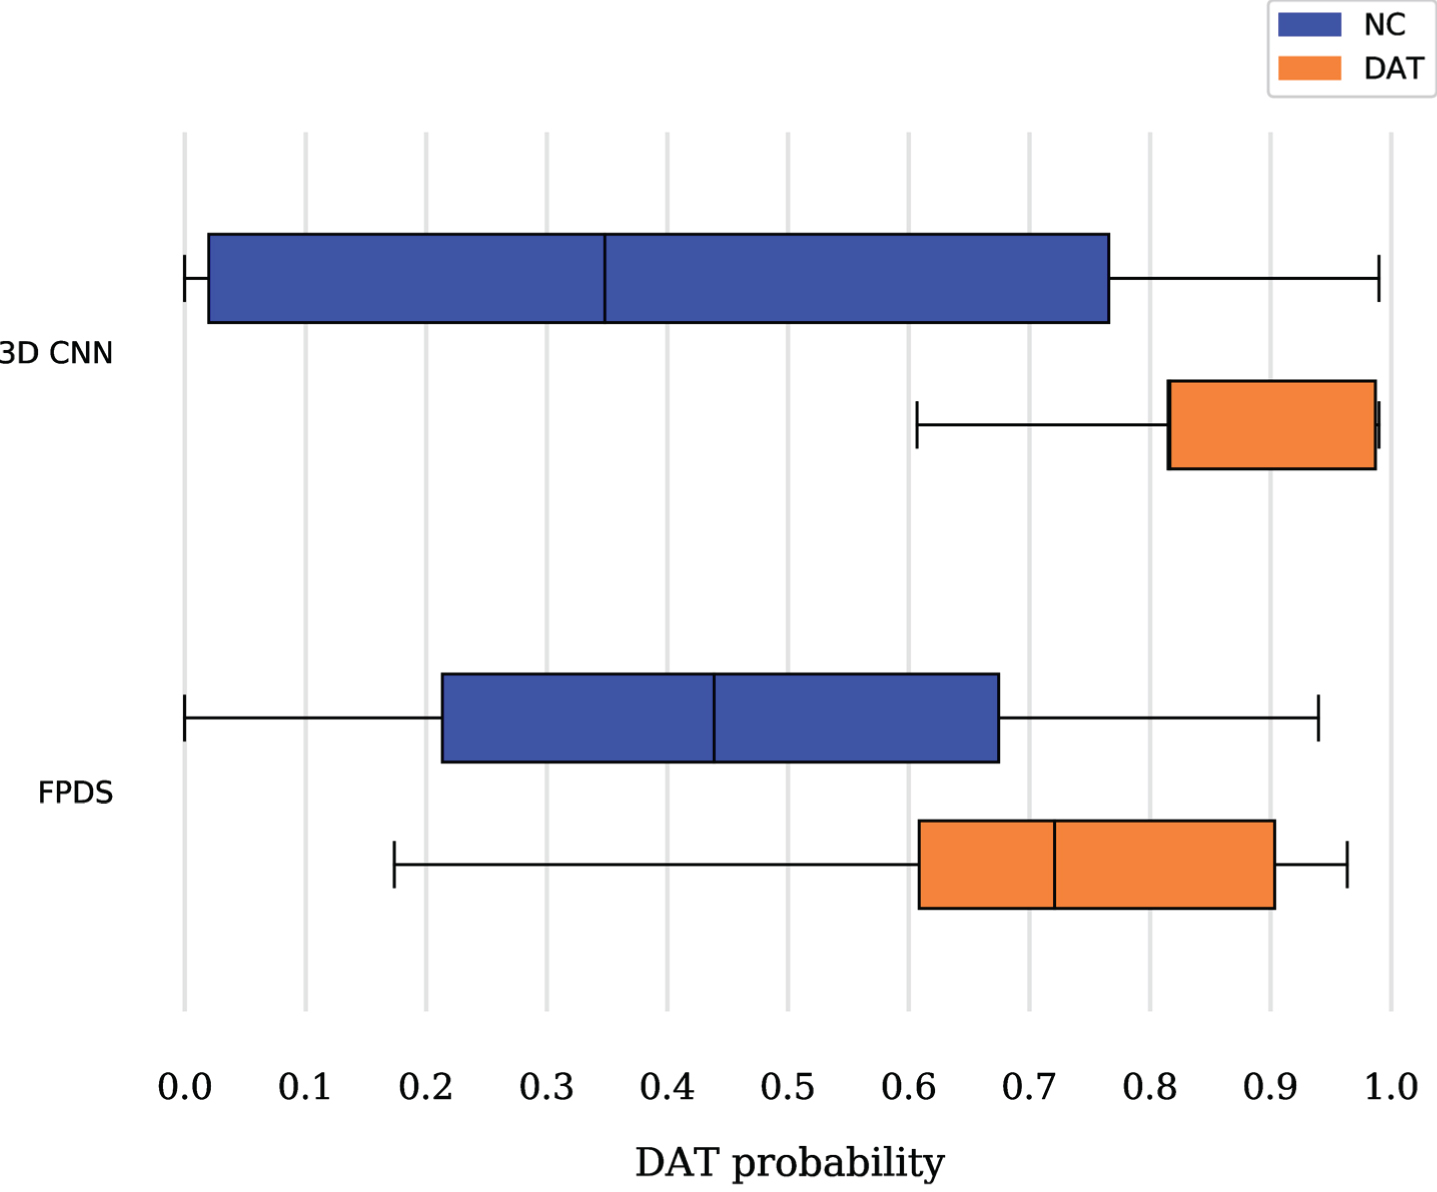
Distribution of predicted DAT probability scores in 3D CNN and FPDS methods, among subjects labelled as non-AD (blue) and DAT (orange) by trained nuclear physicians.
To further elucidate the classification accuracy of our models, we examined model performance sepa-rately among scans in which the FPDS and 3D CNN models reached consensus (N = 410) or did not (N = 109). Among consensus scans, the 3D CNN achieved an AUC of 0.873 while FPDS performed at an AUC of 0.836, indicating equally strong classification performance. Similarly, sensitivity and specificity were equal among the two models at 75% and 85%, respectively. In non-consensus subjects, the 3D CNN out-performs FPDS in AUC (0.638 in 3D CNN and 0.397 in FPDS), and has higher sensitivity, reaching 78% compared to 21% in FPDS. FPDS out-performed 3D CNN only in specificity, achieving 61% compared to 39% in 3D CNN.
Finally, Table 3 shows results from the originally published [23, 27] for the purposes of comparison with those reported in the present independent analysis.
Previously reported classification performances on ADNI images
3D CNN, 3 dimensional convolutional neural network; AUC, area under the curve; CV, cross-validation; FPDS, FDG-PET DAT Score; sDAT, stable dementia of the Alzheimer’s type; sNC, stable normal control. aPopuri et al., 2018 [23]; bYee et al., 2019 [27]. †Includes images of MCI, progressive MCI, and progressive NC subjects.
DISCUSSION
In this work, we present our study to exemplify a double blinded clinical evaluation of two previously published classification models for quantification of DAT probability in a completely independent, clinical sample. To our knowledge, our study represents the largest independent blinded clinical sample used to validate classification models for DAT from only FDG-PET images. Both the feature-engineered (FPDS) and the non-feature-engineered (3DCNN) classifiers demonstrated similar level of accuracy. More specifically, the 3D CNN model demonstrated 84% sensitivity and 67% specificity for DAT prediction on the independent test set. Comparatively, the FPDS model performed with 74% sensitivity and 71% specificity on the independent sample. Interestingly, for subjects in which the two models reached consensus, the performance of the 3D CNN and FPDS models are almost identical, with only slight advantage for 3D CNN in the AUC. On the other hand, among non-consensus subjects, 3D CNN achieves higher AUC and sensitivity, and FPDS shows higher specificity. Increased AUC and sensitivity among non-consensus subjects in 3D CNN may indicate a lower false classification rate.
Crucially, while overall classification performance is lower than has been previously reported for discrimination between DAT and non-DAT (up to 96.0% accuracy for DAT/non-DAT classification and 84.2% accuracy for the prediction of MCI to DAT conversion [37], the present data reflects a more heterogeneous real-world clinical cohort. Indeed, classification performance was similar to that which was previously reported in Yee et al. [27] and Popuri et al. [23] when performance was evaluated on ADNI subjects who did not remain in the diagnostic cohorts of non-DAT or DAT for the length of the study (marked as “other subgroups” in Table 3). Briefly, in both previously reported methods, FDG-PET data from groups uNC (unstable NC, representing NC subjects who convert to MCI), sMCI (stable MCI, representing MCI subjects who do not progress to DAT) along with images from the pNC (progressive NC, representing NC subjects who convert to DAT) and pMCI (progressive MCI, representing MCI subjects who do progress to DAT) constituted an independent validation set used for evaluating the proposed models. Table 3 reflects classification accuracy in both models when assessing individuals across the DAT spectrum, reflecting a more realistic assessment of the model capability. When comparing the present findings to the evaluation of our previous models with independent test sets, accuracy was similar in both models of the present study. In the present study, AUC was similar, sensitivity was superior and specificity worse than in both Yee et al. [27] and Popuri et al. [23].
In the present study, a trained nuclear physician provided expert opinion as to the presence/absence of DAT which, although the clinical gold standard, is necessarily a binary classification. Importantly, our previous research [27] found that within DAT “positive” individuals, there was heterogeneity in DAT scores, with higher DAT scores in patients with early DAT, followed by pMCI then pNC. Stratification of the sample according to future disease progression allows for better elucidation of the progressive continuum of DAT. Unfortunately, the present study was a cross-sectional design, so detailed clinical follow-up data was not available to compare with longitudinal ADNI data.
In the present study, we examined classification accuracy on an independent, clinical, real-world sample that was also relatively large, reflective of the clinical data that machine learning methods were designed to be able to analyze. In their meta-analysis of machine learning techniques in neuroimaging for MCI and dementia, Pellegrini et al. [38] noted that while there is strong accuracy across studies in differentiating healthy control subjects from individuals with dementia, their performance when identifying individuals at high risk of developing dementia in the future is poorer. Importantly, machine learning models discriminating between DAT and non-DAT are the least clinically relevant, i.e., such diagnostic studies are of limited utility for clinicians, when the need is critically for reliable and validated methods for confirmation of the presence of DAT in the face of unclear and/or discrepant diagnostic information.
Additional notes on data preprocessing pipeline
In the preprocessing steps of our methods, individual variations in metabolism were controlled by normalizing the FDG-PET values to the brainstem to generate the SUVR measures, which has been validated in previous studies as an efficient normalization method to control individual variations including those of age and sex [39, 40]. In addition, better controlling of confounding covariates such as age and sex may further improve the diagnostic power of machine-learning and data-driven approaches [41]. However, it has been shown that, age and sex-based correlation with metabolism is not evenly distributed across brain regions, and caution shall be taking to choose the appropriate regions and methods for suitable removal of confounding covariate influence. Further studies are needed to develop data-driven methods to achieve optimized data harmonization prior to machine-learning-based classification.
The features derived from the “feature-enginee-red” and “non-feature-engineered” approaches are different, as well as the processing steps. Therefore, preprocessing parameters reflecting the development of the two approaches were chosen and compared. The section “FDG-PET DAT score” in our Methods describes the “feature-engineered” method. In this approach [23], the features were computed by extracting the patch-wise brain region parcellations. The patch segmentations were pre-computed on the structural MRI template image (MNI152) image and then mapped to the corresponding FDG-PET space to compute the patch-wise average SUVRs as the input feature of the machine-learning classifier. Therefore, registration step here is part of the “feature-engineering” step, and DOF of 9 was used to ensure accurate mapping between MRI ad FDG-PET and consequently accurate feature extraction. The template patch segmentations were then transformed into the original FDG-PET space to calculate the metabolic features. On the other hand, the section “3D Convolutional Neural Network DAT score” describes the “non-feature-engineered” approach using 3D CNN, in which the registration step was used mainly to correct for pose differences, as the convolutional neural network is not rotation invariant [27] and global scale to account for differences in head size across individuals, to enable the network to reduce this degree of non-useful variation. Therefore, in this approach the FDG-PET images are registered to the template (MNI152) with “intra-modal linear registration facility” from FSL-FLIRT program, with a DOF of 7 to account for rigid transformation, as well as global scaling factor to adjust for head size difference among subjects 1 .
Limitations of the current study and potential future directions
Our study had several limitations. First, clinical reports and consensual read by two expert physicians defined the clinical gold-standard for DAT diagnosis. Therefore, the present results reflect the ability of the models to produce classifications in accordance with expert clinical readers. However, missing the long-term clinical follow-up and confirmed autopsy diagnostic data, absolute truth in the clinical diagnosis could not be confirmed. It has been previously shown that there are also variations in accuracy of clinical diagnosis from radiologists with different level of experience [42]. Accordingly, we were not able to assess the ability of our models to outperform expert reading. This could have resulted in underestimation of the diagnostic performance of the model by negating its analytic ability beyond that of a human reader. Further studies with longer clinical follow-up and autopsy results as well as future refinement of the definition of Alzheimer’s disease may alleviate this drawback. Additionally, data regarding participant’s education and race/ethnic status was unavailable in the present study, limiting the generalizability of findings.
Next, the classifiers evaluated in this study are trained with sNC and sDAT data from ADNI, in which subjects with other types of dementia are excluded. On the other hand, in the independent clinical validation dataset, the subjects are classified as non-DAT and DAT instead. The non-DAT subjects are those who present for FDG-PET imaging due to suspicion of neurodegenerative disease, but are not assessed as DAT. While non-DAT, these may still include potential diagnosis of other types of cognitive impairment, or other types of dementia, such as frontotemporal dementia or Lewy body dementia. Given the fact that the models were only trained on sNC and sDAT dataset, these alternative presentations in the non-DAT subgroup likely accrues uncertainty in their classification results. Nevertheless, both evaluated classifiers output a probabilistic DAT score instead of a binary classification, which is being tested for its ability to take such uncertainties into account. Potentially, this can be improved by including additional types of dementia, or even ‘mixed’ dementia subjects during the training of the classifier, thus generating probability scores for different dementia types. However, this would require multiple folds of training datasets and additional factors such as balance of data between classes of dementia, data harmonization to build a normative training dataset and removing the effect of data collection site would need to be completed.
One important question regarding the clinical translation of the proposed dementia scores is its generalizability beyond the training database. For example, both of our proposed approaches are trained on the ADNI database with subjects in the 70–80 age range. Our previous independent evaluation on different database across different age groups indeed showed reduced prediction accuracy away from the age of the training database [23, 27]. Such domain bias cannot be removed with simple regression-based methods as pathological progression across age might not be linear when comparing younger individuals and aged individuals. One straight-forward way to mitigate this issue is to expand the training database to include younger subjects, although FDG-PET data from younger, and specifically non-DAT subjects are scarce. Another potential way to address this issue of unbalanced age would be data aggregation from other cohorts during the training process. However, caution is needed to combine imaging data from different cohorts, as proper data harmonization would be necessary to remove potential site-specific domain variation caused by image acquisition protocols or calibration procedures.
Finally, some images acquired for the present study were constrained by a limited field of view, without data from the cerebellum. The cerebellum has been demonstrated as useful in predicting DAT probability within NCs [27]. Such problems are common and often unavoidable in clinical data where the primary purpose is to inform clinical diagnosis, rather than collecting the highest possible quality data for research purposes. Finally, the present study was conducted on FDG-PET images without co-registration with associated individuals’ MRI, and this may lead to suboptimal performance from the FPDS which was originally developed with the individuals’ MRI being available for co-registration. Hence, our sample and approach are reflective of a real clinical application where only one neuroimaging acquisition (FDG-PET) has been performed, and a MNI template is used in lieu of the individuals’ own brain MRI.
CONCLUSION
This study illustrated the importance of the blinded evaluation in order to assess the model performance by using previously unseen clinical data. In addition, the results of this study demonstrated good generalizability for two of our previously proposed models, using hand-crafted features (FPDS) or non-engineered features (3D CNN). The results of blinded clinical evaluation shown in this paper mark an important and necessary step for the translation of pre-trained machine-learning models into the clinical practice.
Footnotes
ACKNOWLEDGMENTS
Funding for this research is gratefully acknowledged from Alzheimer Society Research Program (ASRP 19–09), National Science Engineering Re-search Council (NSERC), Canadian Institutes of Health Research (CIHR), Brain Canada Foundation, Pacific Alzheimer’s Research Foundation, the Michael Smith Foundation for Health Research (MSFHR), and the National Institute on Aging (R01 AG055121–01A1). We thank Compute Canada for the computational infrastructure provided for the data processing in this study.