
Abstract
Background:
Olfactory dysfunction (OD) is an early symptom of Alzheimer’s disease (AD). However, olfactory testing is not commonly performed to test OD in the setting of AD.
Objective:
This work investigates objective OD as a non-invasive biomarker for accurately classifying subjects as cognitively unimpaired (CU), mild cognitive impairment (MCI), and AD.
Methods:
Patients with MCI (n = 24) and AD (n = 24), and CU (n = 33) controls completed two objective tests of olfaction (Affordable, Rapid, Olfactory Measurement Array –AROMA; Sniffin’ Sticks Screening 12 Test –SST12). Demographic and subjective sinonasal and olfaction symptom information was also obtained. Analyses utilized traditional statistics and machine learning to determine olfactory variables, and combinations of variables, of importance for differentiating normal and disease states.
Results:
Inability to correctly identify a scent after detection was a hallmark of MCI/AD. AROMA was superior to SST12 for differentiating MCI from AD. Performance on the clove scent was significantly different between all three groups. AROMA regression modeling yielded six scents with AUC of the ROC of 0.890 (p < 0.001). Random forest model machine learning algorithms considering AROMA olfactory data successfully predicted MCI versus AD disease state. Considering only AROMA data, machine learning algorithms were 87.5%accurate (95%CI 0.4735, 0.9968). Sensitivity and specificity were 100%and 75%, respectively with ROC of 0.875. When considering AROMA and subject demographic and subjective data, the AUC of the ROC increased to 0.9375.
Conclusion:
OD differentiates CUs from those with MCI and AD and can accurately predict MCI versus AD. Leveraging OD data may meaningfully guide management and research decisions.
INTRODUCTION
Due to the aging population, the number of individuals with Alzheimer’s disease (AD) is expected to triple to 13.8 million by 2050 [1]. There is a critical need for a reliable and noninvasive biomarker that can both detect early disease and is predictive of subsequent disease course. Olfactory dysfunction (OD) is well-documented in AD and often precedes neurocognitive decline by many years [2]. Deposition of neurofibrillary tangles in olfactory structures occurs early in preclinical AD; severity of deposition and OD increases with neurocognitive disease progression [3–5]. This neuropathology creates OD that is both greater in magnitude than that occurring with typical aging and can be detected in pre-symptomatic AD [6]. While utilization of objective olfactory function has been suggested as early as 1988 for early detection of OD, it is not standard of care [7].
We have previously developed a novel, cost-effective, essential-oil based olfactory test—the Affordable, Rapid, Olfactory Measurement Array (AROMA)—which tests both olfactory detection and identification [8]. We have previously demonstrated different olfactory phenotypes—scent-specific detection and identification patterns—when comparing healthy controls to those with sinonasal disease. In this study, we investigate the hypothesis that AROMA olfactory phenotypes can differentiate cognitively unimpaired (CU), mild cognitive impairment (MCI), and AD populations from one another. This hypothesis is supported by recent studies demonstrating that OD that may distinguish AD from aging-related OD [9] and predict conversion from MCI to AD [10].
The primary outcome of this study was the ability of AROMA and Sniffin’ Sticks Screening 12 Test (SST12)—overall detection and identification performance and scent-specific findings—to differentiate these populations using traditional statistics as well as machine learning (ML) algorithms. Secondary outcomes were the correlation of AROMA to patient-reported outcome measures (PROMs) related to sinonasal health and olfaction (Sinonasal Outcome Test [SNOT-22] [11] and Questionnaire of Olfactory Disorders - Negative Statements [QoD] [12, 13], respectively).
MATERIALS AND METHODS
This project was reviewed by the University of Kansas Institutional Review Board and approved prior to commencement of study activities. All participants signed an approved informed consent document. All data was securely captured and stored via REDCap [14].
Patient population
Patients between the ages of 58–98 presenting to the Alzheimer’s Disease Center Memory Clinic were prospectively evaluated for eligibility by neurologists through clinical history, review of systems, neurologic exams, and cognitive exams. Patients diagnosed with MCI or AD by the neurologists were eligible for inclusion. Mini-Mental Status Exam (MMSE) scores were reported by the neurology team, and patients were enrolled within 2 months of evaluation. Patients with other simultaneous neurodegenerative conditions such as Lewy body dementia were excluded. Additional exclusion criteria included known confounders of olfaction such as sinonasal disease, systemic conditions known to impact the sinonasal cavity, and immunodeficiencies. Due to the anticipated difficulty in completing study methodology, individuals with MMSE scores of < 7 were excluded. CU seniors between the ages of 58–98 without neurocognitive disorders or sinonasal disorders based on patient history and self-reported current health status were prospectively enrolled to serve as controls.
Methods of assessment
Participants completed the SNOT-22 [11], QoD-NS [12, 13], SST12 [15], and AROMA [8].
The SNOT-22 is the most commonly utilized instrument measuring subjective burden of sinonasal symptoms. It consists of 22 questions, with each question receiving a score of 0–5, for a total range of scores from 0–110. Higher scores represent worse symptoms.
The QoD-NS measures the impact of olfactory dysfunction on daily life. It consists of 17 items. Each question is scored 0–3 points and the total range of points is 0–51. Higher scores represent worse olfactory impairment on quality of life.
SST12 [16] consists of 12 felt-tipped pens with 12 different, suprathreshold odorants. Each stick is presented to the participant for a short time under each nostril; then the participants are asked to select the scent among four multiple choices. For the purpose of comparing AROMA to SST12, and to test the hypothesis that detection and identification abilities would differ between cohorts, participants indicated whether or not they detected a scent (yes/no) prior to the forced multiple choice added to the normal SST12 protocol.
AROMA contains fourteen scents at different concentrations [8]. To capitalize on our ability to titrate odorant concentration, in combination with the known OD that accompanies both aging and neurocognitive disease, two additional higher concentrations were added to the previously published methodology to increase the ability to detect olfactory reserve in individuals resulting in 4 concentrations (1X, 2X, 4X, 8X). The 14 scents at 4 concentrations consist of a full battery of 56 inhalant sticks. However, not every individual is presented with every stick. Each individual begins at the 2X concentration. All scents at a particular concentration are completed before moving to the next round of testing at a different concentration. The sequence of odors for each concentration is randomized prior to presentation. A correct response requires both correct detection of an odor (scent detection is measured as “percent detected”) and correctly selecting the present odor among four multiple choices (scent identification is measured as “percent correct”). Failure to respond correctly results in being presented with the next higher concentration in random order during the next round of testing. Correct response at the 2X concentration results in the individual being presented with the 1X concentration and assumes correct responses at the 4X and 8X concentrations. As such, the maximum number of inhalant sticks presented to an individual is 42. In addition to scores for individual scents at each concentration, a composite score for each scent is calculated. The maximum composite score is 100. Data capture occurs via an integrated electronic workflow. All data is entered in real-time into REDCap and scored immediately. While AROMA is administered in a proctored setting to ensure uniform methods in a research setting, AROMA was designed with eventual self-administration in mind.
Statistical analysis
Study data were collected and managed using REDCap electronic data capture tools hosted at the University of Kansas Medical Center. Data were analyzed using R Version 3.6.1 (R Foundation for Statistical Computing, Vienna, Austria) and SPSS Version 25 (IBM Corporation, Armonk, NY). Correlation between scale variables was assessed using Spearman’s rho. Scale variables were compared between groups using Kruskal-Wallis tests, with post-hoc pairwise comparisons using Dunn’s test, as appropriate. Categorical variables were compared between groups using Chi-Squared tests.
A generalized linear model (GLM) using Gamma as the distribution and Log as the link function was used to analyze patient factors influencing the composite AROMA score. A main effects model was built that considered age, gender, and neurologic state (CU, MCI, AD). The adjusted ratio for each factor was assessed by exponentiating the estimated model parameter. The adjusted ratio was reported along with their 95%confidence interval.
The ability of AROMA and SST scent measures to distinguish AD from MCI was further explored via regression modeling. AROMA scent measures, age, and gender were submitted to binary logistic regression analysis using a stepwise selection procedure. Only items that were related (p < 0.10) to the outcome after adjusting for all other items were retained. Similarly, a second model was developed utilizing the same technique but replacing the AROMA scent measures with the binary scent identification from SST. The ability of each model to classify individuals with AD was determined by calculating receiver operating characteristic curves. A nonparametric test using the Delong method was then used to compare the difference in areas under the curves (AUCs) between models [17, 18].
Machine learning
Data preprocessing
Missing survey response data was assigned a value of “Unknown.” The dataset was split using an 80:20 distribution whereby the machine learning algorithms were trained using 80%of the available subjects and tested using the remaining 20%.
Model training
Predictive models were developed using all available variables to classify subjects as normal or AD/MCI. Next, recursive feature elimination was applied to identify the most important variables to optimize machine learning classification performance. To ensure model stability and reduce bias, 5-fold cross validation was performed during training. The training data was used to train multiple classification algorithms to differentiate normal subjects from those with AD or MCI. For this study, a random forest architecture was used, which is an ensemble algorithm in which a series of decision trees are generated to predict the outcome of interest using a random subset of variables [19]. Each individual tree generates a prediction and the class (normal versus AD/MCI and normal versus MCI versus AD) with the most votes is the model’s overall prediction. Hyperparameters were tuned to maximize AUC.
Model validation
Classification performance of the machine learning algorithms was then evaluated on the test data by comparing AUC and classification accuracy. Relative influence of each variable included was calculated. All machine learning and data analysis was performed with R Studio version 1.1.463 (R Studio, Boston MA).
RESULTS
Population completing AROMA and SST12
Total enrollment was 81 (n = 33 CU, n = 24 MCI, n = 24 AD). SNOT-22 and QoD were not significantly different between groups. The cohort was biased toward males in the CU population and toward females in the MCI/AD cohorts. Age was significantly different in the CU group compared to the MCI/AD cohort (Table 1). Multivariate analysis of the AROMA identification score, controlling for age and gender, demonstrated that CUs had 74%higher scores than AD (95%CI: 28%–136%, p < 0.001) and 36%higher scores than MCI (95%CI: 1%–86%, p = 0.048).
Demographics
[scale variables presented as median(IQR)].
Correlation of AROMA to SST12 was statistically significant for CU, MCI, and AD (ρ= 0.582, ρ= 0.640, ρ= 0.846, respectively; all p < 0.001). Age and SNOT-22 rhinological scores correlated with both SST and AROMA olfactory assessment scores in CU (Table 2).
Correlation coefficients for Sniffin’ sticks and AROMA stratified by cohort
Scent identification and detection across cohorts
All cohorts experienced higher levels of detection rates than identification rates. CU performed best, and AD worst, on all scents with respect to both detection and identification (Fig. 1). CU did not correctly identify a scent after AROMA detection in 10.7%of cases. The gap between detection and identification within the MCI and AD cohorts was significantly increased with 28.5%and 33%failure to identify correctly after detection in MCI and AD cohorts, respectively. SST gaps were 8%, 37.5%, and 58%for CU, MCI, and AD, respectively.

Box plots of identification versus detection for (A) Cognitively unimpaired, (B) Mild cognitive impairment, and (C) Alzheimer’s disease.
Scent-specific findings
Scent-specific pairwise comparisons of composite scores for AROMA and SST12 and each concentration were performed on all scents to compare the three cohorts (Fig. 2). Clove composite score and 2X lavender were the only scents that significantly differentiated between CU, MCI, and AD (p < 0.05). There were no SST12 scents where performance was significantly different between all three groups. Performance on 8X clove, 4X cinnamon, and SST12-fish scents were significantly different between the MCI and AD cohorts (all p < 0.05).
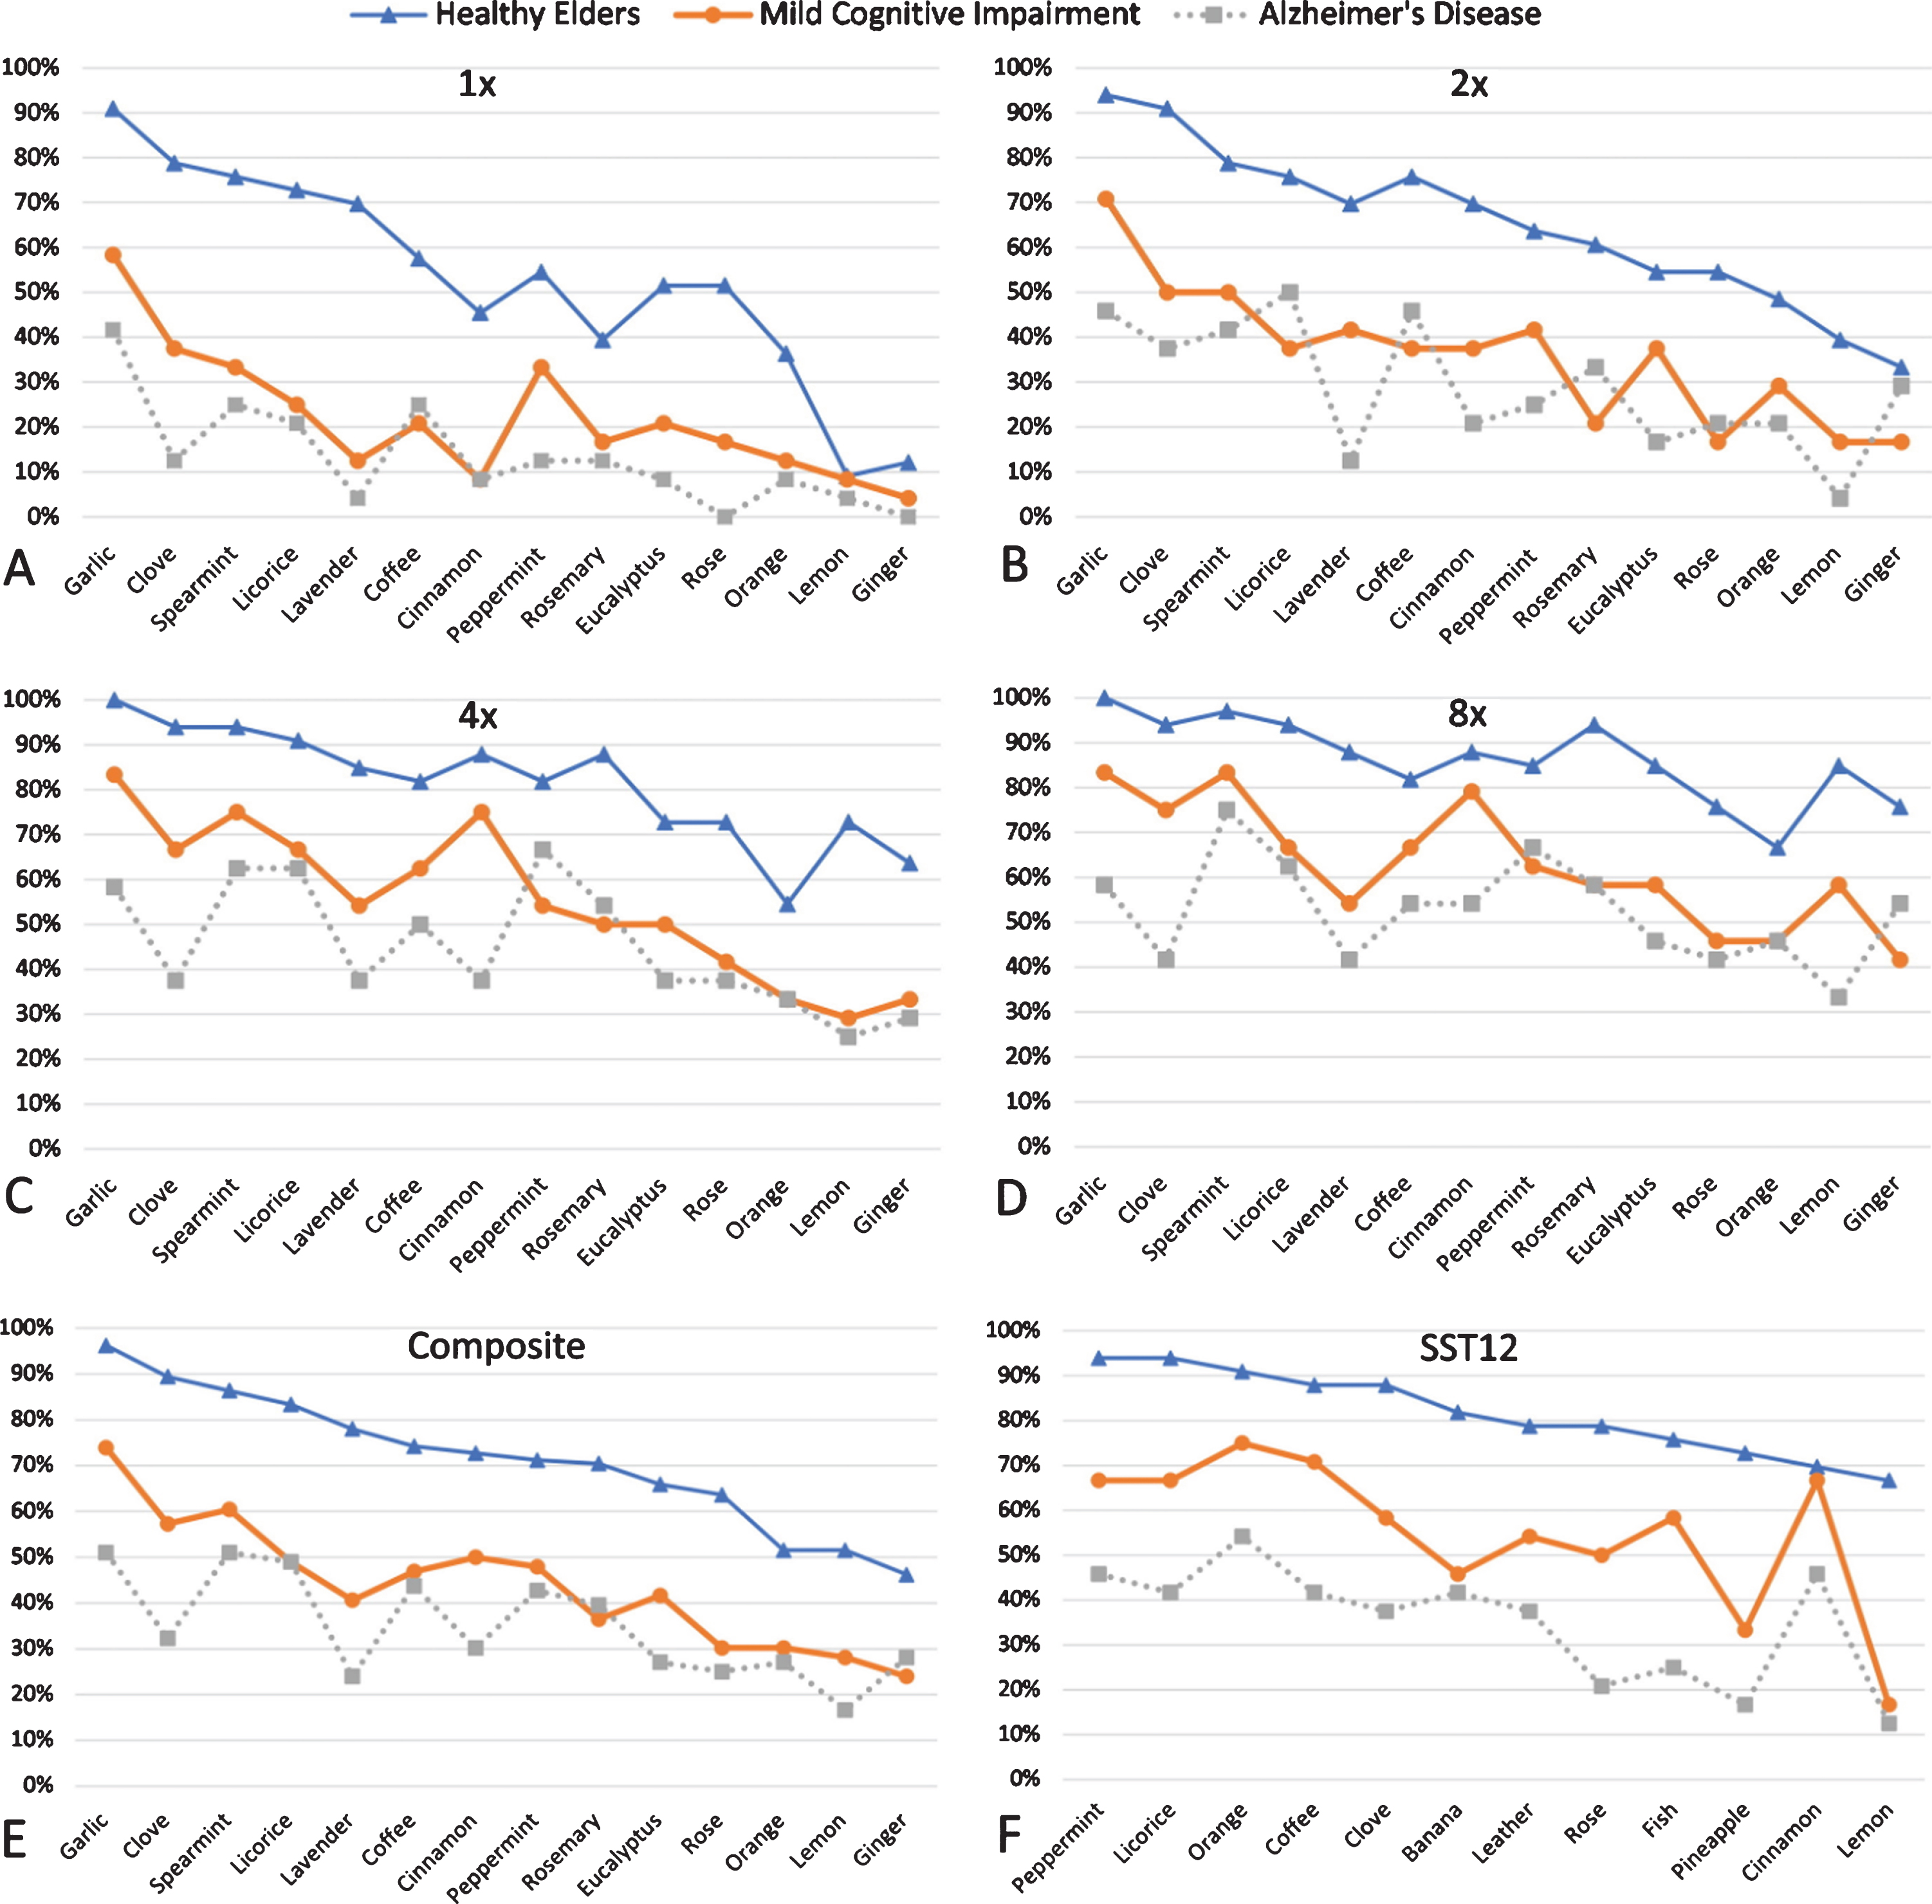
Percentage of correct identifications for AROMA at: A) 1X, B) 2X, C) 4X, D) 8X, and E) Composite Score, and F) SST 12 scents.
AROMA and SST scent specific regression modeling: MCI versus AD
Regression modeling of the classification between MCI and AD was first performed with AROMA scent measures. The final model was statistically significant (p < 0.001) and retained six scent variables: spearmint, licorice, garlic, coffee, lemon, and clove. The AUC of the ROC was 0.890, p < 0.001 (Fig. 3a) and correctly classified 77.1%of individuals with MCI or AD. The model was repeated with SST12 measures. This model was also statistically significant (p = 0.007) and retained only two scent variables: rose and fish. The AUC of the ROC for SST12 was 0.741, p = 0.004 (Fig. 3b). The AUC of the model with AROMA scent measures was significantly greater than the model with SST measures (p = 0.044).
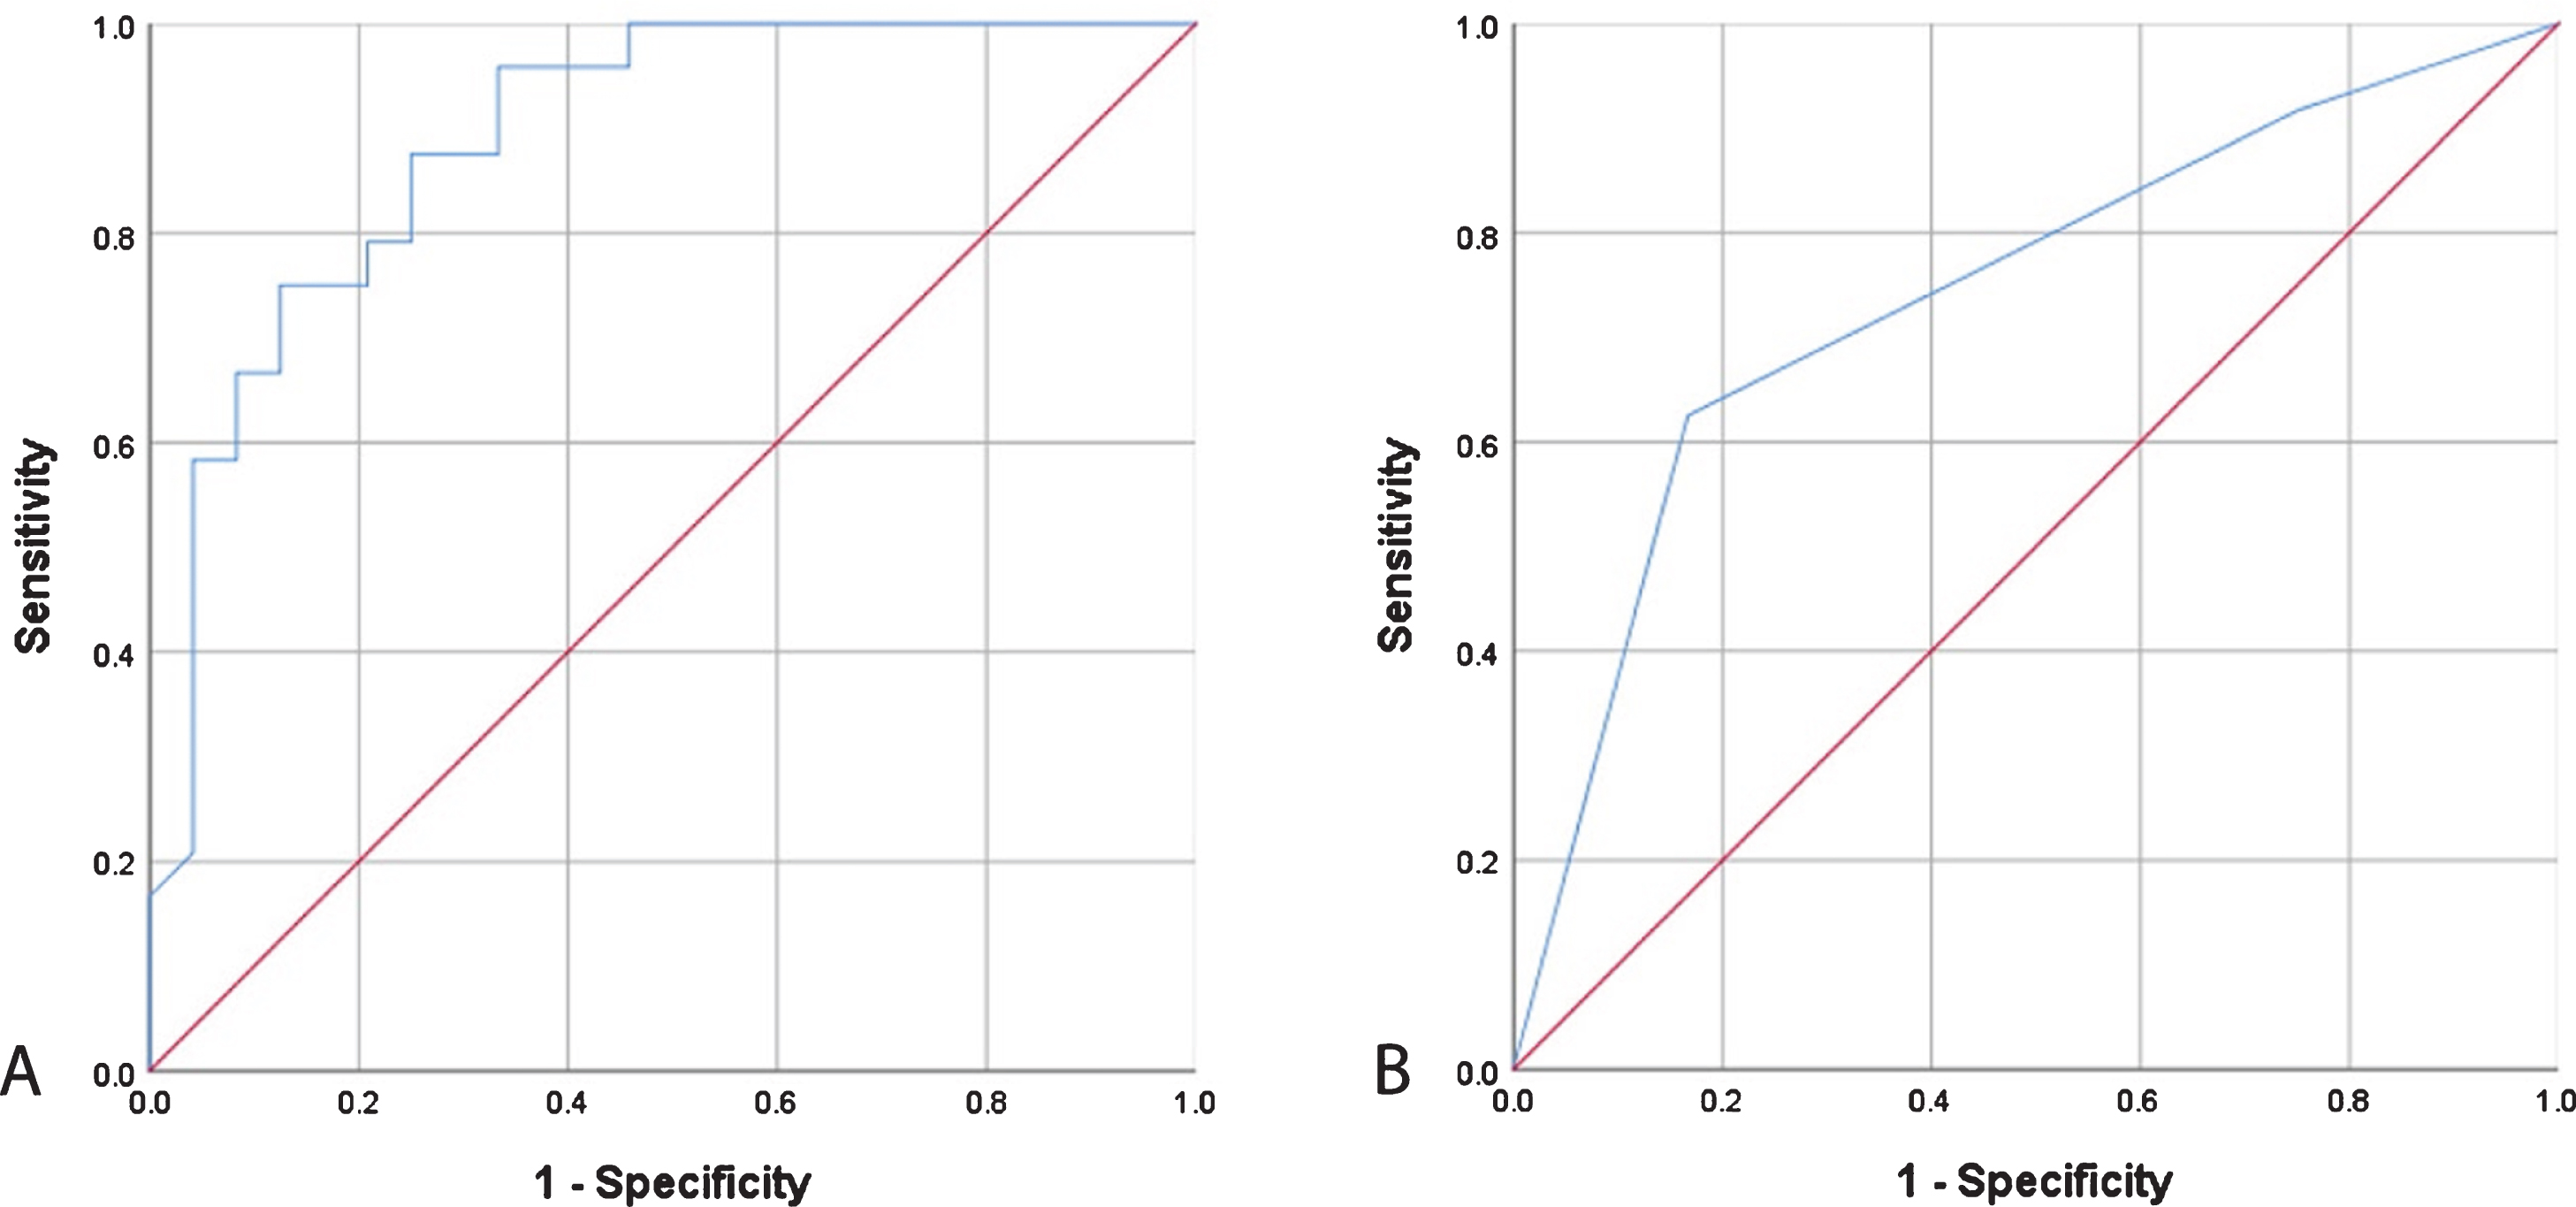
Receiver operating characteristic curves from regression modeling of (A) AROMA scent measures and (B) Sniffin’ Sticks measures for classifying Alzheimer’s disease from mild cognitive impairment.
Machine learning considering all data
The best classification performance was achieved using a random forest architecture and had an AUC of 0.94 on the test data. Hyperparameter values selected to optimize model performance were: number of variables per split = 2, splitting rule = “gini”, minimum node size = 1. Relative importance of the variables used to develop the decision forest classifier is shown in Table 3. The direction of the relative influence is not provided in the ML analysis and must be inferred. Table 4 displays predictions of random forest model for 20 test subjects and the sensitivity, specificity, and predictive values of the machine learning algorithms generated from our data. Of note, sensitivity was 100%and specificity was 83%; positive predictive value was 90%and negative predictive value was 100%; accuracy 93.3%.
Relative influence of variables used in random forest classifier to differentiate normal from Alzheimer’s disease/mild cognitive impairment
Predictions of random forest model for 20 test subjects and the sensitivity, specificity, and predictive values of the machine learning algorithms
*All findings in associated column are statistically significant with p < 0.05. PPV, positive predictive value; NPV, negative predictive value. +ML algorithms considered olfactory, demographic, and patient reported outcome measures.
Value of AROMA and SST12 data in differentiating MCI from AD (Table 4)
Only AROMA was able to accurately classify MCI versus AD at a statistically significant level (p = 0.035). When considering only AROMA data, ML algorithms were 87.5%accurate (95%CI 0.4735, 0.9968). Sensitivity and specificity were 100%and 75%, respectively with ROC of 0.875. When the algorithms considered AROMA as well as subject demographic and subjective data, the AUC of the ROC increased to 0.9375.
Best performing algorithms derived from SST12 data alone did not yield statistically significant results (p = 0.363). Due to relatively small sample sizes, specific variables and their relative influence are unable to be reported.
DISCUSSION
This was a cross-sectional study investigating differences in olfactory function in CU, MCI, and AD subjects utilizing AROMA and SST12 and ability of olfactory phenotypes—scent specific patterns of responses—to differentiate between these disease states via traditional statistics and machine learning. Considering the large “baby boomer” population of the United States and projected increases in the medical, societal, and economic impact of MCI/AD, point-of-care, validated, and cost-effective biomarkers to screen, diagnose, and monitor neurocognitive disease are desperately needed. We found that CU scored significantly higher on all olfactory metrics than those with MCI and AD. Detection of scents, but inability to correctly identify them, was a hallmark of both MCI and AD. Regression modeling retained six-scents that were able to differentiate MCI from AD with 77%accuracy and AUC of the ROC of 0.890 (p < 0.001). ML was able to distinguish CU from MCI/AD with 93%accuracy. A correct response at the 1X concentration of lavender displaying a relative influence of 31.69 (next most influential variable has a relative influence of 18.59). ML algorithms were 87.5%accurate in classifying MCI versus AD. Taken together, these results indicate a role of olfactory function and scent specific phenotypes as potential AD biomarkers.
There is a critical need for AD biomarkers able to detect disease or predict progression prior to neurocognitive symptom onset. Olfaction is a promising biomarker for AD as OD precedes clinical disease by years and has been shown to be an independent risk factor for neurocognitive decline. Additionally, OD can be noninvasively longitudinally monitored, and objective testing could be completed in a primary care setting. Our results support the potential utility of olfaction as a biomarker for neurocognitive disease, particularly scent-specific findings. Prior studies have reported scent-specific profiles with a subset of UPSIT scents that can identify those at risk for AD with relatively high sensitivities, specificities, and AUCs [10, 20]. Tabert et al. showed superiority of ten specific scents on UPSIT to the Brief Smell Identification Test [10]. However, there is a lack of consistency of the identified set of scents of importance in the published literature. Nonetheless, these findings support our data that there are scent-specific differences in olfactory ability that reflect neurocognitive disease state.
It is important to note that “real world” olfaction requires processing of complex blends of odorant molecules [21, 22]. Essential oils are inherently complex and may be more functionally relevant for olfactory testing and subsequent analysis. This is because recent human data indicate that the brain encodes perceptual representations of smells via synthesis of different olfactory inputs into a single perceptual experience. This is also known as an odor object. The identification, categorization, and discrimination of olfactory stimuli relies on the formation and modulation of odor objects in the piriform cortex [21, 24]. Additionally, piriform cortex processing involves both synergistic and suppressive mechanisms that are dependent upon odorant mixture composition [3]. Murine and human models demonstrate that whole odors and their component parts can be processed and interpreted as different entities [22, 25]. Human studies have previously demonstrated that the perception of complex odorants is not just a simple sum of the percepts of the individual components [22]. As such, presentation of “whole odors” may be critical for the brain to recognize an odorant. For these reasons, complex odors, such as essential oils, may be better suited for olfactory testing, especially in pathologies like AD where stepwise progression of neurocognitive deficits may be accompanied by stereotypic olfactory phenotypes. This may explain the stronger correlation of AROMA with other data, including PROM and the retention of AROMA scents, but not SST12, in ML algorithms.
With respect to leveraging olfactory data to accurately, and noninvasively classify neurocognitive disease state, regression modeling in this study retained six scents—spearmint, licorice, garlic, coffee, lemon, and clove—that were able to differentiate MCI from AD with 77%accuracy and AUC of the ROC of 0.890 (p < 0.001). Our machine learning analysis confirms these results and identified the ability to detect lavender at the 1X concentration, lemon at the 4X concentration, and clove at the 1X concentration to have relative influences of 31.69, 18.59, and 8.17, respectively. Age and gender were also significant influences, which is in agreement with numerous studies demonstrating that olfactory ability is typically greater in females [26] and decreases with age [27]. Interestingly, detection of a scent when presented with the negative control displayed a relative influence of 2.25. While the direction of the influence is not provided in the ML analysis, it is likely that false perception of scent may indicate global processing issues associated with MCI/AD [28, 29]. ML considering AROMA and SST data separately demonstrated that AROMA yielded promising algorithms with 100%sensitivity, 100%negative predictive value, and high overall accuracy (93.3%).
Prior studies have shown that olfactory detection does not require intact higher cognitive processing, whereas odor identification requires both semantic memory and higher executive functioning [30, 31]. Consistent with the literature on olfactory processing, in our study, the AD cohort experienced a significantly increased difficulty with correctly identifying a scent after detecting it. It is important to note that, if following recommended protocols, SST12 and UPSIT do not allow subjects to indicate if a scent was detected or not. Regardless of olfactory detection, subjects are prompted to select a response from a multiple-choice list. This may hinder their use in olfactory phenotyping as olfactory detection, which can occur consciously and unconsciously, may be a critical component [32]. If intended for use in neurocognitive disease screening, it may be beneficial to modify existing protocols and scoring metrics to include detection and identification.
The majority of individuals with AD are unaware of their olfactory deficits [33, 34]. A recent study showed that approximately 70%of individuals with OD reported no subjective changes in their sense of smell. At 5-year follow up, those who were unaware of their changes in smell had the greatest cognitive impairment [35]. OD also has implications for safety and health. Inability to detect hazards such as natural gas could potentially be deadly. Malnutrition, dehydration, and frailty have all been associated with OD [36–40]. Our results demonstrate no correlation between QoD-NS, a survey specific for the impact of OD on QoL, and objective olfactory performance. Simply asking patients about OD may not be a sufficient screening measure. Objective testing and proactive management of OD could reduce the risk of frailty and other morbidities in patients with MCI and AD.
The long-term goal of this work is to further streamline AROMA, based on robust machine learning and statistical modeling, such that objective olfactory testing is an accessible screening modality that can be deployed at a population health model. An abbreviated AROMA, with conserved performance in terms of sensitivity, specificity, and accuracy would be appropriate for home or point-of-care use, with results immediately available to guide clinical decisions. Because machine learning focuses on optimizing the accuracy of predictions, we hope that additional data, combined with advanced machine learning modeling techniques will result in a highly predictive and sensitive screening tool. While normal cognitive test certainly can be employed for screening purposes, several common such as the Montreal Cognitive Assessment requires trained personnel for administration. Subjective olfactory testing using AROMA circumvents some of these potential barriers to point of care or at home testing.
Limitations of this study include the gender and age differences between the cohorts. However, when these variables were controlled for, CU still performed significantly better than the MCI and AD cohorts, indicating that cognitive status was truly impacting olfactory performance. With respect to cognitive status, categorization of subjects into MCI and AD cohorts was based on diagnoses rendered during clinical neurologic evaluation. Further subgrouping into amnestic, nonamnestic, and/or multiple domain deficits was not done, nor was stratifying based on performance on neurocognitive evaluations. Additionally, issues with olfaction can be due to global processing deficits. However, we do not believe this to be a significant confounder because those with MCI and, to a greater degree AD, displayed scent-specific findings which were highly influential and the machine learning algorithms. This suggests that while global dysfunction may play a role in the overall poor performance of these cohorts, there is pathology specific olfactory dysfunction present as well. Sample sizes were relatively small and statistical models and machine learning may be overfit to the data. A larger sample size in all cohorts is needed to validate these findings, confirm and further refine our machine learning algorithms, and better control for potentially confounding demographic and disease-related factors. These efforts are ongoing. It should also be noted that the mechanisms and calculations by which ML constructs its algorithms occurs within a “black box,” which can be viewed as a limitation. Variables included in resultant algorithms are reported in order of importance and relative influence; the direction of the influence is not known and must be inferred from what is known in the literature.
CONCLUSIONS
This study responds to the need for point-of-care, validated, and cost-effective methods to screen, diagnose, and monitor neurocognitive disease. The detection of scents, but inability to correctly identify them, was a hallmark of MCI and AD and highlights the importance of olfactory testing that collects information on both detection and identification. Several candidate scents were identified as potential olfactory biomarkers in differentiating CUs, MCI, and AD using both traditional statistics and ML. ML generated 100%sensitive algorithms for the classification of MCI versus AD. Objective olfactory testing, and analysis of patterns of responses, holds promise as a biomarker and adjunctive data point in the diagnosis and monitoring of MCI/AD.
Footnotes
ACKNOWLEDGMENTS
The researchers would like to thank Bryan Humphrey (clinical research coordinator), Patrick Kim (medical student), Madeleine St. Peter (medical student), Cody Uhlich (medical student), Luke Bontrager (medical student), Chelsea Moore (medical student), and Joseph Penn (otolaryngology research fellow) for their aid with subject recruitment and testing.
This research received funding support from the University of Kansas Clinical and Translational Science Institute.