
Abstract
Background:
Dysfunction of microglia has been increasingly recognized as a causative factor in Alzheimer’s disease (AD); thus, developing medicines capable of restoring microglial functions is critically important and constitutes a promising therapeutic strategy. Honokiol is a natural neuroprotective compound extracted from Magnolia officinalis, which may play roles in AD therapy.
Objective:
This study aimed to evaluate the role and the underlying mechanisms of honokiol in microglial phagocytosis.
Methods:
MTT and flow cytometry were used to assess the cell viability and apoptosis, respectively. Phagocytic capacity, mitochondrial reactive oxygen species production, and membrane potential were evaluated using fluorescence microscopy. Seahorse XF24 extracellular flux analyzer was for cell glycolysis and oxidative phosphorylation detection. Mass spectrometry was applied for metabolites measurement. Quantitative real-time polymerase chain reaction and western blotting were performed to detect the mRNA and protein level of PPARγ and PGC1α, respectively.
Results:
Honokiol alleviated Aβ42-induced BV2 neurotoxicity. Honokiol promoted phagocytic efficiency of BV2 cells through reversing a metabolic switch from oxidative phosphorylation to anaerobic glycolysis and enhancing ATP production. Meanwhile, honokiol reduced mitochondrial reactive oxygen species production and elevated mitochondrial membrane potential. Moreover, honokiol increased the expression of PPARγ and PGC1α, which might play positive roles in energy metabolism and microglial phagocytosis.
Conclusion:
In this study, honokiol was identified as an effect natural product capable of enhancing mitochondrial function thus promoting microglial phagocytic function.
INTRODUCTION
The aggregation of amyloid-β (Aβ) is the key initial event in the pathogenesis of Alzheimer’s disease (AD) [1]. In AD, microglia play a critical role in the phagocytosis and degradation of Aβ. During the onset of AD, microglia show dysfunction and weakened phagocytic ability [2, 3]. When microglial dysfunction, the loss of phagocytic ability will significantly reduce the clearance rate of Aβ, and the subsequent increase in Aβ level can cause microglia damage through chronic activation [3, 4]. This vicious circle is a powerful driving force for neurodegeneration [5], and ultimately leads to serious irreversible neurodegenerative diseases. Therefore, the restoration of microglia function can rebuild neuronal homeostasis in AD brain. More and more research efforts are devoted to find drugs to regulate microglia dysfunction [6–8], thereby providing new targets for the treatment of AD.
Microglial phagocytosis greatly depends on the energy supply of mitochondria. A report indicated that metabolic dysfunction may parcipate in the etiopathogenesis of sporadic AD [9]. In addition, a metabolic switch from mitochondrial oxidative phosphorylation (OXPHOS) to glycolysis has been shown in microglia in AD [10–12]. Recently, a report demonstrated that the breakdown in metabolic reprogramming causes microglia dysfunction in AD [13]. Therefore, intervention in the metabolic reprogramming of microglia may be a potential approach for AD treatment.
At present, many natural products and traditional medicines have been described to have great potential in the prevention and treatment of AD [14, 15]. The field has focused on screening and developing drugs that are effective for AD from established traditional drugs and safe natural products. Honokiol, isolated from the bark of Magnolia officinalis, can cross the blood–brain barrier to play a neuroprotective role, due to its potent antioxidant activity, anti-neuroinflammation, and reduction neurotoxicity exerted by abnormally aggregated Aβ in Alzheimer’s disease [16]. In previous studies, honokiol has been proven to decrease Aβ-induced cell death by reducing reactive oxygen species (ROS) production and suppressing intracellular calcium elevation [17], and to protect against Aβ-induced neurotoxicity via GSK-3β [18] and NF-κB pathways [19]. In addition, honokiol can ameliorate memory deficits via its anti-amyloidogenic and anti-neuroinflammatory effects [20]. In our previous work, we have confirmed that honokiol increased the expression level and activity of mitochondrial sirtuin3 (SIRT3), significantly weakened the production of mitochondrial ROS in neuron [21]. However, the impact of honokiol on metabolic reprogramming, especially in microglia is not clear.
In this study, we reported a therapeutic role of honokiol in Aβ-induced metabolic disorder and microglia phagocytosis dysfunction.
MATERIALS AND METHODS
Cell culture and treatments
Murine microglial cells (BV2) were provided by the National Infrastructure of Cell Line Resource (Beijing, China). Cells were cultured in DMEM containing 10% FBS at 37°C and 5% CO2. After serum starvation, the cells were pretreated with honokiol for 2 h, and then co-cultured with Aβ for indicated hours. For experiments, cells were divided into four groups: control BV2 cells, control BV2 cells treated with honokiol, Aβ-stimulated BV2 cells, and Aβ-stimulated BV2 cells treated with honokiol.
Preparation of Aβ42 oligomers
1 mg Aβ42 lyophilized powder (Invitrogen, Carlsbad, CA, USA) was suspended in 1,1,1,3,3,3- hexa-fluoro-2-propanol (Sigma, St Louis, MO, USA) to a concentration of 1 mM, followed by vibration mixing to generate a homogenous suspension. Next, the peptide film solution was resuspended in dimethyl sulfoxide (DMSO) to 5 mM and sonicated for 10 min. Then, the DMSO-Aβ42 solution was diluted with cold phosphate-buffered saline (PBS) containing 0.05% sodium dodecyl sulfate (SDS) to 100μM, followed by a 24 h incubation at 4°C. Oligomer preparations were centrifuged at 13,000 rpm for 10 min at 4°C prior to use.
MTT assays
MTT assay (MTT Cell Proliferation and Cytotoxicity Assay Kit, C0009S, Beyotime Biotechnology, China) were employed to detect the cell viability. The cells were exposed to MTT for 4 h, and then added DMSO (200μl/well) into the medium, and the optical density at 570 nm was recorded.
Apoptosis analysis
According to the detection kit of apoptosis (Annexin V-FITC Apoptosis Detection Kit, Beyotime Biotechnology, China), Annexin V-FITC plus propidium iodide (PI) were used to stain the cells at room temperature for 30 min, protecting from light. The stained cells were then placed and examined by the FACScan flow cytometry with CellQuest software (BD Biosciences, USA).
Microglial phagocytosis assay
The latex beads were pre-incubated in fetal bovine serum for 1 h at 37°C. The final concentration of beads and FBS was 0.01% (v/v) and 0.05% (v/v) in DMEM, respectively. After cells treatments as indicated, the cells were incubated with DMEM containing beads at 37°C for 1 h. Subsequently, the cells were fixed in 4% paraformaldehyde for 20 min. ActinRed (1:200) was employed to obtain the cell number. The cells activation was indicated with phagocytic cells/total cells. The efficiency of phagocytosis is calculated based on the weighted average of the phagocytic beads for each cell: phagocytosis efficiency (%) = (1×X1+ 2×X2+ 3×X3+ 4×X4+ 5×X5+ 6×X6)/(total number of cells)×100%, where Xn represents the number of cells containing n beads.
ATP measurement
The cells were excised and lysed with Tris-phenol. The ATP content was measured by luciferase assay according to manufacturer’s instructions (ENLITEN® ATP Assay System, FF2000, Promega, USA).
Cell respiration analysis
According to the manufacturer’s instructions, mitochondrial respiration was measured using the Seahorse XF24 extracellular flux analyzer (Seahorse Bioscience, North Billerica, MA, USA). In brief, cells were seeded onto an XF24 microplate. The cellular oxygen consumption rate (OCR) was assessed in unbuffered assay medium (Sigma D5030) with 2 mM GlutaMAX (Gibco), 2.5 mM sodium pyruvate, and 25 mM glucose (pH 7.4 at 37°C), following the sequential addition of 1μM oligomycin, 500 nM carbonyl cyanide 4-(trifluoromethoxy) phenylhydrazone (FCCP), and 1μM rotenone and 1μM antimycin A (AA).
Mass spectrometry for metabolites
For target metabolite measurements, cells were rapidly washed three times with ice-cold PBS and metabolites were extracted by addition of pre-cold 80% methanol. After freeze-thaw and vortex, extracts were pelleted by centrifugation at 16,000×g (4°C) for 15 min. Pellets were used for protein quantitation using BCA Protein Assay (Thermo Scientific), and the supernatants were transferred to a new tube to be dried by a rotary evaporator. Metabolites were re-dissolved in 100μl of ultrapure water (18.4 MΩ) with 5% 100 mM ammonium acetate (NH4Ac) and 0.1% folic acid (A), vortex and centrifuged at 16,000×g (4°C) for 15 min, and the supernatant was used for the metabolomics analysis. Targeted metabolite detection was performed with liquid chromatography-tandem mass spectrometry (LC-MS/MS) approach on Waters I-Class-Xevo TQ-S micro UPLC-MS/MS system (Waters). ACQUITY HSS T3 column (2.1×50 mm, 1.8μm) was used for the separation of the metabolites. The mobile phases employed were water (A) and acetonitrile (B), both containing 5% 100 mM NH4Ac, 0.1% formic acid. The gradient program was as follows: 0–6 min, 100%–80% A; 6–8 min, 80%–0% A; 8–8.1 min, 0%–100% A. The temperature of column was maintained at 25°C and the autosampler was at 4°C. The flow rate was 0.4 ml/min, and injection volume was 2μl. Sample analysis was performed by the multiple reaction monitor (MRM) mode under the positive/negative mode separately. The MRM data were acquired using Masslynx software (Waters).
Mitochondria isolation
Mitochondria isolation was performed as described previously [22]. Cells were corrected and washed with ice-cold isolation buffer (210 mM mannitol, 70 mM sucrose, 5 mM HEPES, 1 mM EGTA, 1 mg/ml BSA, pH 7.4), minced, and homogenized. After the homogenate was centrifuged at 4°C for 10 min at 700×g, the supernatant was collected and further centrifuged at 4°C for 10 min at 12,000×g. The pellet was resuspended for functional assessment. The protein concentration of the mitochondrial preparation was measured with a nanodroplet microvolume spectrophotometer.
Respiration analysis of mitochondria
Mitochondrial respiration was evaluated by measuring oxygen consumption with a Clark-type oxygen electrode (Strathkelvin 782 2-Channel Oxygen System version 1.0; Strathkelvin Instruments, Motherwell, UK). Briefly, isolated mitochondria were re-suspended in respiration buffer (in mM: 225 mannitol, 75 sucrose, 10 KCl, 10 Tris-HCl, 5 KH2PO4, pH 7.2) at 25°C with different substrates. Respiration rates were measured in the absence or presence of 100μM ADP.
Enzymatic assay of mitochondrial complexes
The enzymatic activity of complexes I (Complex I Enzyme Activity Microplate Assay Kit (Colorimetric), ab109721, Abcam, USA) and II (Complex II Enzyme Activity Microplate Assay Kit, ab109908, Abcam, USA) was measured with commercially available kits according to the manufacturer’s instructions, using isolated cardiac mitochondria.
Mitochondrial ROS measurement
The mitochondrial ROS level was determined using an MitoSOX™ Red mitochondrial superoxide indicator (Thermo Fisher Scientific, Invitrogen). In brief, cells were incubated with 5μM mitoSOX™ red reagent working solution in a dark condition at 37°C for 30 min according to manufacturer’s procedure. After washing cells for 3 times with warm buffer. Then, ROS signaling was imaged by a fluorescence microscope (Zeiss LSM 710) and the fluorescence intensity was quantified using ImageJ software.
Mitochondrial membrane potential measurement
TMRM (50 nM) was loaded at 37°C for 10 min followed by 3 washes and the fluorescence was measured by an inverted confocal microscope (Zeiss LSM 710) and the fluorescence intensity was quantified using ImageJ software.
Immunoblotting
Cells were lysed in lysis buffer on ice and the lysate buffer (30 mM HEPES, 100 mM NaCl, 0.5% Nonidet P (NP)-40, protease inhibitors mixture, pH7.6) were centrifuged at 12,500 rpm for at least 15 min. Protein samples were resolved by SDS-PAGE, and then transferred onto PVDFs and detected with indicated antibodies. Blots were visualized using an Odyssey imaging system (LI-COR). The antibodies for Pgc1α (ProteinTech, 66369-1-Ig, dilution 1:1000), Pparγ (ProteinTech, 16643-1-AP, dilution 1:1000), and β-actin (ProteinTech, 66009-1-Ig, dilution 1:2000) were from ProteinTech.
Real-time qPCR
Total RNA was isolated from cells or tissues with TRIzol reagent (Invitrogen), and then converted to cDNA using TransScript One-Step gDNA Removal and cDNA Synthesis Mix (Transgen Biotech). Quantitative PCR experiments were executed by TB Green® Premix Ex Taq™ II: including 30 s pre-incubation at 95°C, 40 denaturation cycles at 95°C for 5 s, annealing 30 s at 60°C. The data were calculated via 2-ΔΔCt method. The primers used were as follows:
Statistical analysis
Statistical data are presented as mean±SEM. Unless otherwise noted, significance was calculated by Student’s t-test. NS, no statistical significance; *p < 0.05; **p < 0.01; ***p < 0.001. *p < 0.05 was considered statistically significant.
RESULTS
Honokiol alleviated Aβ42-induced BV2 neurotoxicity
We used MTT chemiluminescence to measure cell viability when the BV2 cells were exposed to different doses of Aβ oligomers (AβOs). Low doses of AβOs (1–5μM) have no influence on cell viability. However, the cell viability decreased to 74.7% and 46.4% when treated cells with 10μM and 20μM AβOs, respectively (Fig. 1B). We next detected the effect of honokiol on cell viability, honokiol within 20μM had no effect on cell viability (Fig. 1C). To assess whether honokiol improves cell viability following AβOs stimulation, we added 5μM to 10μM AβOs-treated BV2 cells for 24 h, the cell viability increased to 88.9% from 75.5% (Fig. 1D). We further verified the protective roles of honokiol in cell viability. Apoptosis analysis indicated that AβOs treatment increased the apoptosis rate by 2.5 times. However, after incubation with 5μM honokiol for 24 h, the average apoptosis rate was 29.7% lower than that in the AβOs group (Fig. 1E). Together, these results suggest that honokiol treatment could alleviate Aβ42-induced BV2 neurotoxicity.
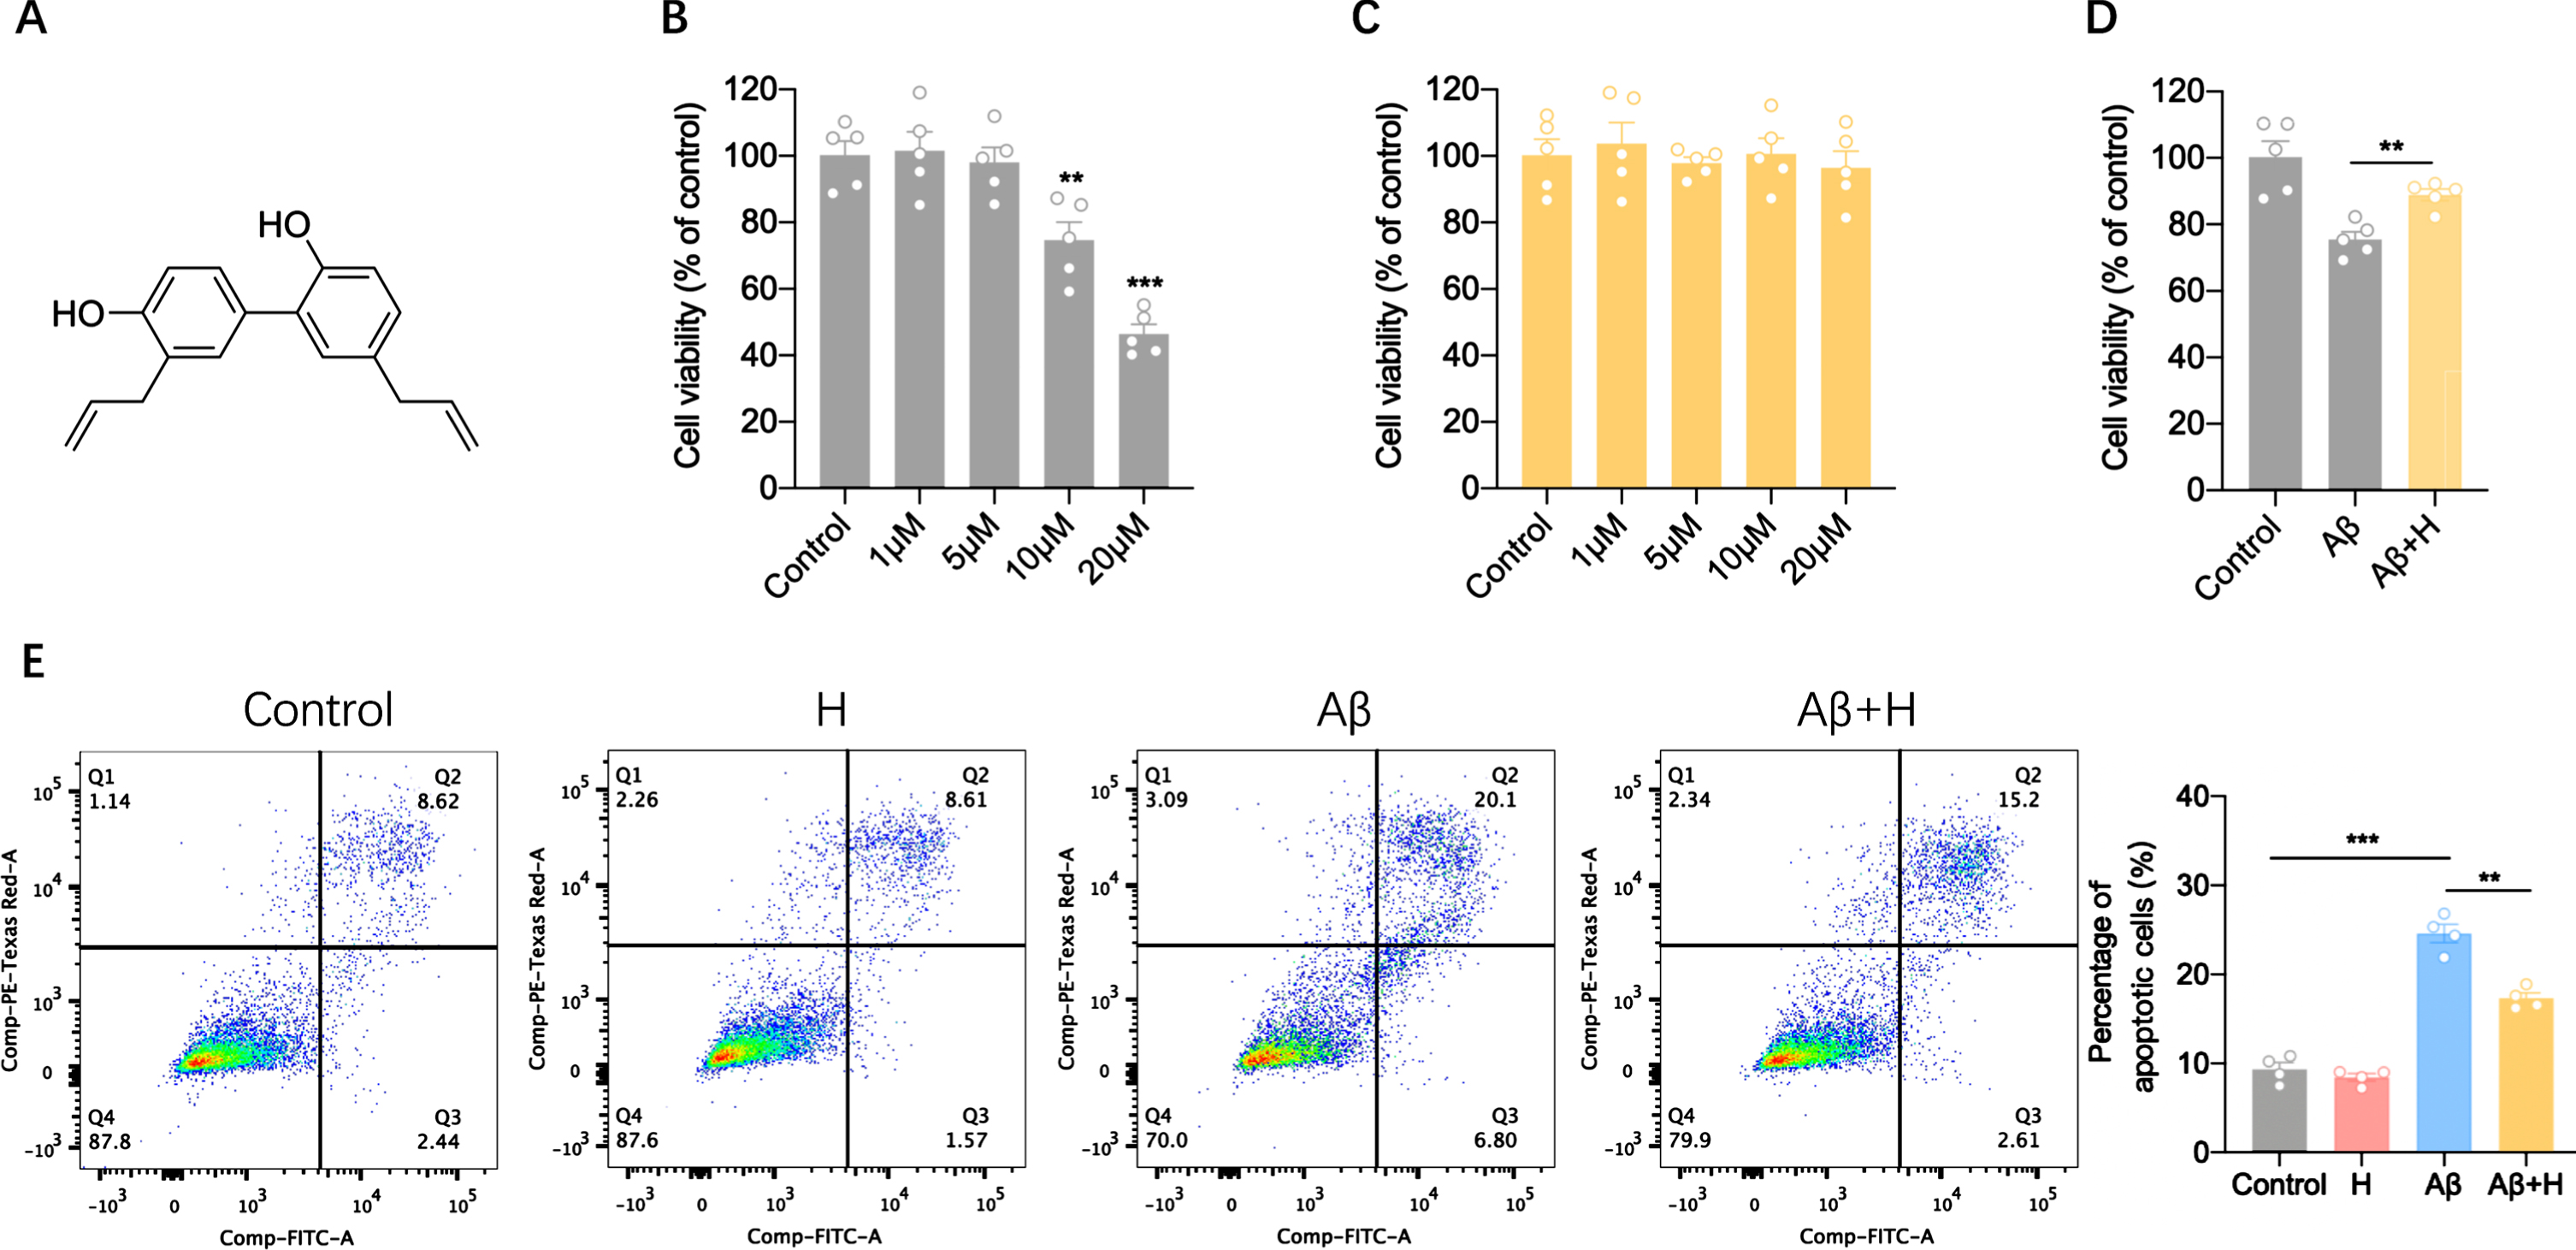
Honokiol promotes cell viability of BV2 cells. A) Chemical structure of honokiol. B) Cell viability of BV2 cells analyzed by MTT assays subjected to Aβ42 oligomers stimulation for 24 h. C) Cell viability of BV2 analyzed by MTT assays subjected to honokiol treatment for 24 h. D) Cell viability of BV2 analyzed by MTT assays subjected to honokiol treatment with or without 10μM Aβ42 oligomers stimulation for 24 h. E) Apoptosis of BV2 analyzed by flow cytometry subjected to honokiol treatment with or without 10μM Aβ42 oligomers stimulation for 24 h. Data represent the mean±SEM (n = 4-5 independent experiments). **p < 0.01, ***p < 0.001.
Honokiol promoted phagocytic efficiency of BV2 cells
We next sought to determine whether honokiol has effect on microglial phagocytosis. AβOs-treated BV2 cells exhibited an overall reduction in phagocytic capacity, represented by the decrease in the total number of cells with phagocytosed FITC beads (Fig. 2A-C). The treatment of honokiol restored the deficient phagocytic capacity of AβOs-treated microglia (Fig. 2A-C). Therefore, these results suggest the ability of honokiol to attenuate the microglial dysfunction caused by AβOs.

Honokiol promotes phagocytic efficiency of BV2 cells. A) Representative immunofluorescence images of latex beads phagocytosed by ActinRed-marked BV2 cells. Scale bar: 20μm. B) Quantitative analysis of the percentage of phagocytic BV2 cells treated with Aβ and/or honokiol. C) Quantitative analysis of the phagocytic efficiency of BV2 cells based on a weighted average of ingested beads per cell. Data represent the mean±SEM (n = 12 dishes from 3 independent experiments). **p < 0.01, ***p < 0.001.
Honokiol enhanced ATP production by promoting mitochondrial OXPHOS in BV2 cells
Given that the status of immune cells is reflected in their cellular metabolism, which made us ask whether honokiol regulates energetic metabolism of microglia. We first detected ATP content in different groups and found that the ATP content reduced in microglia with AβOs treatment (Fig. 3A). However, honokiol treatment increased the production of ATP (Fig. 3A), suggesting that honokiol could elevate energetic metabolism in microglia. Then, we monitored the metabolic status of microglia when treated with AβOs and honokiol. Surprisingly, treatment with honokiol reduced the AβOs-induced high levels of glycolysis intermediates, including glucose-6-P, fructose-6-P, fructose-1,6-dP, glyceraldehyde-3-P, 3-phosphoglyceric acid, phosphoenolpyruvate, pyruvic acid, and lactic acid (Fig. 3B), indicating a shift toward glycolytic metabolism. The increase in microglial glycolysis induced by AβOs was further confirmed by measuring the extracellular acidification rate (ECAR), the glycolysis and glycolytic capacity increased in microglia after exposure to AβOs (Fig. 3C, D). However, honokiol inhibited the increased glycolysis induced by AβOs (Fig. 3C, D). Mitochondrial oxidative respiration was measured by Seahorse extracellular flux assay. We found basal and maximal OCR was significantly decreased by AβOs treatment and recovered by honokiol treatment (Fig. 3E, F). Together, the above data indicate that the metabolism of microglia is shifted from OXPHOS to glycolysis during AβOs treatment and honokiol increased microglial energetic metabolism by enhancing mitochondrial OXPHOS.
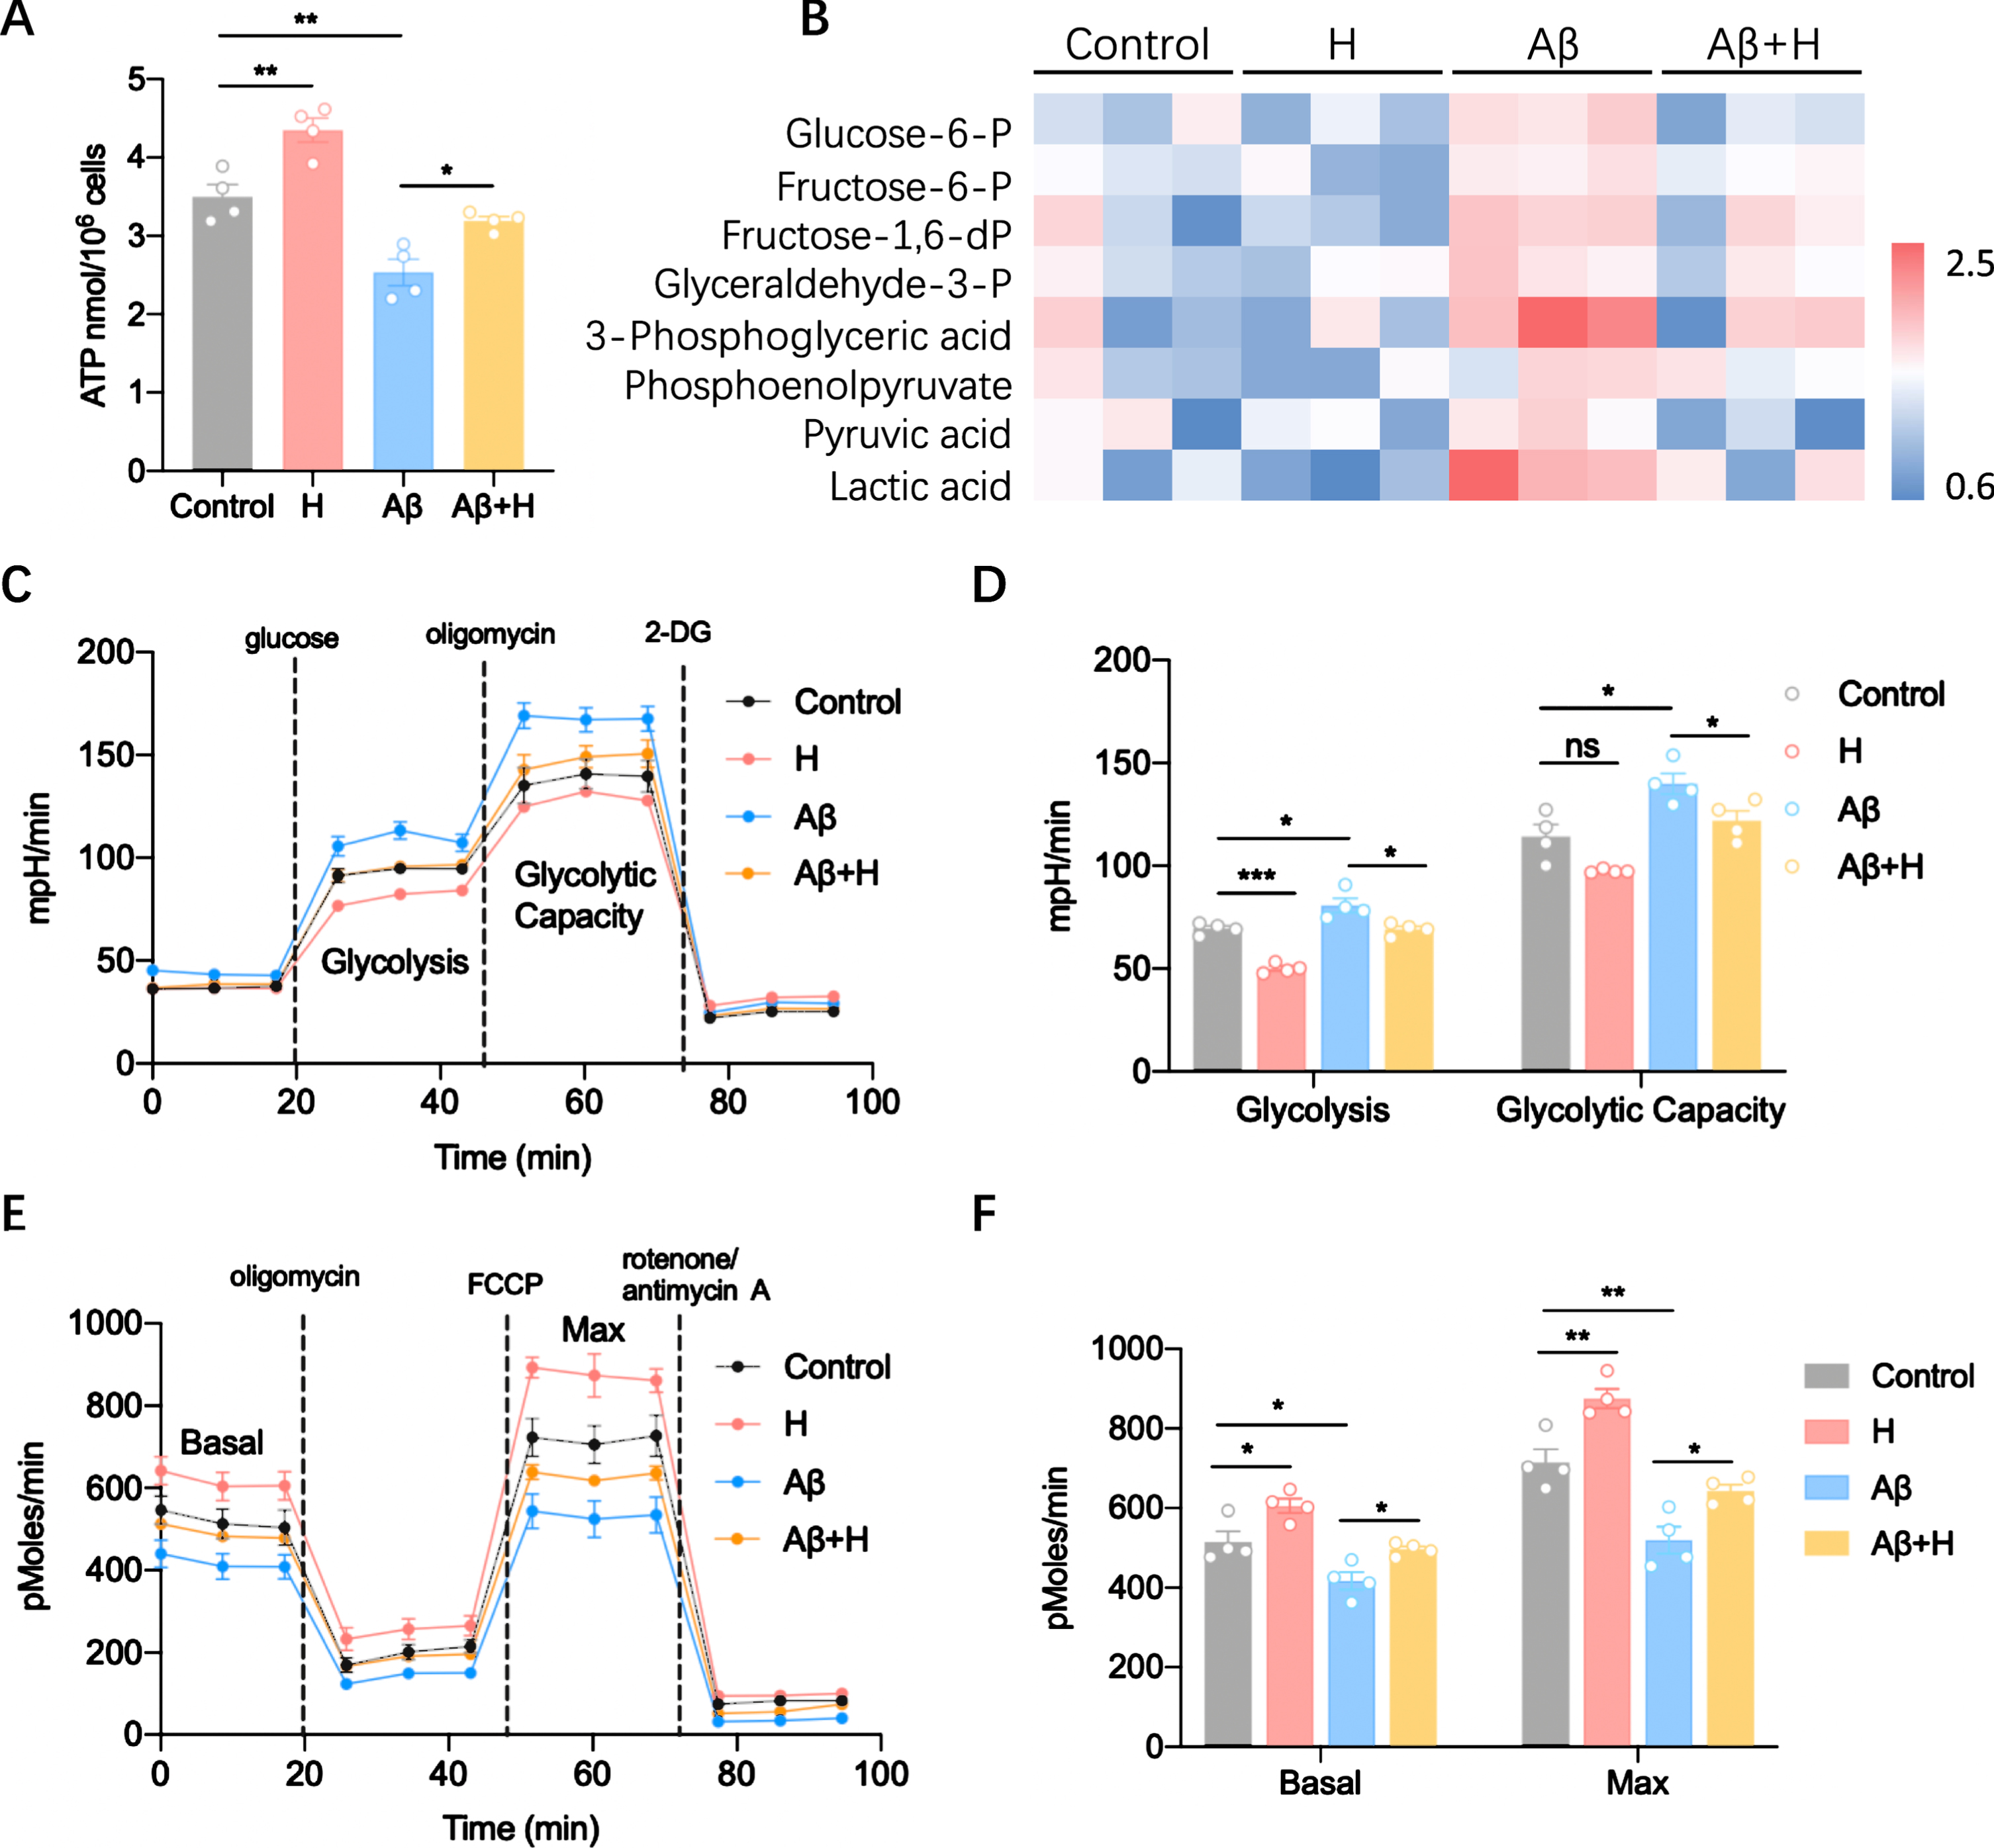
Honokiol reverses Aβ-induced energy defect and metabolic reprogramming. A) ATP content of BV2 cells treated with Aβ and/or honokiol. B) Glycolysis metabolites determined by MS analysis. C) Glycolysis determined by measuring extracellular acidification rate (ECAR) with Seahorse. Glucose (10 mM), Oligomycin (1μM), 2-DG (100 mM each). D) Statistics of glycolysis and glycolytic rate in (C). E) Whole-cell oxygen consumption rate (OCR) measured with Seahorse using glucose/pyruvate as the substrate. Oligomycin (1μM), FCCP (0.5μM), rotenone/antimycin A (1μM each). F) Statistics of basal and maximal OCR in (E). Data represent the mean±SEM (n = 3–4 independent experiments). *p < 0.05, **p < 0.01; ns, non-significant.
Honokiol improves mitochondrial function
To further identify the impact of honokiol on mitochondrial function, we measured the respiratory activity of isolated mitochondria of BV2 cells. In the presence of complex I, but not complex II substrates, the OCR mitochondria was significantly decreased in AβOs group (Fig. 4A, C). However, honokiol increased the OCR when supplied complex I but not complex II substrates (Fig. 4A, C). Consistent with OCR, complex I activity was decreased in AβOs group. Accordingly, honokiol restored the activity of complex I (Fig. 4B, D). We next tested the effects of honokiol on mitochondrial membrane potential (mΔφ). We found that mΔφ was 55.2% lower in the AβOs group as compared with that in the control group (Fig. 4E). However, honokiol treatment increased the mΔφ (Fig. 4E). Then, we tested the impact of honokiol on mitochondrial ROS production. We found mitochondrial ROS production increased 2.2 times in AβOs group compared with control (Fig. 4F), honokiol treatment reduced the increase in the production of ROS caused AβOs (Fig. 4F). Taken together, honokiol protects BV2 cells from AβOs-induced mitochondrial dysfunction.
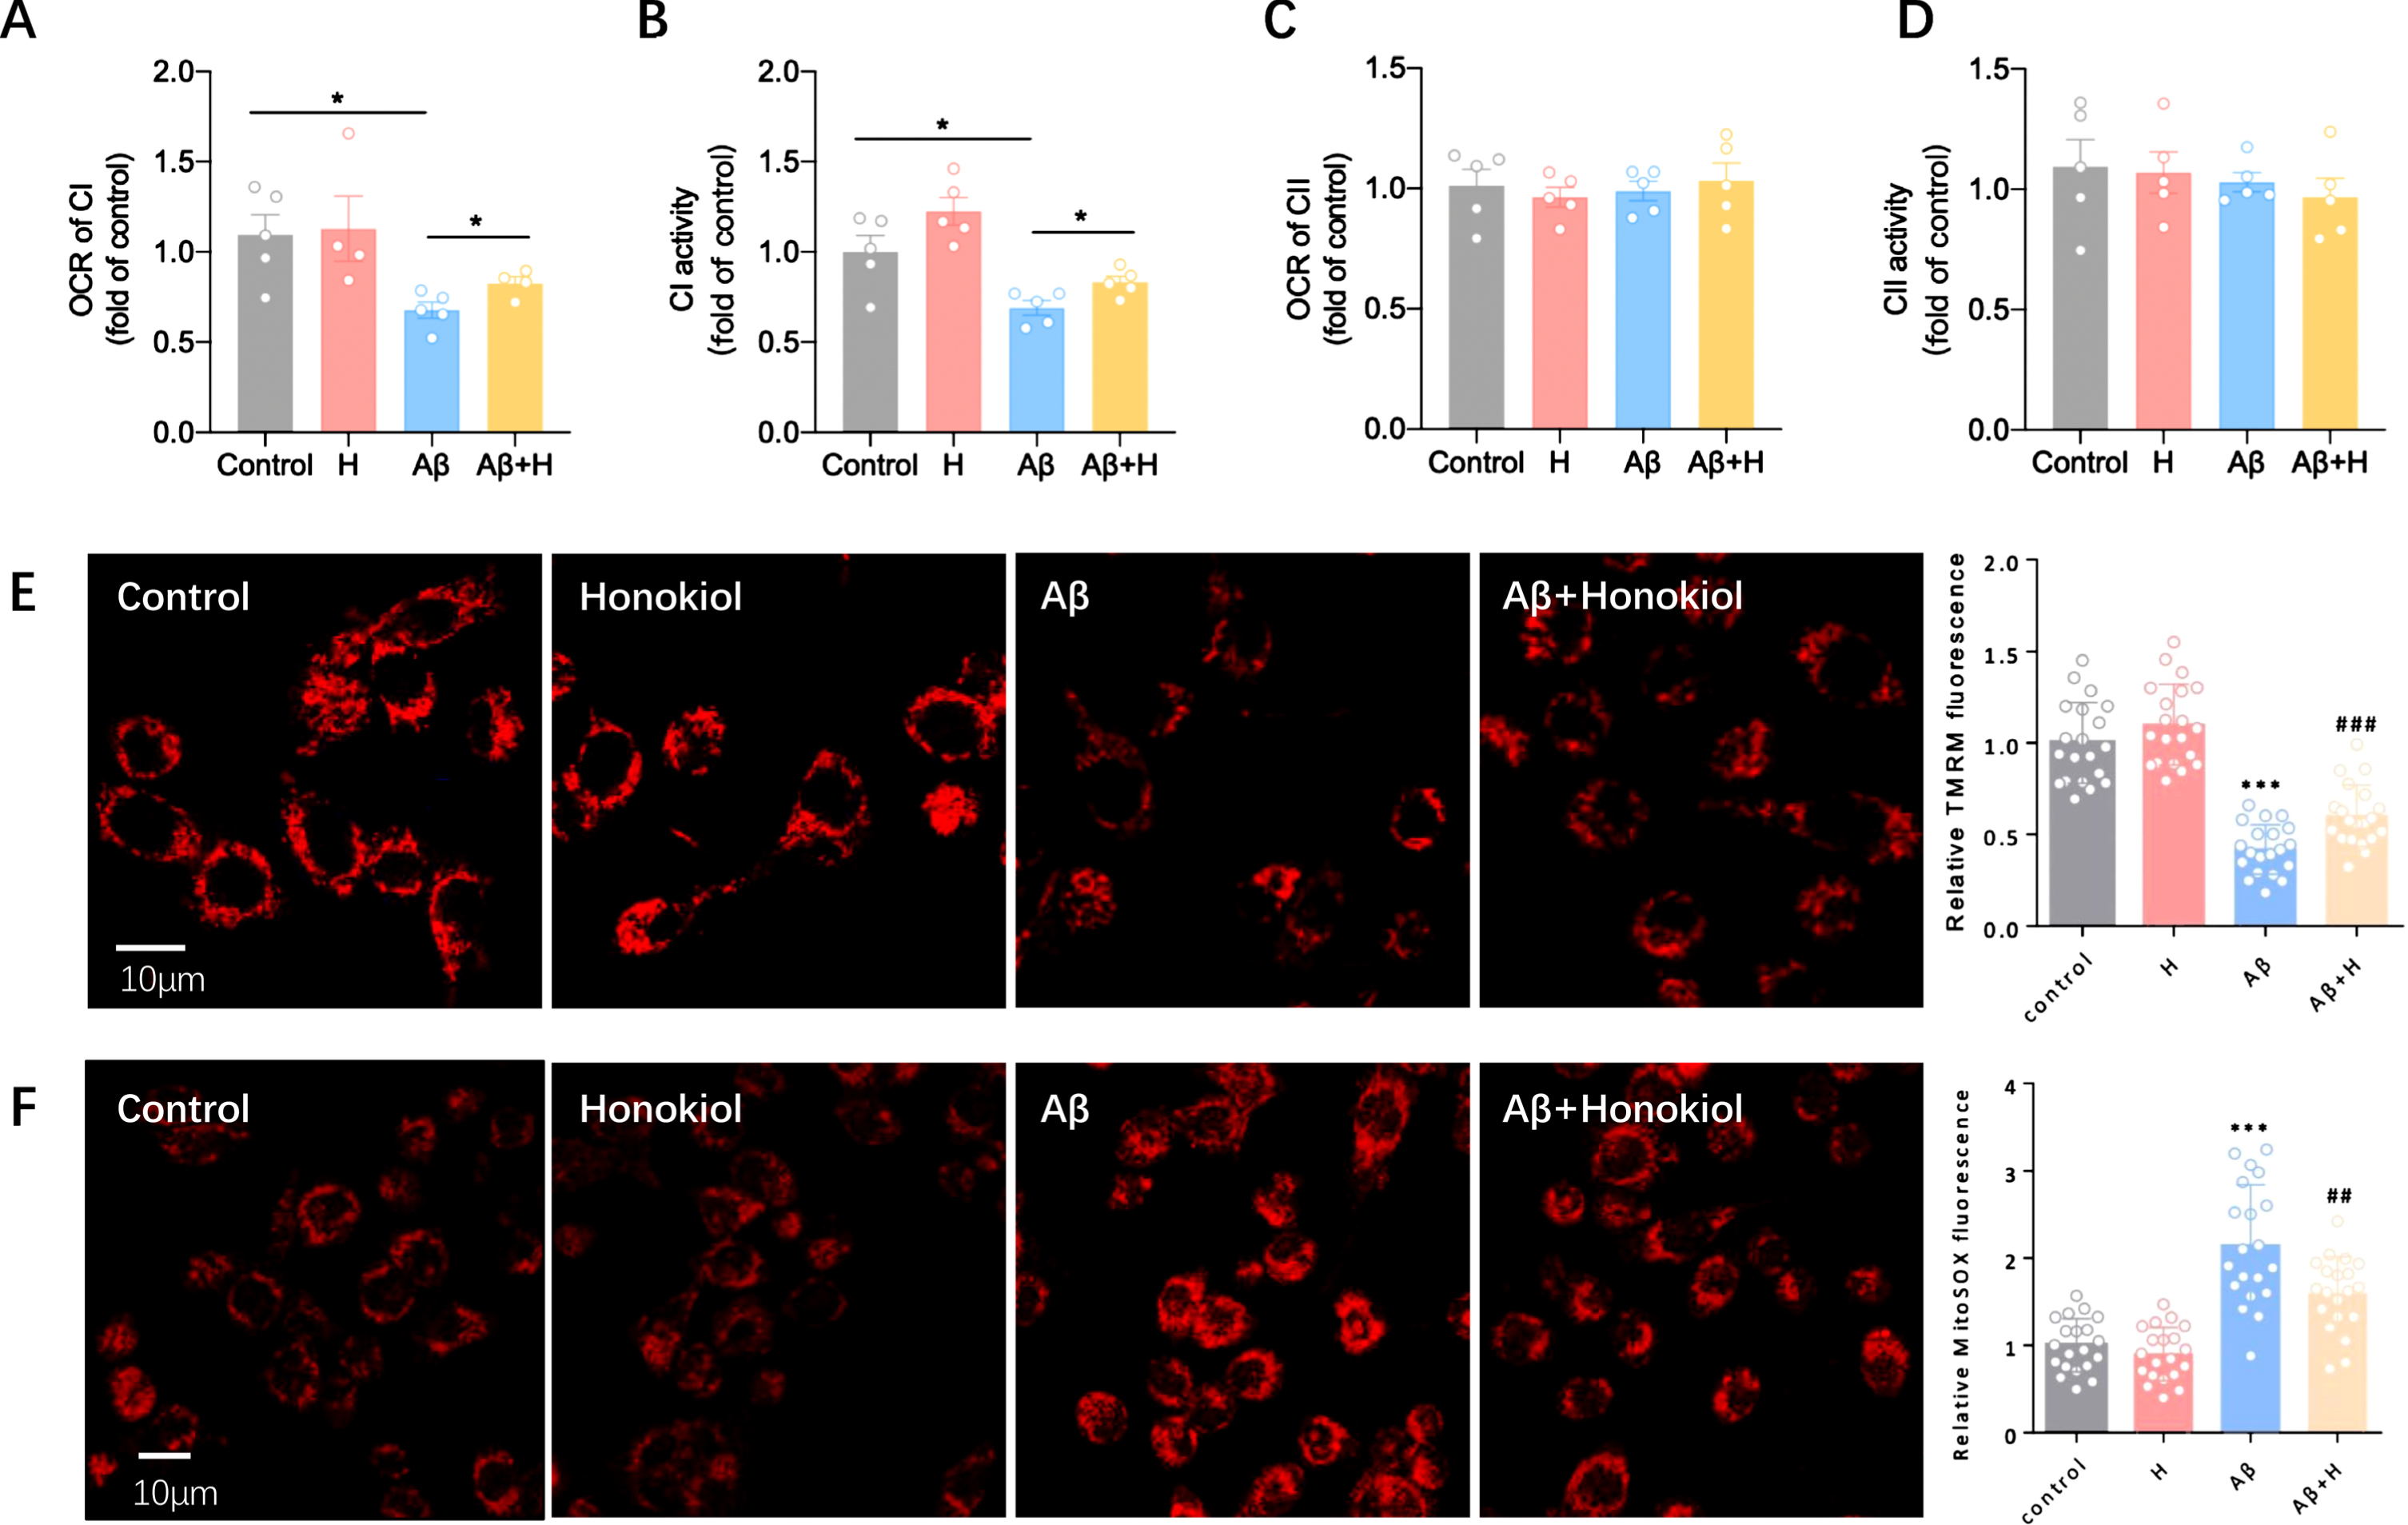
Honokiol improves mitochondrial function. A) Effect of honokiol on state III OCR in isolated mitochondria of BV2 cells. 50μg mitochondria were used for each measurement. Complex II substrates: succinate (Succ, 5 mM) and ADP (100μM). B) Effect of honokiol on the activity of mitochondrial complex I in isolated mitochondria of BV2 cells. C) Effect of honokiol on state III OCR in isolated mitochondria of BV2 cells. 50μg mitochondria were used for each measurement. Complex I substrates: malate/glutamate (Mala/glu, 5 mM) and ADP (100μM). D) Effect of honokiol on the activity of mitochondrial complex II in isolated mitochondria of BV2 cells. E) Increased mΔφ in honokiol-treated cells. The FCCP-sensitive TMRM fluorescence was normalized to that of control. F) Decreased mitochondrial ROS level honokiol-treated cells. The mitoSOX fluorescence was normalized to control. Data represent the mean±SEM (n = 5 independent experiments). *p < 0.05, **p < 0.01, ***p < 0.001.
Honokiol restored mitochondrial function though upregulation of the PGC1α and PPARγ
The peroxisome proliferator-activated receptors (PPARs) are a subfamily of nuclear receptors that regulate gene expression programs of metabolic pathways [23]. Specifically, the PPARγ subtype is the most widely studied and has sufficient evidence to coordinate lipid, glucose, and energy metabolism [24]. We assessed the role of PPARγ and its coactivator PGC1α in the protective effect of honokiol on mitochondria. We found the mRNA levels of PPARγ and PGC1α were decreased in AβOs groups. However, honokiol increased the expression of PPARγ and PGC1α in mRNA levels (Fig. 5A, B). Accordingly, western blotting analysis confirmed these findings in protein level (Fig. 5C, D). Furthermore, we overexpressed PPARγ in BV2 cells (Fig. 5A) and found it could enhance ATP production (Fig. 5F) and the activity of mitochondrial complex I (Fig. 5G) in the presence of Aβ stimulation. Therefore, we argue that honokiol increases the expression of PPARγ and PGC1α, thus regulating a metabolic switch from glycolysis to OXPHOS through an efficient metabolic way for microglial phagocytosis.
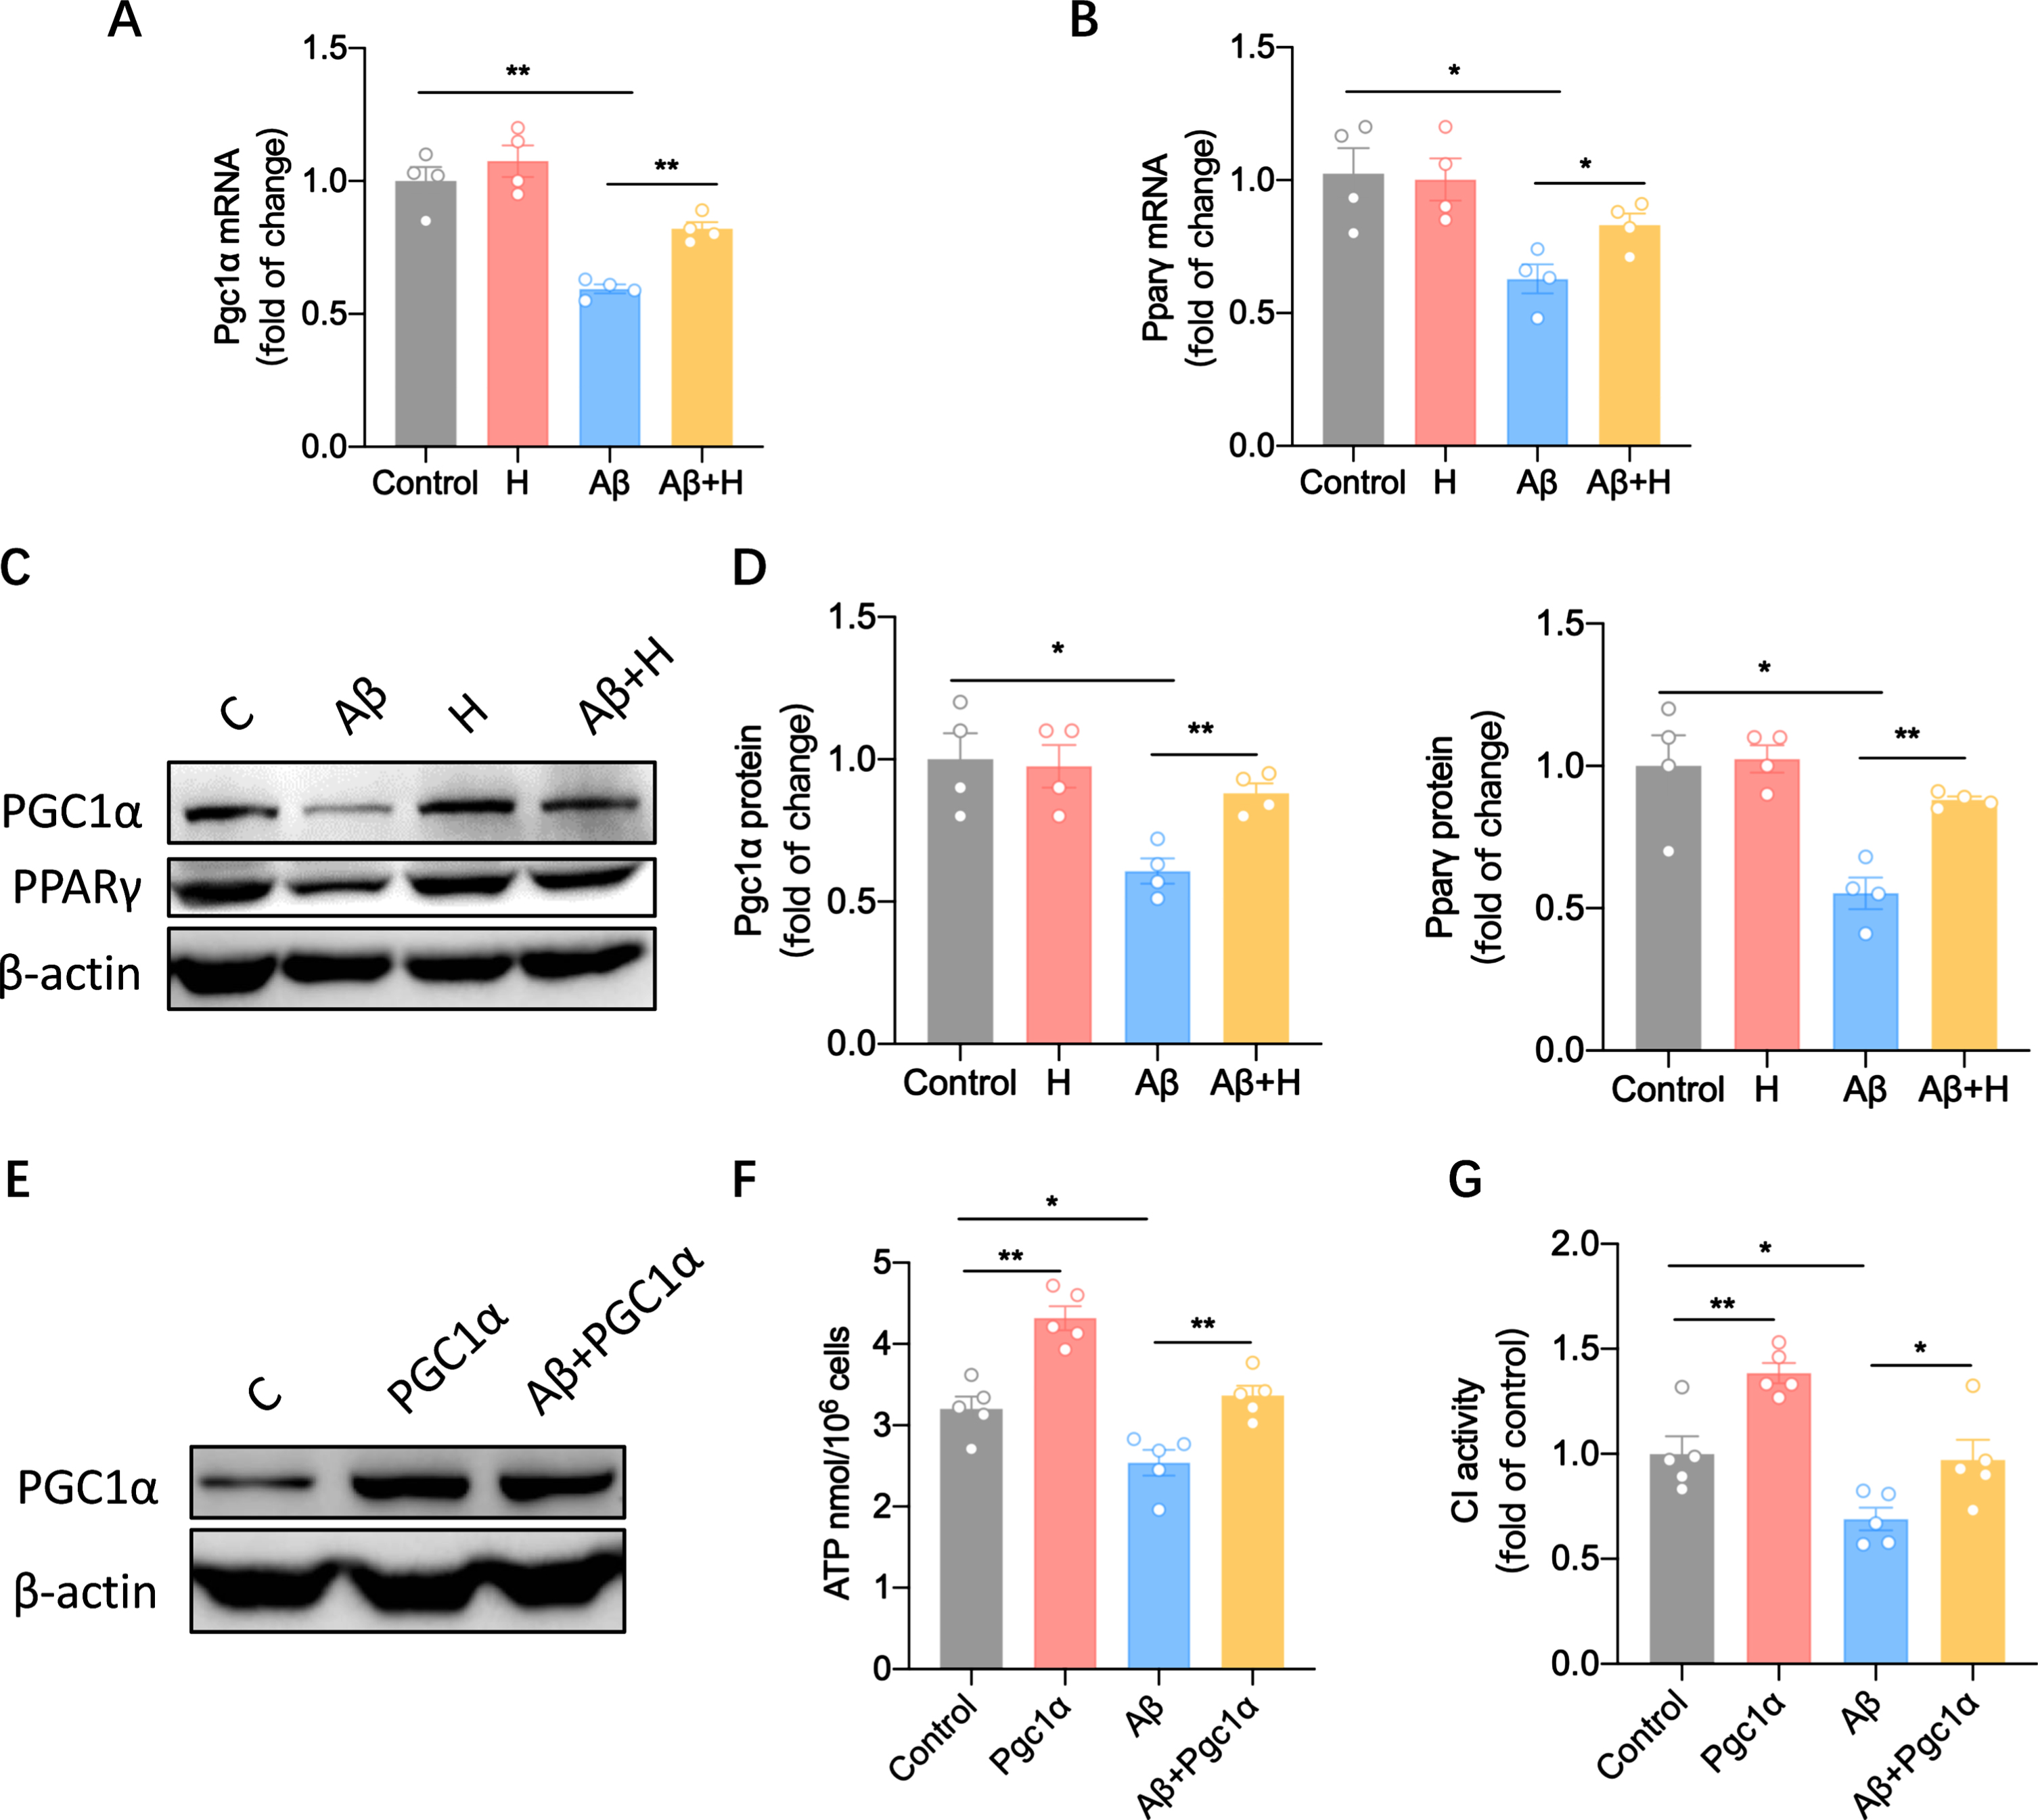
Honokiol restores mitochondrial function though upregulation of the Pgc1α and Pparγ. A) Real time qPCR and analysis of Pgc1α after treatment with 10μM Aβ42 oligomers alone or with honokiol for 24 h. B) Real time qPCR and analysis of Pparγ after treatment with 10μM Aβ42 oligomers alone or with honokiol for 24 h. C) Western blots of PGC1α and PPARγ after treatment with 10μM Aβ42 oligomers alone or with honokiol for 24 h. D) Statistics of (C). E) Western blots of PPARγ after transfection of the Pparγ plasmid alone or with 10μM Aβ42 oligomers treatment. F) ATP content after transfection of the Pparγ plasmid alone or with 10μM Aβ42 oligomers treatment. G) The activity of mitochondrial complex I after transfection of the Pparγ plasmid alone or with 10μM Aβ42 oligomers treatment. Data represent the mean±SEM (n = 4-5 independent experiments). *p < 0.05, **p < 0.01.
DISCUSSION
Microglial phagocytosis dysfunction has been recognized as a causative factor in AD. At present, developing medicines or products capable of restoring microglial function is critically important for AD therapeutic strategy. In this study, honokiol is identified as an effect natural product capable of enhancing mitochondrial function thus promoting microglial phagocytic function. Honokiol promotes the expression of PPARγ and PGC1α and reverses the metabolic switch from mitochondrial OXPHOS to anaerobic glycolysis, which enhances energy metabolism and microglial phagocytosis.
The current clinical drug trials for anti-Aβ have not achieved ideal results [25]. Other non-anti-Aβ therapies are getting more and more attention in the field. Our latest data from genome-wide association studies (GWAS) emphasized the importance of neuroinflammation in the pathogenesis of AD [26]. In addition, studies have shown that mutations in specific genes of microglia are a major risk of sporadic AD [27, 28]. Therefore, therapies that regulate microglia response are manifested in AD treatment. In this work, we found AβOs reduced microglia phagocytic capacity as previous reported [29]. However, honokiol restored the deficient phagocytic capacity of Aβ-treated microglia. Other reports indicated honokiol attenuated neuroinflammation and reduced Aβ deposition in APPswe/PS1dE9 transgenic mice [20]. Our in vitro experiments directly showed that honokiol enhanced microglial phagocytosis, which help to explain the reduction of Aβ deposition in honokiol-treated brain of AD mice [20].
A great amount of energy is required in microglial phagocytosis [31, 32]. In order to rapidly increase the production of ATP, a metabolic switch from mitochondrial OXPHOS to anaerobic glycolysis was described in microglia, especially in cells around Aβ plaques, in AD pathology [13]. However, through anaerobic glycolysis, only two ATP molecules can be obtained per glucose molecule. In addition, the metabolic switch to anaerobic glycolysis is always accompanied by the production of lactate, which are harmful to cells [33]. Recently, a study demonstrated Aβ induced microglial metabolic reprogramming from OXPHOS to aerobic glycolysis and IFN-γ could rescue impaired cellular metabolism of Aβ-tolerant [13], which suggests that modulating microglial metabolism might be a new therapeutic strategy for AD. In this study, we also found that AβOs induced the microglial metabolic switch, and surprisingly found that honokiol can reverse this metabolic switch. We further used metabolomics methods to detect changes in the intermediate metabolites of glycolysis and found that honokiol did significantly reduce the increase in the intermediate metabolites of glycolysis induced by Aβ.
PGC1α plays important roles in many biological process, such as thermogenesis, mitochondrial biogenesis, and energy metabolism [30]. Some studies implied its roles in AD, including downregulation in the brains of AD patients and HFD-induced insulin resistance Tg2576 mice [31–33]. Recent studies in CaMKII-specific PGC1α conditional knockout mice [34] have shown that PGC1α plays an important role in neuronal function, and its forebrain neurons are important for neural circuits that control energy balance. PPARγ, as a coactivator of PGC1α, has been considered as a potential therapeutic target to protect mitochondrial function in neurological diseases [35]. The PPARγ agonist pioglitazone (PIO) has been extensively studied for AD therapy in preclinical and clinical studies [36–38]. Despite substantial engagement of PPARγ agonists in AD clinical trials, the therapeutic effects of PPARγ agonists in the brain are still not fully understood [39]. In our work, we found PPARγ and PGC1α were decreased in AβOs treated cells. Honokiol, as PPARγ agonist, increased the expression of PPARγ and PGC1α in mRNA and protein levels. Our data suggest that honokiol increases the expression of PPARγ and PGC1α to reverse the metabolic switch, thus playing protective role in microglial phagocytosis.
In summary, our studies suggest that the regulation of microglia phagocytosis in AD through the rectification of microglial metabolic disorder using honokiol is a promising therapeutic approach against AD. Ultimately, in vivo studies are needed for a better understanding of honokiol in energy metabolism and microglial phagocytosis. Furthermore, these findings reveal that modulation of microglial bioenergetic pathways may represent a promising therapeutic strategy for AD.
Footnotes
ACKNOWLEDGMENTS
This study was supported by the Key Project of the National Natural Science Foundation of China (81530036); the National Key Scientific Instrument and Equipment Development Project (31627803); the Key Project of the National Natural Science Foundation of China (U20A20354); Beijing Scholars Program; Beijing Brain Initiative from Beijing Municipal Science & Technology Commission (Z201100005520016, Z201100005520017); the National Natural Science Foundation of China (81801048).