
Abstract
Background:
The blood-brain barrier (BBB) is formed by a high-density lining of endothelial cells, providing a border between circulating blood and the brain interstitial fluid. This structure plays a key role in protecting the brain microenvironment by restricting passage of certain molecules and circulating pathogens.
Objective:
To identify associations between brain volumetric changes and a set of 355 BBB-related single nucleotide polymorphisms (SNP).
Method:
In a population of 721 unrelated individuals, linear mixed effect models were used to assess if specific variants were linked to regional rates of atrophy over a 12-year time span. Four brain regions were investigated, including cortical grey matter, cortical white matter, ventricle, and hippocampus. Further, we also investigated the potential impact of history of hypertension, diabetes, and the incidence of stroke on regional brain volume change.
Results:
History of hypertension, diabetes, and stroke was not associated with longitudinal brain volume change. However, we identified a series of genetic variants associated with regional brain volume changes. The associations were independent of variation due to the APOEɛ4 allele and were significant post correction for multiple comparisons.
Conclusion:
This study suggests that key genes involved in the regulation of BBB integrity may be associated with longitudinal changes in specific brain regions. The derived polygenic risk scores indicate that these interactions are multigenic. Further research needs to be conducted to investigate how BBB functions maybe compromised by genetic variation.
Keywords
INTRODUCTION
The human brain contains more than 640 km of blood vessels and capillaries, providing an estimated 12 m2 of membrane area to facilitate the transport of substances between the blood and neural tissues [1, 2]. The blood-brain barrier (BBB) precisely controls these exchanges of macromolecules while restricting neurotoxic components and pathogens into the brain. This physical barrier consists of highly specialized endothelial cells, connected by tight junctions and numerous specialized receptor-mediated and carrier-mediated transporters. This structure also plays a key role in maintaining the highly regulated brain microenvironment, necessary for proper synaptic connectivity and neuronal functions [3]. Disruptions of the BBB include impaired transport of key molecule (e.g., glucose, amino acids, vitamins, hormones) and increased permeability of the barrier. The latter allows the influx of neurotoxic molecules and pathogens into the brain, triggering various immune and inflammatory responses which can initiate neurodegenerative processes [2, 4]. BBB breakdown has been shown in a number of neurodegenerative disorders, including Alzheimer’s disease (AD), for which postmortem analyses have demonstrated BBB damages leading to the accumulation blood-derived macromolecules into the brain [5–8]. Although the role and timing of BBB breakdown in neurodegenerative disorders remains unclear, recent studies have shown that BBB breakdown preceded hippocampal atrophy [9], a trait typically observed in early AD [10, 11]. This suggests that BBB breakdown might occur prior to AD-related neurodegeneration and therefore could predict cognitive decline preceding an AD diagnosis.
This study aimed at identifying associations between longitudinal brain volumetric changes and a set of BBB-related single nucleotide polymorphisms (SNP). We curated a list of 54 genes related to BBB and used a linear mixed model approach to investigate if specific variants were associated with accelerated atrophy rates in four brain regions, including grey matter, white matter, hippocampus and ventricle.
METHODS
Sample population
Data from the Australian Imaging, Biomarkers and Lifestyle(AIBL)project, a prospective longitudinal study of ageing, were used. The AIBL study design, enrolment process, neuropsychological assessments, and diagnostic criteria have been previously described [12]. Of the 1,572 participants enrolled into the AIBL study, 1,348 individuals underwent genetic analysis using the methodologies described below. From this population, 730 participants also had longitudinal imagery data available. In this study, we used the intersection between these two datasets,resulting in a cohort of 721 participants. At baseline, participants were classified as mild cognitive impairment [13] or AD [14] when the clinical criteria for diagnosis of were met. In the absence of these diagnoses a classification of cognitively normal was given by a clinical review panel, blinded to amyloid-β status. Ethics approval for the AIBL study and all experimental protocols was provided by the ethics committees of Austin Health, St Vincent’s Health, Hollywood Private Hospital, and Edith Cowan University. All experiments and methods were carried out in accordance with the approved guidelines and regulations and all volunteers gave written informed consent before participating in the study.
Genotyping, gene selection, and quality control procedure
DNA was extracted from 5 mL of whole blood using QIAampDNA Blood Maxi Kits (Qiagen, Hilden, Germany), as per manufacturer’s instructions. TaqMan® genotyping assays (Life Technologies, USA) were carried out on a QuantStudio 12K Flex Real-Time-PCR system (Applied Biosystems, USA), as per manufacturer’s instructions to determine apolipoprotein E (APOE) genotype (rs7412; Assay ID: C 904973_10 and rs429358; Assay ID: C 3084793_20). Genome-wide SNP analysis was performed of 976,713 SNPs on the Omni Express Human Exome + Bead Chip (Illumina, USA), with resulting genetic markers mapped to the human genome reference hg19.
To identify candidate genes related to BBB, we used the National Center for Biotechnology Information (NCBI) database with the following query: ‘(“blood brain barrier”) AND “Homo sapiens” [porgn:txid9606]’. The list of results returned was then manually curated to obtain a final set of 54 genes related to BBB. SNPs located within or near (20kb upstream or downstream) the genes of interest were then selected for analyses.
Genotype data was prepared by removing markers with a call rate below 99% and a minor allele frequency below 5%. In addition, markers not in Hardy-Weinberg equilibrium (p < 10–6) were removed. Samples identified with discordant sex information and samples with a call rate below 95% were discarded. Finally, we pruned genetic markers in approximate linkage equilibrium with each other using a sliding window of 50 markers along the genome. At each step, variance inflation factors were calculated for all pairwise combinations of markers within the current window. All variants with a variance inflation factor exceeding the threshold of 1.5 were removed and the window was shifted forward in steps of 10% of the window size (5 markers). All the quality control procedures were performed with PLINK v2.0 [15]. Our final dataset includes 721 individuals and 355 markers. A principal component analysis was used to ensure the lack of population structure in the dataset.
MRI and PET imaging
Aβ imaging was performed by positron emission tomography (PET) using one of three tracers: 11C–Pittsburgh compound B (PiB), 18F-florbetapir, or 18F-flutemetamol. Resulting Aβ PET scans were then quantified using CapAIBL [16] and Aβ levels were expressed in centiloids (CL) [17, 18]. Amyloid-β status was defined as Aβ negative (Aβ-; < 25 CL) or Aβ positive (Aβ+; ≧ 25).
Participants received an MRI scan using a 3D magnetization prepared rapid gradient echo (MPRAGE). MR images for every participant were classified into grey matter, white matter, and cerebrospinal fluid using an implementation of the expectation maximization segmentation algorithm. Hippocampus and ventricles volumes and were extracted using a multi-atlas approach based on the Harmonized Hippocampus Protocol [19] and the NeuroMorphoMetrics parcelations (http://www.neuromorphometrics.com/) respectively. Volume data were collected longitudinally, every 18 months, over a period of 4.5 years on average (SD = 1.6 years). All volumes were normalized for total intracranial volume, defined as the sum of grey matter, white matter, and cerebrospinal fluid volumes.
Statistical analyses
We first compared demographic variables and potential confounders, including, presence of APOEɛ4 allele, clinical diagnosis, and gender for the relationship between and regional brain volume at baseline by t test or χ2 test as appropriate.
Multivariate longitudinal association
We used linear mixedmodels to investigate the relationship between regional brain volume (y) and SNPs. The final model was constructed by a stepwise variable selection approach (backward selection) and selected on the basis of superior model fit (Akaike information criterion). To minimize the number of parameters, only main effects for confounders (given their lack of association with time), along with the interaction term for time by SNP were kept. The model was defined as follows:
Fixed-effect covariates include age at baseline, gender, APOE ɛ4 status (0 = no ɛ4 allele, 1 =ɛ4 carrier) and MRI scanner ID.
In addition, we added the interaction (SNP×Time) as our term of interest to investigate whether regional rate of atrophy across time differs between common and rare variant carriers. All analyses were performed based on a dominant genetic model to ensure adequate power. Therefore, SNPs were encoded as factors with two possible values, representing the presence or absence of the minor allele. Finally, we added a random effect in order to account for variation between individuals. There is currently a lack of consensus on how to identify a suitable significance threshold for an interaction term in a large-scale association study. To identify an appropriate statistical significance threshold while accounting for multiple comparisons, we divided the number of SNPs by the number of independent linkage disequilibrium blocks identified in our dataset [20]. Using this method, we calculated a significance threshold of 9.26×10⁻⁴. Preliminary to the analyses, a power analysis was performed using the simR package [21] to assess the model’s ability to detect the effect of the interaction term of interest. We used 1000 simulations for each sample size and a significance level of 0.05 (Supplementary Figure 2).
Association with medical conditions
We used likelihood ratio tests to compare a full linear mixed-effect models (M1) including medical conditions as fixed effect, with a reduced model (M0), to assess the potential effect of three conditions (diabetes, hypertension, and incidence of stroke) on longitudinal brain volume (y).
The conditions tested were defined as dichotomous variables (yes/no) describing the if a patient had a history of diabetes, hypertension, or past incidence of stroke.
Polygenic risk scores
To assess the collective effect of variants on the regional rate of atrophy, we derived polygenic risk scores (PRS) for each brain region. To do so, we first selected SNPs having a nominally significant SNP×Time interaction (p < 0.05) for each brain region. For the regions having at least 5 significant SNPs, the PRS was calculated as follows:
Data availability
All data and samples used in this study are derived from the AIBL Study of Ageing [12]. All AIBL data, and that specific to this study, is publicly accessible to all interested parties through an Expression of Interest procedure and is governed by the AIBL Data Use Agreement, for more information please see https://aibl.csiro.au/awd/.
RESULTS
Cohort demographic comparisons
The study was conducted on a cohort of 721 participants enrolled in the AIBL study [12] (395 females, 326 males). Demographic and clinical characteristics of the sample population are shown in Table 1. Approximately 45% of the sample was PET amyloid positive (Aβ+) and 34% carried at least one copy of APOE ɛ4 allele. Comparing demographic characteristics between Aβ status, Aβ+participants were older (75.2 [SD:6.55 versus 72.1 [SD:6.2], p < 0.001) and were more likely to carry at least one copy of the APOE ɛ4 allele (55.8% versus 17.1%, p < 0.0001, Table 1). The frequencies of males and females were relatively similar between the two Aβ groups (p > 0.05). Comparing medical history, there was no significant difference in the number of individuals affected by hypertension, diabetes, and the incidence of stroke between the Aβ+ and Aβ- participants (Table 1).
Population demographics
p values determined by Fisher’s test (categorical variables) and t-test (continuous). N, number; APOE ɛ4, apolipoprotein ɛ4 allele.
Effect of hypertension, diabetes, and the incidence of stroke on longitudinal volume changes
Using likelihood ratio tests, we found that none of the medical condition tested (hypertension, diabetes, and occurrence of stroke) had a significant effect on the brain regional brain volume change. This result was consistent across the four brain areas investigated (Supplementary Table 1).
SNP associated with longitudinal changes in brain
Using linear mixed-effect models, we found nominally significant associations (p < 0.05) between variants and longitudinal volume changes in the four regions of interest (gray matter, n = 18; hippocampus, n = 16; ventricle, n = 19, white matter, n = 12). Figure 1 depicts the associations identified in the four regions analyzed; details of the results are also reported in Table 2. Two variants (ABBC8: rs4148617, TOMM40 rs2075650) remained below the study-wide significance level (p < 9.26×10⁻⁴). The most significant association identified was between rs4148617, a variant located in the intronic region of ABBC8 and longitudinal volume change in the grey matter (β= –0.035, 95% confidence interval (CI) = [–0.054, –0.016], standard error (SE) = 9.5e10–3, p = 2.49×10⁻⁴). Minor allele carriers for rs4148617 exhibited an accelerated atrophy of grey matter during the course of the study compared to major allele carriers. Interestingly, this variant was also strongly associated with accelerated volume changein the hippocampus (β= –0.025, CI = [–0.04, –0.009], SE = 7.8×10⁻³, p = 1.78×10⁻³) and the ventricle (β= 0.017, CI = [2.4e10–4, 0.03], SE = 0.008, p = 0.048). In these three regions, the results were consistent and showed that the mutation in rs4148617 was unfavorable, resulting in accelerated atrophy of grey matter and hippocampus and accelerated enlargement of the ventricle. Restricting the analysis to Aβ positive individuals, the association between rs4148617 and accelerated volume change remained significant in the grey matter (β= –0.046, CI = [–0.077, –0.016], SE = 0.016, p = 3.94×10⁻³) and hippocampus (β= –0.036, CI = [–0.062, –0.011], SE = 0.013, p = 6.3x 10⁻³). Moreover, we noticed that the effect of rs4148617 was further increased in the Aβ positive sub-population, with minor allele carriers experiencing even greater rates of atrophy compared to the rest of the population (Supplementary Figure 1).
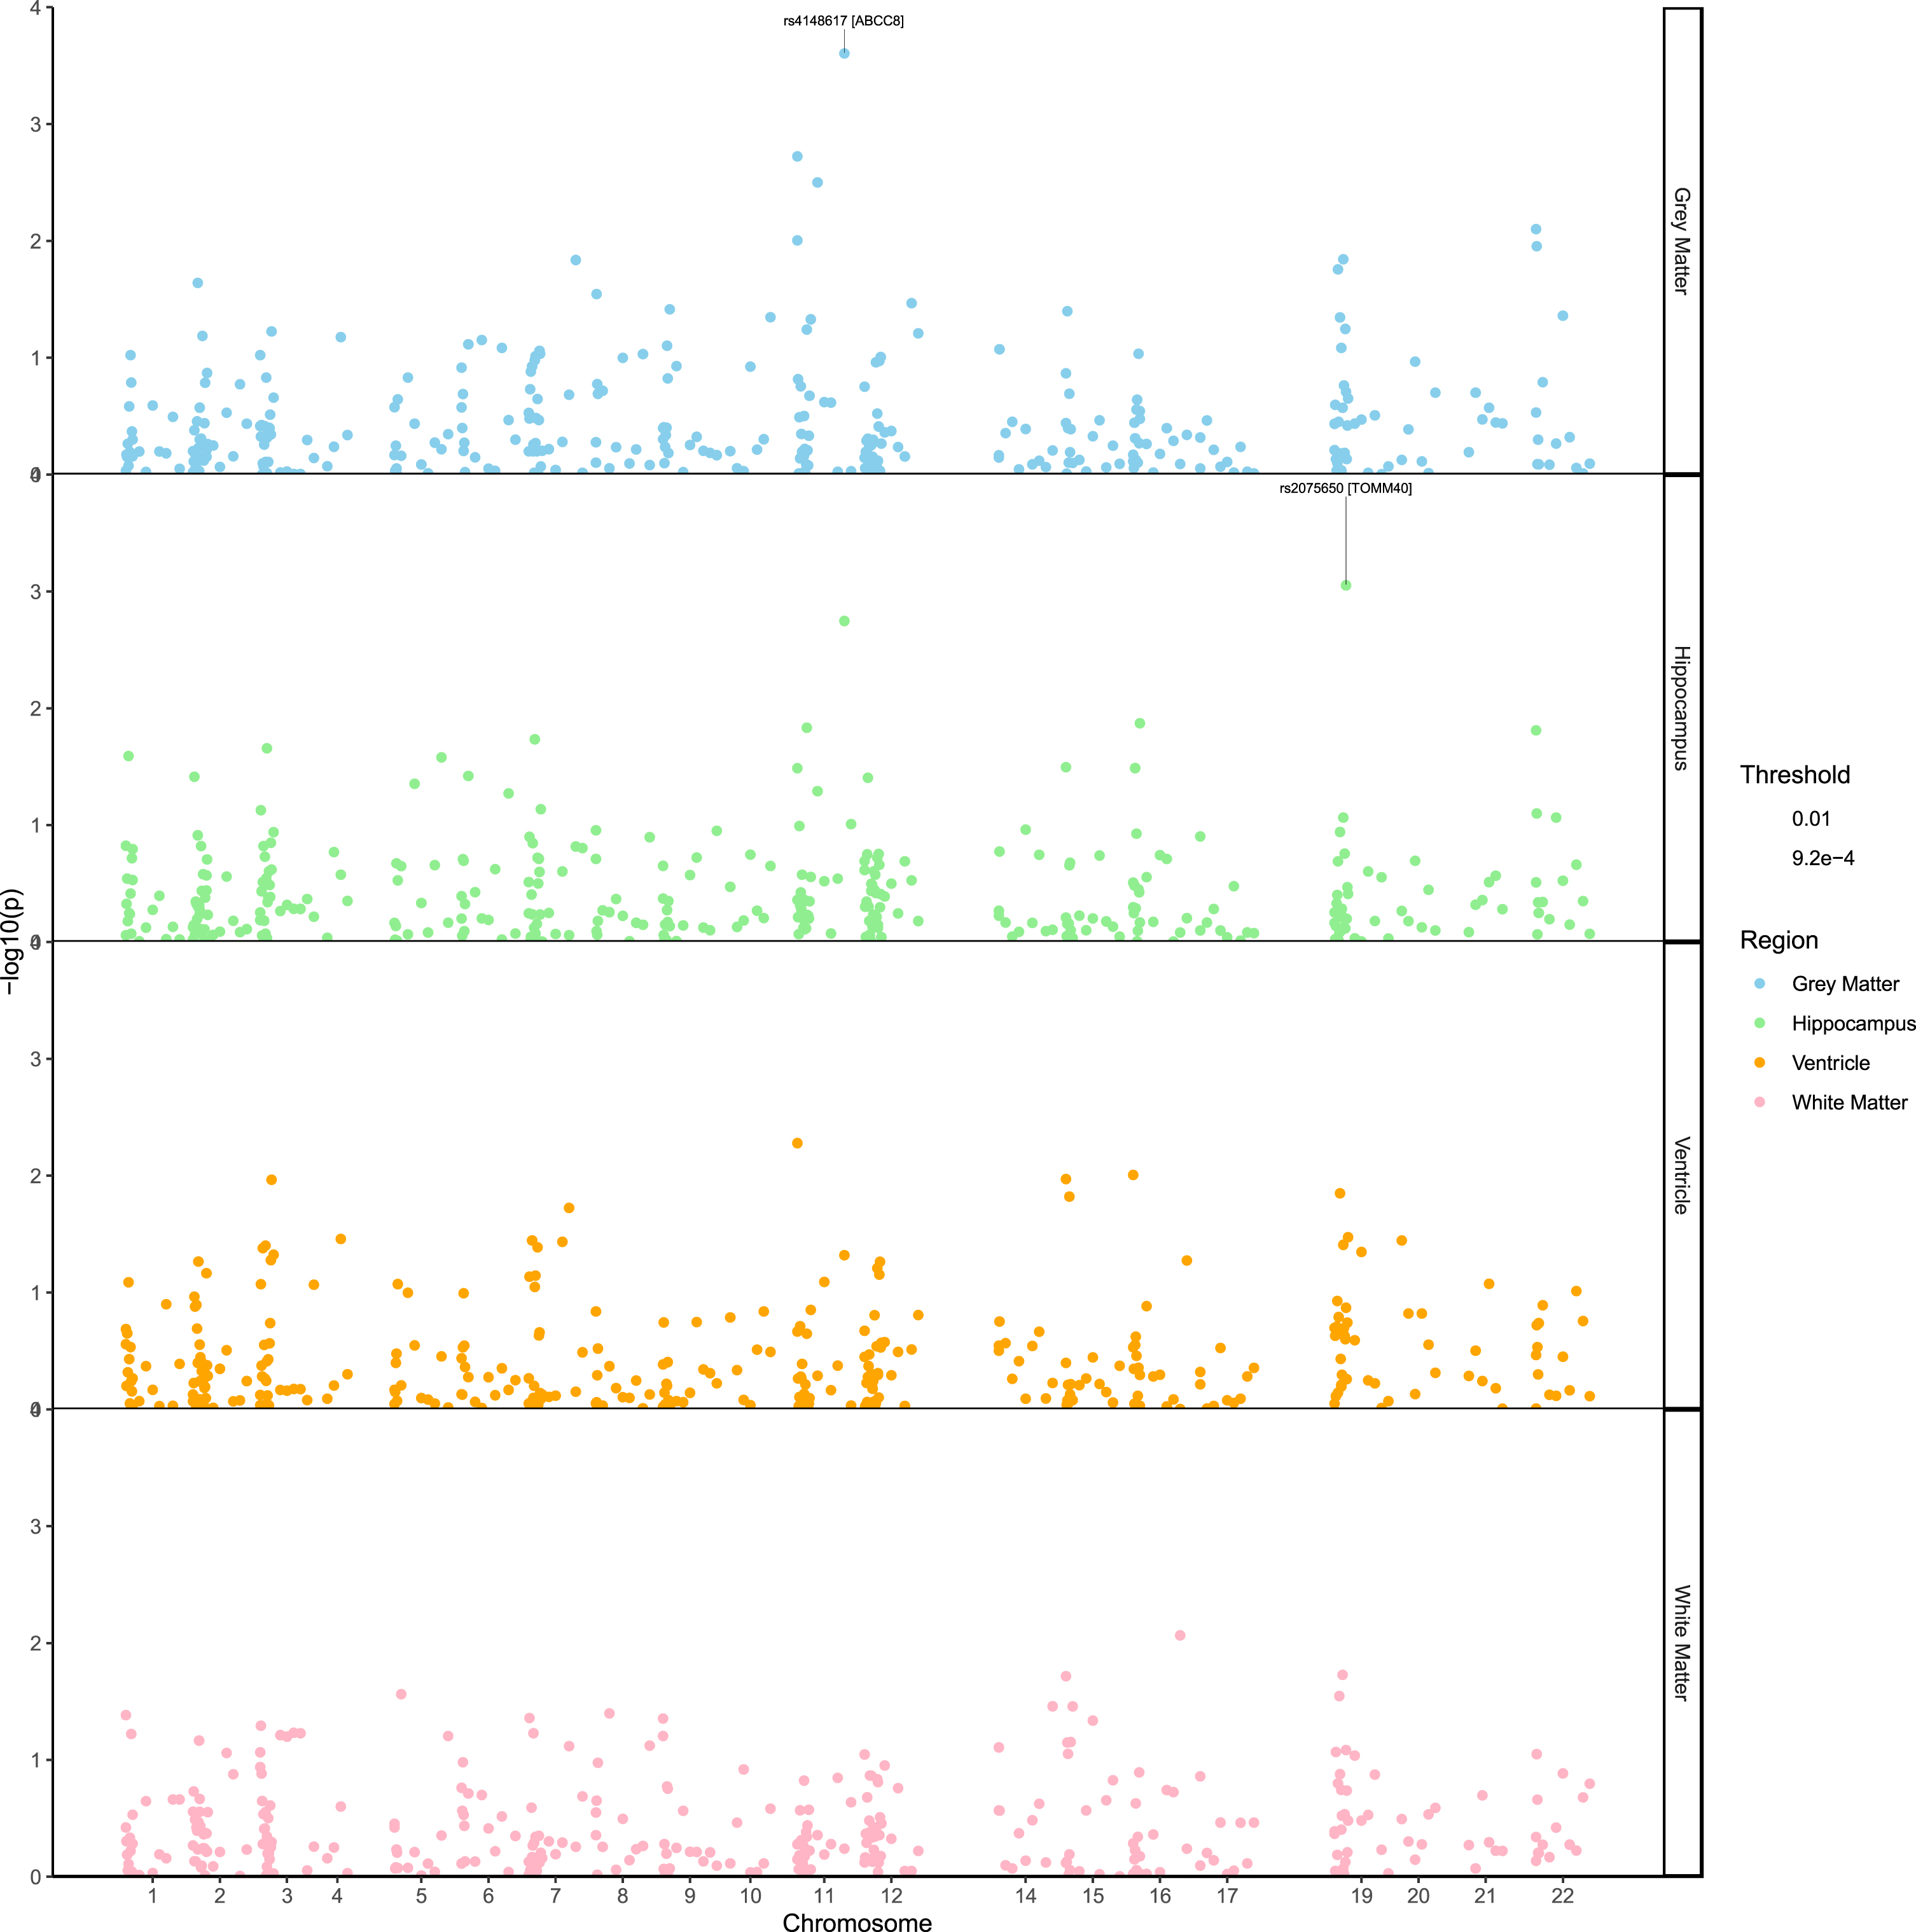
Manhattan plot showing the SNP associations with the rate of atrophy of four regions of interest. The pvalues (–log10) are plotted against the SNPs relative positions on each chromosome. To improve the visibility of the figure, positions correspond tothe order in which the markers are located on the chromosomes instead of their physical location.
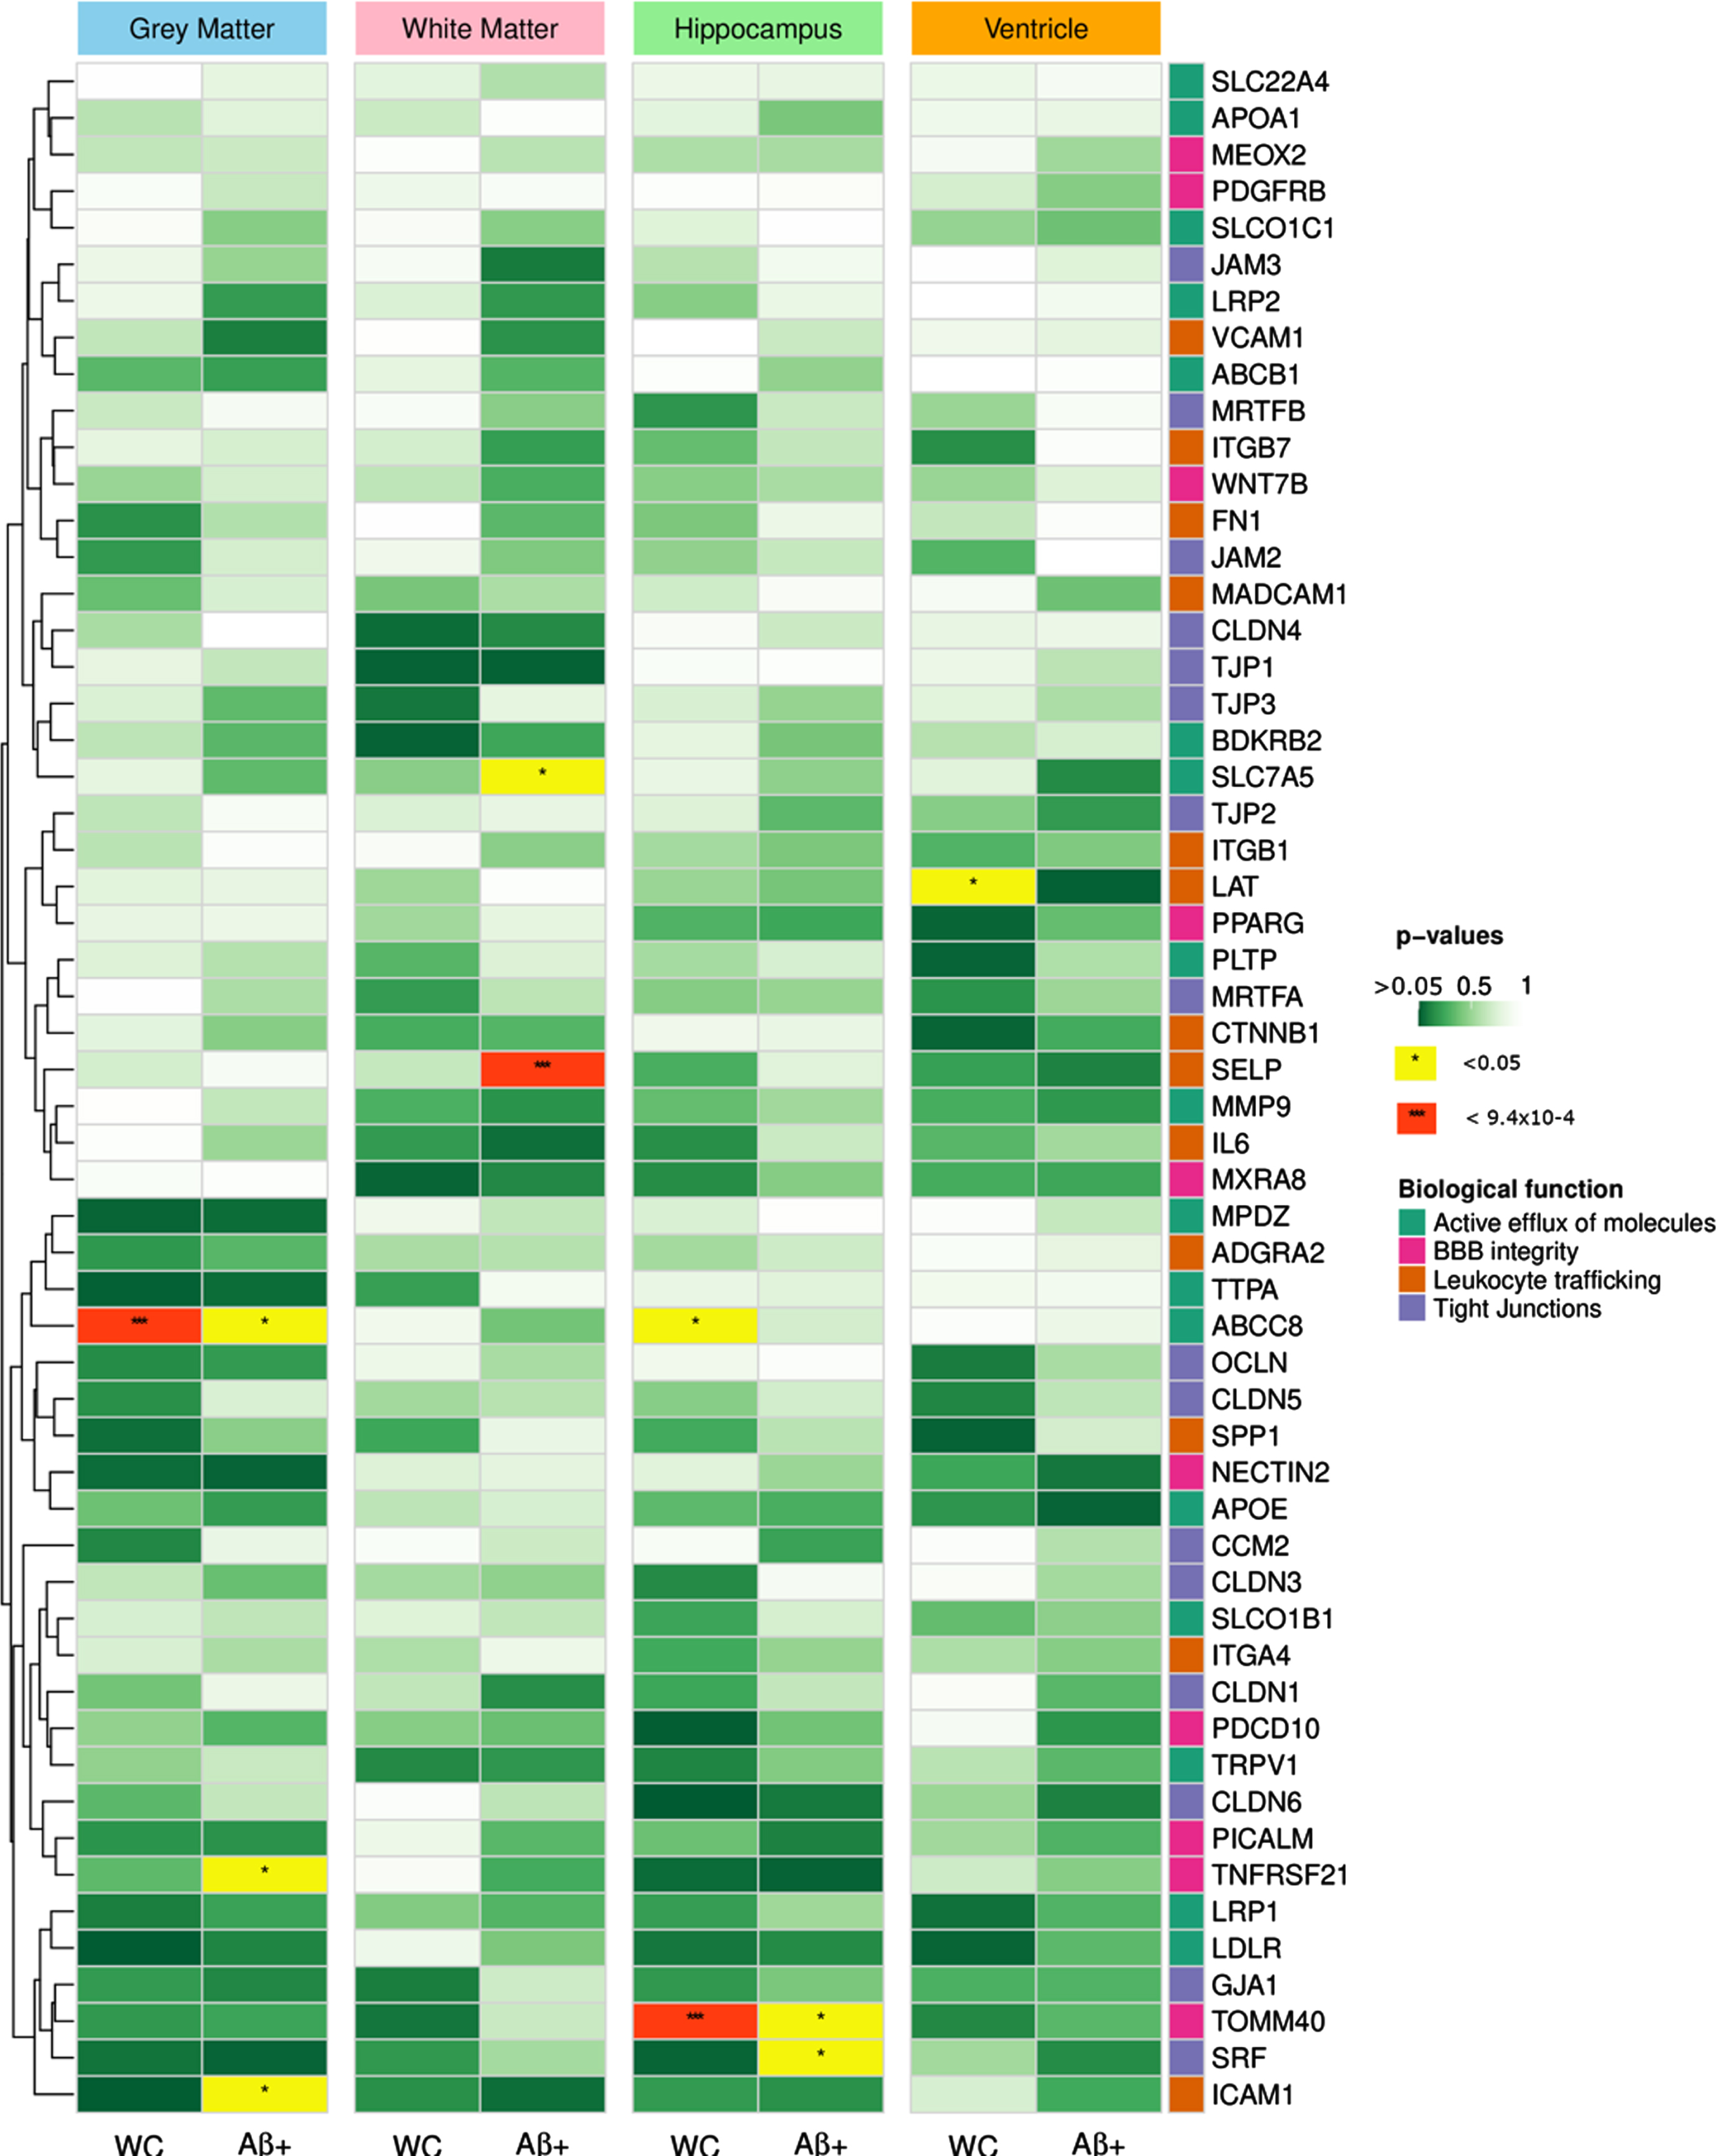
Heatmap summarizing the associations between SNP and rate of atrophy in the 4 brain regions of interest for the whole cohort and the Aβ positive populations. Rows correspond to genes and were sorted with hierarchical clustering. The right-hand side annotations represent the biological functions of the genes. The color of the cells reflect the p-values of the most significant SNP in each gene (**p < 9.26×10⁻⁴, *p < 0.05).
List of variants used for the calculation of the polygenic risk score for each brain region
p values correspond to the SNP×Time interaction, indicating a difference in rate of decline overtime.
The second most noticeable association identified, involved TOMM40 rs2075650 polymorphism and hippocampus volume change (β= –0.028, CI = [–0.044, –0.012], SE = 0.008, p = 8.9×10⁻⁴). Further, the results indicated that the effect of rs2075650 was stronger in the population consisting of Aβ positive individuals only (β= –0.036, CI = [–0.063, –0.01], SE = 0.013, p = 7.3×10⁻³). The significant effect of rs2075650 was not attributed to APOE variation given the model controlled for the presence of the APOEɛ4 allele.
Investigating associations specific to the Aβ positive population, we found the SELP rs2244526 SNP to be strongly associated with white matter rate of atrophy (β= 0.062, CI = [0.028, 0.096], SE = 0.017, p = 6.35×10⁻⁴). This result indicates that the mutation has a protective effect, with minor allele carriers exhibiting a significantly slower atrophy of white matter over time compared to the major allele carriers. The association was not retrieved when looking at the entire cohort (p = 0.57) suggesting that the effect of rs2244526 was specific to Aβ positive patients. No evidence of association was found in the Aβ negative population.
Polygenic risk score predicts brain atrophy
To assess the collective effect of genetic variations on regional brain atrophy, we calculated polygenic risk scores for the four regions of interest. The scores were generated using nominally significant associations (p < 0.05,grey matter, n = 18; hippocampus, n = 16; ventricle, n = 19, white matter, n = 12). We then used the PRS in
linear mixed models to evaluate the relationship
between the calculated scores and regional brain
atrophy. The PRS were significantly associated with
volume change in the four regions of interest (Table 3). Furthermore, comparing the slopes of volumetric change over time between high and low PRS individuals, the high PRS groupshowed greater volume change compared to low PRS individuals. This result was consistent across the 4 regions evaluated (hippocampus, p = 3.9e–2; white matter, p = 1.4e–2; grey matter, p = 9.8e–4; ventricle, p = 1.1e–2), with the largest effect observed in the hippocampus (Fig. 3). Comparing the PRS with amyloid status, the hippocampus was the only region showing a significant difference between groups, with Aβ positive individuals having a higher PRS than the Aβ negative group (p = 1.2e–4). In the three other regions investigated, the PRS scores were relatively similar in both Aβ positive and negative groups.
Beta estimates of the interactions between PRS and time on regional volume change
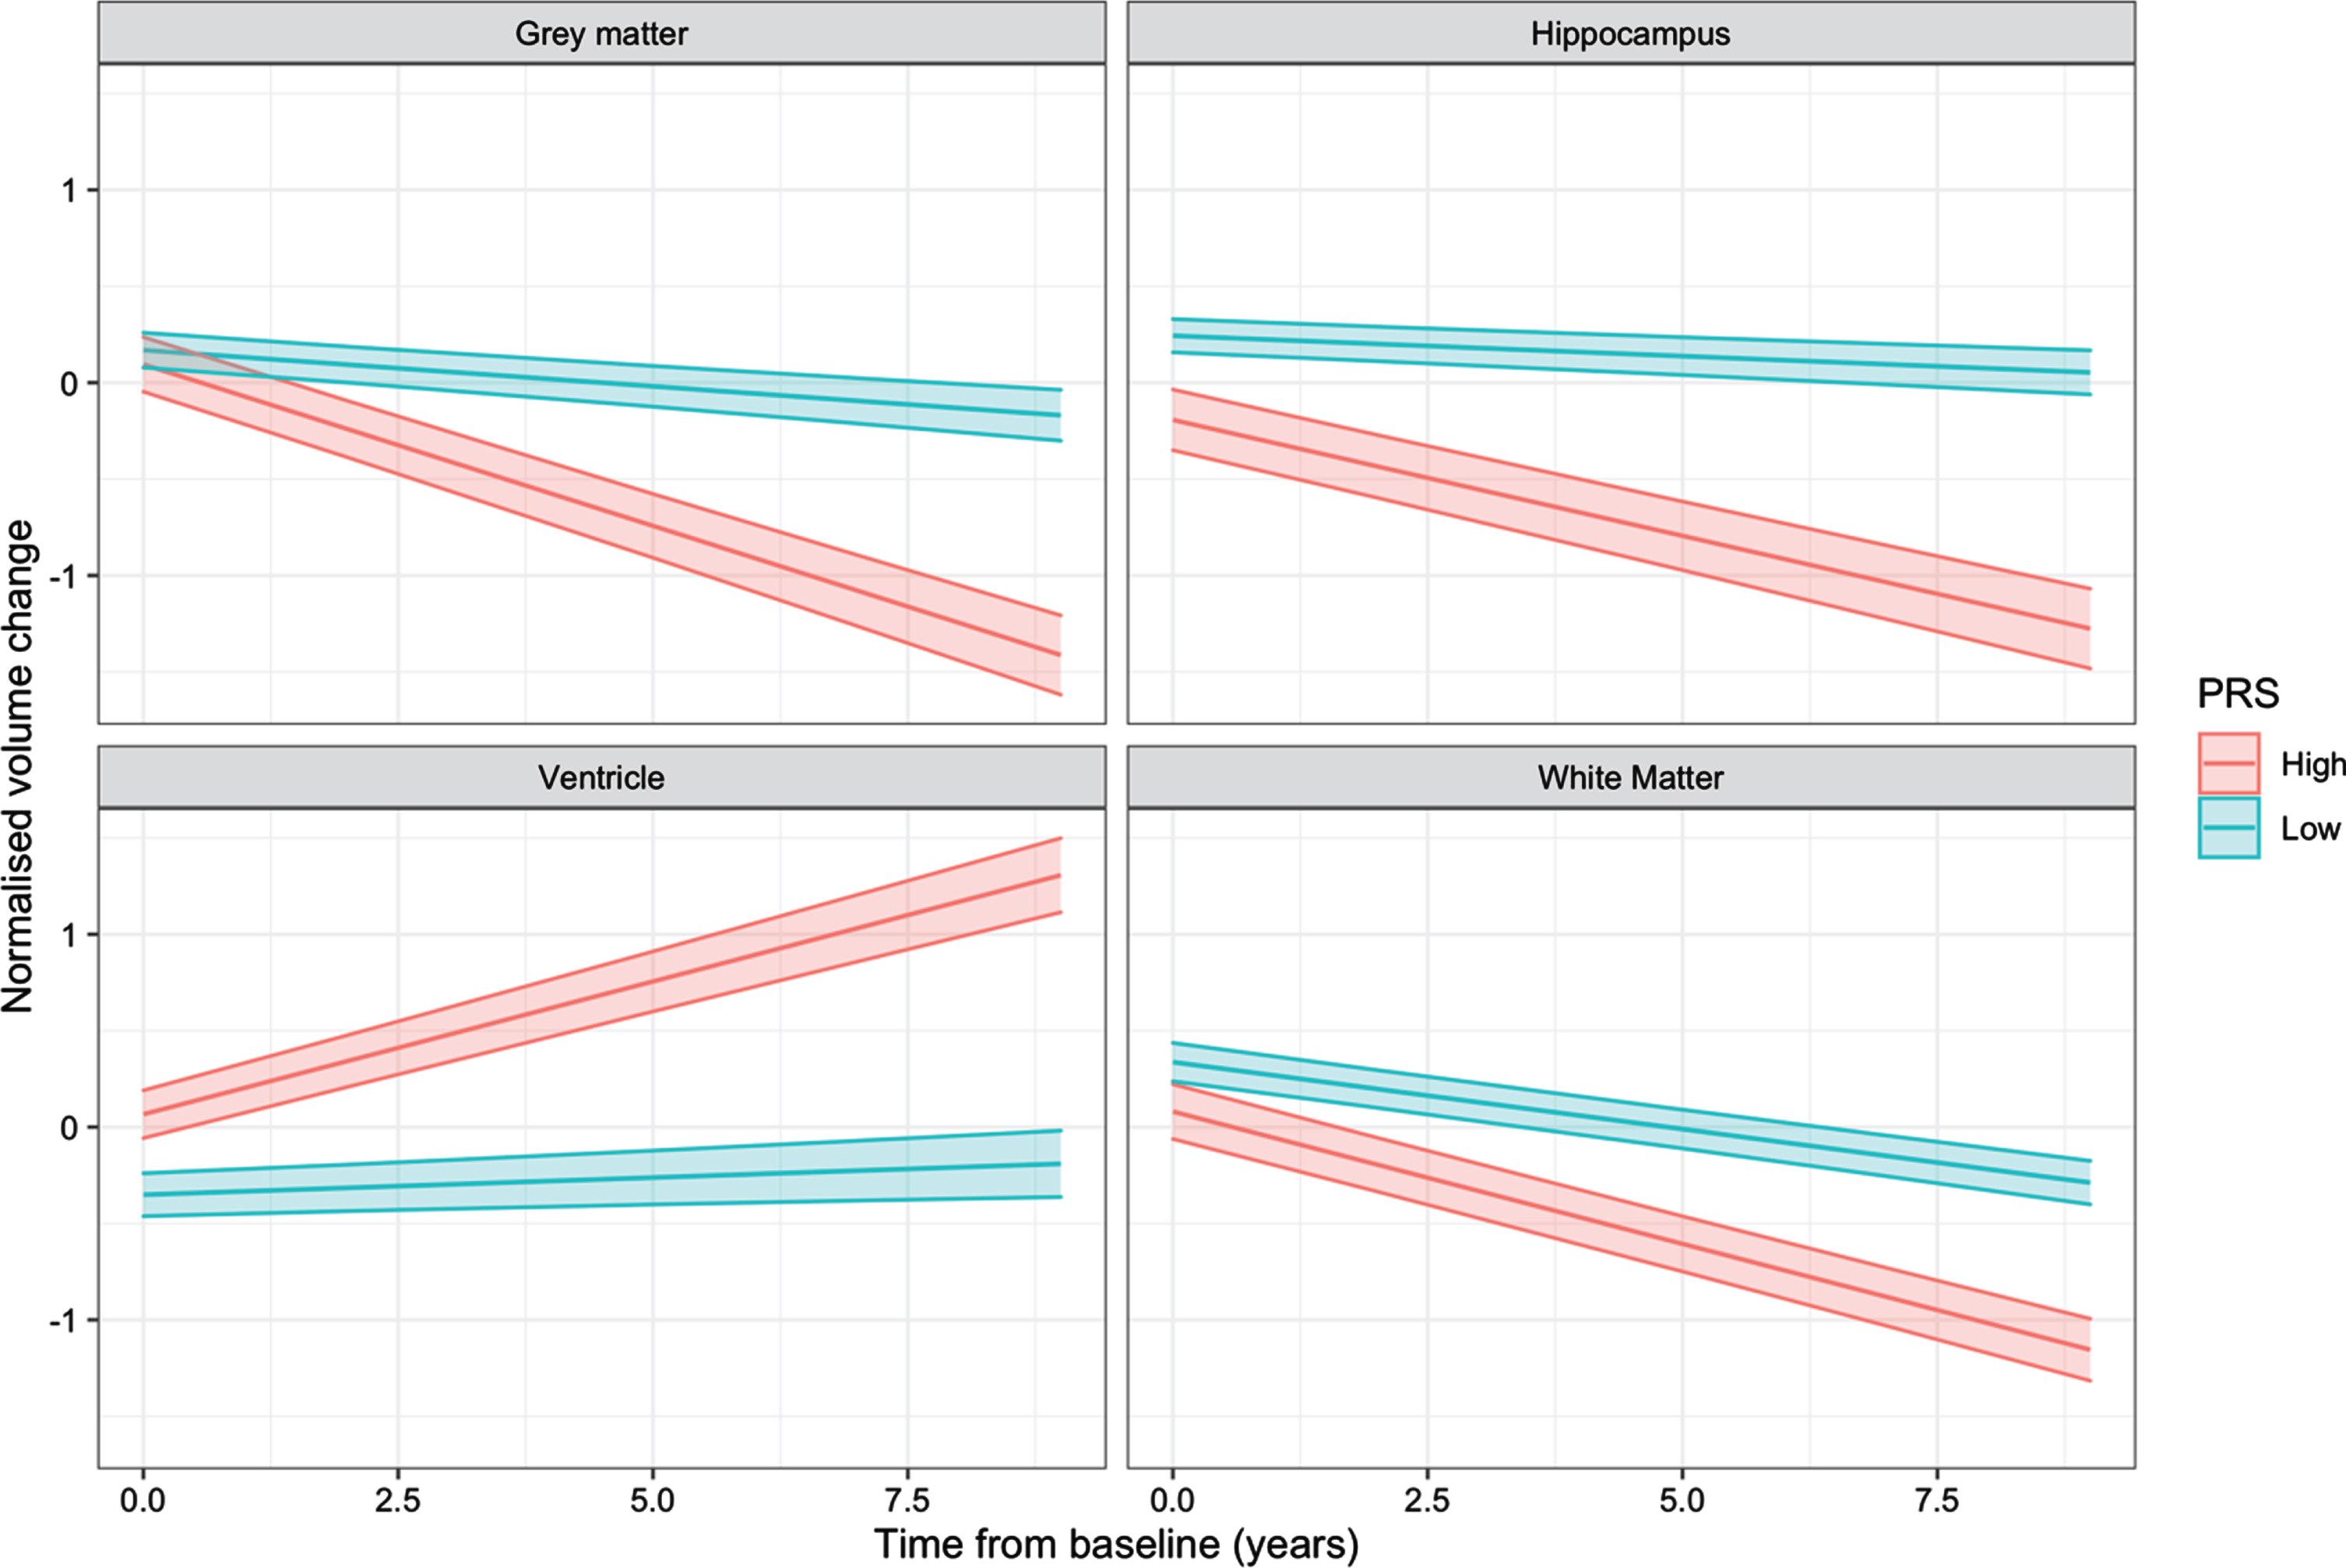
Interaction plots showing the effect of the PRS×Time interactions on longitudinal regional volume change. Individuals were grouped in high (1 standard deviation above the mean) and low (1 standard deviation below the mean) PRS categories.
DISCUSSION
The breakdown of BBB in AD patients has been demonstrated in a large number of independent postmortem studies showing the degeneration of BBB structural component [22]. Furthermore, recent neuroimaging studies in mild cognitive impairment and early AD populations have shown that BBB degeneration started well before brain atrophy and symptoms of dementia, specifically in the hippocampus [9] and different grey and white matter regions [23, 24]. Although the molecular mechanisms by which BBB disruption leads to cognitive impairment remain unclear, its contribution to the onset and progression of dementia and AD is now well-accepted. Genetic variations may influence the composition and the structural resiliency of the BBB. Therefore, the identification of these genetic factor could have potential implication for prognostic and predictive strategies for AD and other forms of dementia.
A number of recent studies have identified relationships between the disruption of the BBB and various medical conditions including diabetes [25, 26], hypertension [27, 28], and the incidence of stroke [29, 30]. Since our dataset included records of medical history, we assessed the potential effect of these three factors on longitudinal brain atrophy. Although no association was observed in the results, it is important to note that the AIBL study, from which our dataset originates, excluded individuals with serious comorbid disorders susceptible to affect cognition. Therefore, most of the participants are only subject to controlled medical conditionsthat are typical of this age group. This exclusion criteria may result in the presence unmeasured, and we therefore strongly encourage replication study to validate these findings.
Investigating associations between SNPs located in BBB related genes and longitudinal brain volume change,we identified loci strongly associated with volume change in the grey matter (ABBC8 rs4148617, p = 3.94×10⁻³) and hippocampus (TOMM40 rs2075650, p = 6.3×10⁻³). The effect of the two identified loci was independent of age, gender, and the presence of the APOEɛ4 allele. Previous studies have identified associations between genetic variations in ABBC8, a gene coding for the sulfonylurea receptor 1 (SUR1/ABBC8) [31], and the risk of developing cerebral edema following a traumatic brain injury [32, 33]. Variations in this gene may impact on transcriptomal machinery, protein expression or structure, which could lead to the loss of endothelial tight junction integrity and initiate BBB breakdown [34, 35]. The associations between the ABBC8 variant and volume change were found predominantly in the gray matter, hippocampus region, and to a lesser extent, ventricle.
The TOMM40 rs2075650 variant has been previously identified as a risk factor for AD in a number of independent studies [36]. However, due to the close proximity with the APOE defining SNP rs429358, the independent effect of rs2075650 remains arguable [37]. The rarer rs2075650 G allele has been found to be associated with several AD related phenotypes, including cognitive decline [38] and earlier age of onset [39, 40], while the A allele may be related to exceptional longevity [41].
Despite the extensive research conducted around this variant, its association with longitudinal atrophy, beyond APOEɛ4 is novel. This result suggests that TOMM40 rs2075650 could contribute to hippocampal atrophy, regardless of the presence of APOEɛ4.
In both cases, the effects of the rarer alleles in ABBC8 rs4148617 and TOMM40 rs2075650, were also observed in the Aβ positive population and with more severe rates of atrophy. This finding could be explained by the fact that there is a strong relationship between amyloid deposition and regional brain atrophy [42], particularly in the early stages of the disease. Therefore, the presence of these rare alleles, may contribute further to the atrophic process and result in accentuated rate of atrophy. Given these associations remained significant in models controlling for amyloid status, the faster rate of atrophy observed in minor allele carriers, cannot be attributed amyloid deposition alone. These findings warrant further investigation as, for both regions, rates of atrophy have been shown to strongly correlate with disease progression in AD [10, 43–45].
Restricting the analysis to Aβ positive individuals only, we found a strong association between the SELP rs2244526 SNP and white matter rate of atrophy. The results indicated that minor allele carriers gain benefit from the mutation, showing a slower rate of atrophy compared to common allele carrier. This association was not found Aβ negative individuals, suggesting SELP rs2244526 could be associated with mechanisms that are triggered after amyloid deposition has started accumulating. Follow up analyses using a quantitative measure of amyloid deposition instead of a binary classification based on a threshold of amyloid abnormality, could help exploring this hypothesis.
Regional PRS showed strong associations with longitudinal volume changes in the four regions investigated. Furthermore, high PRS individuals consistently showed accelerated rates of volume change compared to low PRS individuals. This exacerbated effect in high PRS subjects suggests that the selected variants contribute collectively to regional volume changes. Regardless of amyloid load, low PRS subjects consistently showed rates of volume change that were amongst the slowest in our population, supporting the assumption that their genetic profiles confer a reduced rate of atrophy. In addition, the effects of the associations between PRS and regional volume change were much larger than the effects of any individual locus, or even of all individual effects summed together. This result could suggest the presence of epistatic interactions between variants and suggest that the effects of individual locus are cumulative. When stratifying individuals based on their amyloid status, we noted that PRS scores were relatively similar in both amyloid positive and negative patients, except in the hippocampus region, in which, high amyloid burden was associated with high PRS (p = 1.2e–4). One factor that may partially account for this observation is the presence the TOMM40 rs2075650, a marker associated with brain amyloid load [46], in the calculation of the PRS for the hippocampus region.
Large-scale association analyses on longitudinal traits remain relatively rare, mainly due to the difficulties in collecting measurements at regular timepoints and from a sufficient number of patients. Despite using a highly characterized dataset, the presented study still suffers from a limited number of observations and would require further validation in an independent cohort to confirm the results. Our dataset includes up to five longitudinal measurements of brain volumetrics per patient (N = 721), taken at regular 18-month intervals. Although this represents a significant cohort in a clinical context, it remains a relatively small sample size from a statistical point a view, which limits our capabilities to model complex processes such as cortical atrophy. For instance, it has been shown that several brain regions, including grey matter and hippocampus had non-linear atrophy profiles, with rates of atrophy varying over-time and along disease progression [47, 48]. Furthermore, these non-linear atrophy patterns are present in both, normal aging and AD, with a more pronounced effect in AD individuals [44]. To adequately model such complex evolution would require a far larger number of timepoints and patients. Although, we cannot account for this non-linear degeneration, our models are appropriate to estimate the effects of genetic variants on the overall rate of atrophy over the period of the study. Moreover, the model presented in this study did not account for the potential effects of environmental factors and other comorbidities. Considering the limited number of samples available, the integration of additional random effects and interaction terms to assess the effects of additional factors would compromise the model’s ability to detect the impact of genetic variants, which was the main objective of the study. Nonetheless, the relatively simple designof the linear-mixed effect model presented in this study would encourage and facilitate the validation of our findings in other cohorts. The markers identified could help shed some light on the mechanisms involved in regional brain atrophy. Furthermore, considering the PRS generated in this study rely on a relatively low number of markers, these could provide convenient guides for anticipating patients’ future rate of atrophy in a clinical context.
Footnotes
ACKNOWLEDGMENTS
We thank all the investigators within the AIBL who contributed to the design and implementation of the resource and/or provided data but did not actively participate in the development, analysis, interpretation or writing of this current study. A complete listing of AIBL investigators can be found at ![]() .
.
Funding for the AIBL study was provided in part by the study partners [Commonwealth Scientific Industrial and research Organisation (CSIRO), Edith Cowan University (ECU), Austin Health, CogState Ltd.]. The AIBL study has also received support from the National Health and Medical Research Council (NHMRC). Data used in preparation of this article was obtained from the AIBL (![]() ).
).