



Abstract
Background:
Vitamin D insufficiency has been suggested as a dementia risk factor.
Objective:
In this cross-sectional, explorative study we investigated whether levels of vitamin D in cerebrospinal fluid (CSF) are lower in patients with positive biomarkers of Alzheimer’s disease (AD) compared to cognitively healthy controls and whether polymorphisms of the vitamin D receptor (VDR) gene, FokI, BsmI, ApaI, and TaqI, are associated with levels of vitamin D in CSF and cognition.
Methods:
We included 100 patients≥65 years assessed for cognitive impairment and 76 cognitively healthy controls. Levels of 25-hydroxyvitamin D (25(OH)D) in both serum and CSF, and VDR polymorphisms were analyzed.
Results:
The mean level of 25(OH)D in serum was 78.6 (SD 28.9) nmol/l. While serum levels of 25(OH)D were not significantly different between the groups, CSF levels of 25(OH)D were significantly lower in patients with positive AD core biomarkers (p = 0.001) compared to patients without such biomarkers. Individuals with the BsmI major homozygote genotype had significantly lower results on a 10-word delayed recall test (p = 0.044) and verbal fluency test (p = 0.013), and individuals with the TaqI major homozygote genotype had significantly lower results on a verbal fluency test (p = 0.030) compared to individuals with the corresponding minor homozygote genotype.
Conclusion:
Patients with positive AD core biomarkers have low CSF levels of 25(OH)D, despite sufficient serum levels. CSF levels of 25(OH)D do not seem to be affected by any of the four VDR gene polymorphisms. TaqI and BsmI major homozygote genotypes might be at increased risk for development of cognitive decline.
Keywords
INTRODUCTION
Dementia, and especially Alzheimer’s disease (AD), is a global and rising health concern, and research on all aspects of brain health is of critical importance. There has been an increased interest in how brain health is affected by nutritional factors [1], vitamin D being one of them. The term “vitamin D” refers to several vitamin D metabolites, with 25-hydroxycholecalciferol (25(OH)D) being the major circulating metabolite that is used as an index of vitamin D status.
Several longitudinal and cross-sectional studies have consistently found associations between hypovitaminosis D and cognitive impairment and dementia [2]. Executive function seems to be more affected than memory [3]. The results of intervention studies on the other hand have been inconsistent [2], and have not shown that the onset of dementia is preventable by increasing vitamin D serum levels. This could be partly due to the studies’ small samples of participants with low levels of vitamin D and ethical issues involved with including a placebo control group that withholds treatment for individuals with hypovitaminosis D [4]. Another limitation of the intervention studies might be that the most used tool for cognitive evaluation, the Mini-Mental State Exam (MMSE), has very few items for assessing executive functioning.
Vitamin D is a fat-soluble vitamin that has the chemical structure of a steroid hormone, with a cholesterol backbone. It exerts genomic effects in cells by binding to the vitamin D receptor (VDR). VDR is a transcription factor expressed in over 30 human tissues and has been shown to affect the expression of more than 200 human genes [5]. In the human brain, VDR is abundantly expressed in areas responsible for cognition and memory, such as the cortex and hippocampus [6]. Finding both VDR in the human brain and detecting vitamin D in CSF has presented vitamin D as a possible neurosteroid hormone [7]. The VDR gene is located on chromosome 12q12-q14 and spans a length of 75 kb with 14 exons. Several functional VDR single nucleotide polymorphisms (SNPs) are known. The most studied are BsmI, ApaI, Tru9I in intron 8, TaqI in exon 9 and FokI in exon 2 [8].
The free hormone hypothesis suggests that only the free fraction of a hormone can enter cells and that the free hormone fraction might correlate better with clinical outcomes [9]. This has also been suggested for 25(OH)D, which is considered a pro-hormone [10]. Vitamin D metabolites are distributed in serum bound to vitamin D binding protein (DBP) (85–90%) and albumin (12–15%) [11]. In plasma, the free fraction of 25(OH)D is only about 0.03–0.04%. [12]. Acute illness and liver disease might affect the total fraction of 25(OH)D measured in plasma, but this does not necessarily affect the free fraction in tissues. The clinical usefulness of the vitamin D free fraction in healthy subjects is disputed [13]. The direct measurement of free 25(OH)D is still not fully developed for clinical use. Therefore, free 25(OH)D is calculated based on the law of mass action of binding proteins [11], by modification of the Vermeulen method for free testosterone estimation [14].
As vitamin D levels might be influenced by genetic polymorphisms, binding proteins, the blood-brain barrier (BBB) and intracerebral inflammation, the question is whether blood levels of 25(OH)D reflect the available levels of vitamin D in human brain. However, few investigators have measured intrathecal levels of vitamin D and standardization for assays conducted in tissues other than plasma or serum is lacking [15].
Study aims
We aimed to examine whether CSF levels of 25(OH)D are reduced in patients with core biomarkers of AD compared to cognitively healthy controls, and whether selected VDR polymorphisms are associated with 25(OH)D levels in CSF or serum. Further we aimed to investigate whether using estimates of the free vitamin D fraction in serum would alter any of our findings. Additionally, we aimed to explore whether VDR polymorphisms might be associated with performance on selected cognitive tests for memory and executive function.
MATERIALS AND METHODS
Study participants
In total, 176 persons aged 65 years and above were included. Data, including blood and CSF samples, from the 100 patients in the patient group were obtained from the Norwegian registry for persons assessed for cognitive symptoms (NorCog) with samples collected from 2011 until 2020. NorCog is a Norwegian national quality and research registry [16] that includes primarily home-dwelling persons who are referred to a specialist for assessment of cognitive symptoms and have competence to consent. The registry includes persons with subjective cognitive impairment (SCI), MCI, and dementia. Registered data consist of, amongst other variables, age, sex, education (in years), comorbidity, prescribed medications, cognitive test performance in several domains, as well as clinical examination, radiological imaging, laboratory tests, and clinical diagnosis. In the patient group, 76 persons were matched to the control group on age and gender. The remaining 24 persons were not matched, due to the restricted number of controls.
The control group (76 persons) was recruited among orthopedic patients at Lovisenberg Diaconal Hospital who were scheduled to undergo elective surgery (hip or knee replacement) under spinal anesthesia in the period from 2018 to 2020. The CSF samples were taken prior to spinal anesthesia. The cognitively healthy controls included in the study were preoperatively screened with cognitive tests and persons with MMSE < 27/30 points, Clock Drawing Test < 3/5 points or Trail Making Test A or B worse than two standard deviations below the mean expected value (adjusted for age and education) were excluded. Data on age, sex, education (in years), alcohol consumption, smoking habits, comorbidity, and prescribed medication were also collected.
Exclusion criteria for both groups were unstable medical or psychiatric conditions that may influence cognition or compliance; ongoing infections/inflammatory conditions; disturbances in calcium homeostasis and/or stage 3–4 kidney failure; contraindications to lumbar puncture; other chronic diseases or drug use that may influence laboratory results.
Ethical considerations
The study was approved by The Regional Committee for Medical and Health Research Ethics (reference 2016/888/REK Sør-øst C). All participants in the control group gave informed written consent for their participation. Participants in the patient group gave informed written consent for inclusion in NorCog.
Biochemical procedures and genetic analyses
Blood and CSF samples were collected within a maximum interval of three days. All serum and CSF samples were transferred to storage tubes immediately after centrifugation and stored at –80°C. 25(OH)D levels in both serum and CSF were analyzed with liquid chromatography double mass spectrometry (LC-MS/MS). For CSF analysis, ultraperformance liquid chromatography-tandem mass spectrometry (UPLC-MS/MS) was applied as standard LC-MS/MS assays have a lower limit of detection (LLOD) at 12.5 nmol/l. Serum analysis was performed at Oslo University Hospital, and CSF was analyzed at Vitas AS laboratory.
Free and bioavailable 25(OH)D levels in serum were calculated using the formula by Bikle et al. [11]:
For calculation of 25(OH)D and bioavailable 25(OH)D by formulas above, 25(OH)D in mol/L, albumin in mol/L and DBP in mol/L were used.
The core CSF biomarkers for AD were analyzed for all patients and controls at the Department of Interdisciplinary Laboratory Medicine and Medical Biochemistry at Akershus University Hospital. The laboratory participates in the Alzheimer’s Association QC program for CSF biomarkers [17]. Until October 2020, the samples were analyzed by enzyme-linked immunosorbent assays using the Innotest kit (Innogenetics, Ghent, Belgium). After this time, the method was changed to ElectroChemiLuminescense ImmunoAssay (ECLIA) using the Cobas e 602 (Roche Diagnostics). Thus, the laboratory’s recommended cut-off values for a normal test have been changed during the time of inclusion in the present study due to the change of the method and later also due to the transition to Sarstedt tubes [18].
Genotyping was performed on all subjects at Oslo University Hospital. The four most common polymorphisms of the VDR gene, FokI, BsmI, ApaI, and TaqI were analyzed. APOE polymorphisms were also analyzed for all participants. DNA was extracted from whole blood using the Qiaamp DNA Mini Blood kit (Qiagen, Hilden, Germany). DNA concentration and purity were measured on a QIAxpert system (Qiagen). Genotyping was performed with TaqMan genotyping assays on an Applied Biosystems QuantStudio 12K Flex instrument (Thermo Fisher, Waltham, MA, USA), according to manufacturer’s instructions. Predesigned TaqMan assays (Thermo Fisher) were purchased for ApaI (rs7975232 / assay ID: C__28977635_10), BsmI (rs15444410 / assay ID: C___8716062_20), FokI (rs2228570 / assay ID: C__12060045_20) and TaqI (rs731236 / assay ID: C___2404008_10). Assays were run in duplicate, and analyzed with TaqMan Genotyper Software v1.6.0 (Thermo Fisher). For APOE SNP genotyping and allele discrimination, predesigned TaqMan assays (Thermo Fisher) were used for rs429358 (assay ID: C__3084793_20) and rs7412 (assay ID: C__904973_10). APOE alleles were classified as described by Koch et al. [19].
Following nomenclature for VDR genotypes is used in the article:
Cognitive examination and diagnosis of all-cause dementia, AD, and MCI
Incident all-cause dementia was diagnosed according to the ICD-10 criteria. Clinical AD MCI or dementia were diagnosed according to National Institute on Aging (NIA) at National Institutes of Health (NIH) and the Alzheimer’s Association published revised guidelines [20]. MCI was diagnosed according to the Winblad criteria for MCI [21]. The diagnosis of probable Alzheimer pathology was based on the clinical picture supported by AD core biomarkers of phospho-tau, tau, and amyloid-β in CSF [22, 23].
The following cognitive tests were used in the study: Mini-Mental Status Examination, Norwegian version (MMSE-NR), Clock Drawing Test, Trail Making Test (TMT) A and B [24, 25], CERAD 10-word immediate and delayed recall tests [26], and the Controlled Oral Word Association Phonemic Verbal Fluency (COWA 257 FAS) Test [27].
Covariates
The following covariates identified as potential confounders for both cognitive symptoms and vitamin D metabolism were chosen: age in years, gender, season of blood collection (unless the vitamin D was taken at the same time as other serum and CSF samples or cognitive tests), education (in years), smoking (nonsmoker, previous smoker, current smoker), alcohol consumption (nondrinkers, moderate drinkers [≤3 drinks/week], moderate to heavy drinkers [> 4 drinks/week or previous alcohol abuse], and vascular risk factors (heart disease, cerebrovascular disease, hypertension or diabetes mellitus). APOE polymorphism (non-APOE ɛ4, heterozygote APOE ɛ4 or homozygote APOE ɛ4) were included as additional covariates in genetic analysis.
Statistics
Data were described by means and standard deviations (SDs) or frequencies and percentages. Patient and control groups were compared by suitable statistical tests. Due to a weak correlation between the 25(OH)D in CSF and serum (Pearson’s correlation coefficient (PCC) of 0.25), separate analyses for 25(OH)D in CSF and 25(OH)D CSF/serum ratio were performed. As the correlation between calculated free vitamin D fraction in serum and total 25(OHD) in serum was very strong (PCC of 0.95), free vitamin D fraction was not used in further analysis.
For 25(OH)D in CSF, 17 observations were below the lower limit of detection (0.5). A tobit regression model with cut-off 0.49 was therefore estimated to assess mean and SD of 25(OH)D in CSF. Regression models were estimated to assess associations between 25(OH)D in CSF, 25(OH)D CSF/serum ratio or 25(OH)D in serum and patient groups (patients and controls), diagnostic groups (non-AD MCI and dementia, AD MCI and dementia, and controls), and SNP genotypes (BsmI, FokI, TaqI, and ApaI), classified as heterozygote, major homozygote, or minor homozygote.
A tobit regression model was estimated for 25(OH)D in CSF, while linear regression analysis was performed for 25(OH)D CSF/serum ratio and 25(OH)D in serum. A linear regression model was also estimated to assess the associations between cognitive tests and SNP genotypes. All models were adjusted for pre-selected confounders of age, gender, alcohol consumption, smoking habits, vascular risk factors, and APOE polymorphism. The models for cognitive test were also adjusted for season. Only cases with no missing values on covariates were included in the regression models.
Results with p values≤0.05 were considered statistically significant. Due to the exploratory nature of the study, no adjustment for multiple testing was implemented. Statistical analyses were performed using SPSS v27 (IBM Corp, Armonk, NY, USA) and Stata v16 (StataCorp, College Station, TX, USA).
RESULTS
The study participants constituted two main groups: the patient group and the control group. One person with SCI was excluded from the patient group. The results with mean levels of 25(OH)D and SD are presented in Fig. 1. Mean age was 71 (SD 5) years and 43% of the participants were men. More details on the study sample are presented in Table 1. The details on CSF biomarkers and VDR genotype frequencies are presented in Table 2.
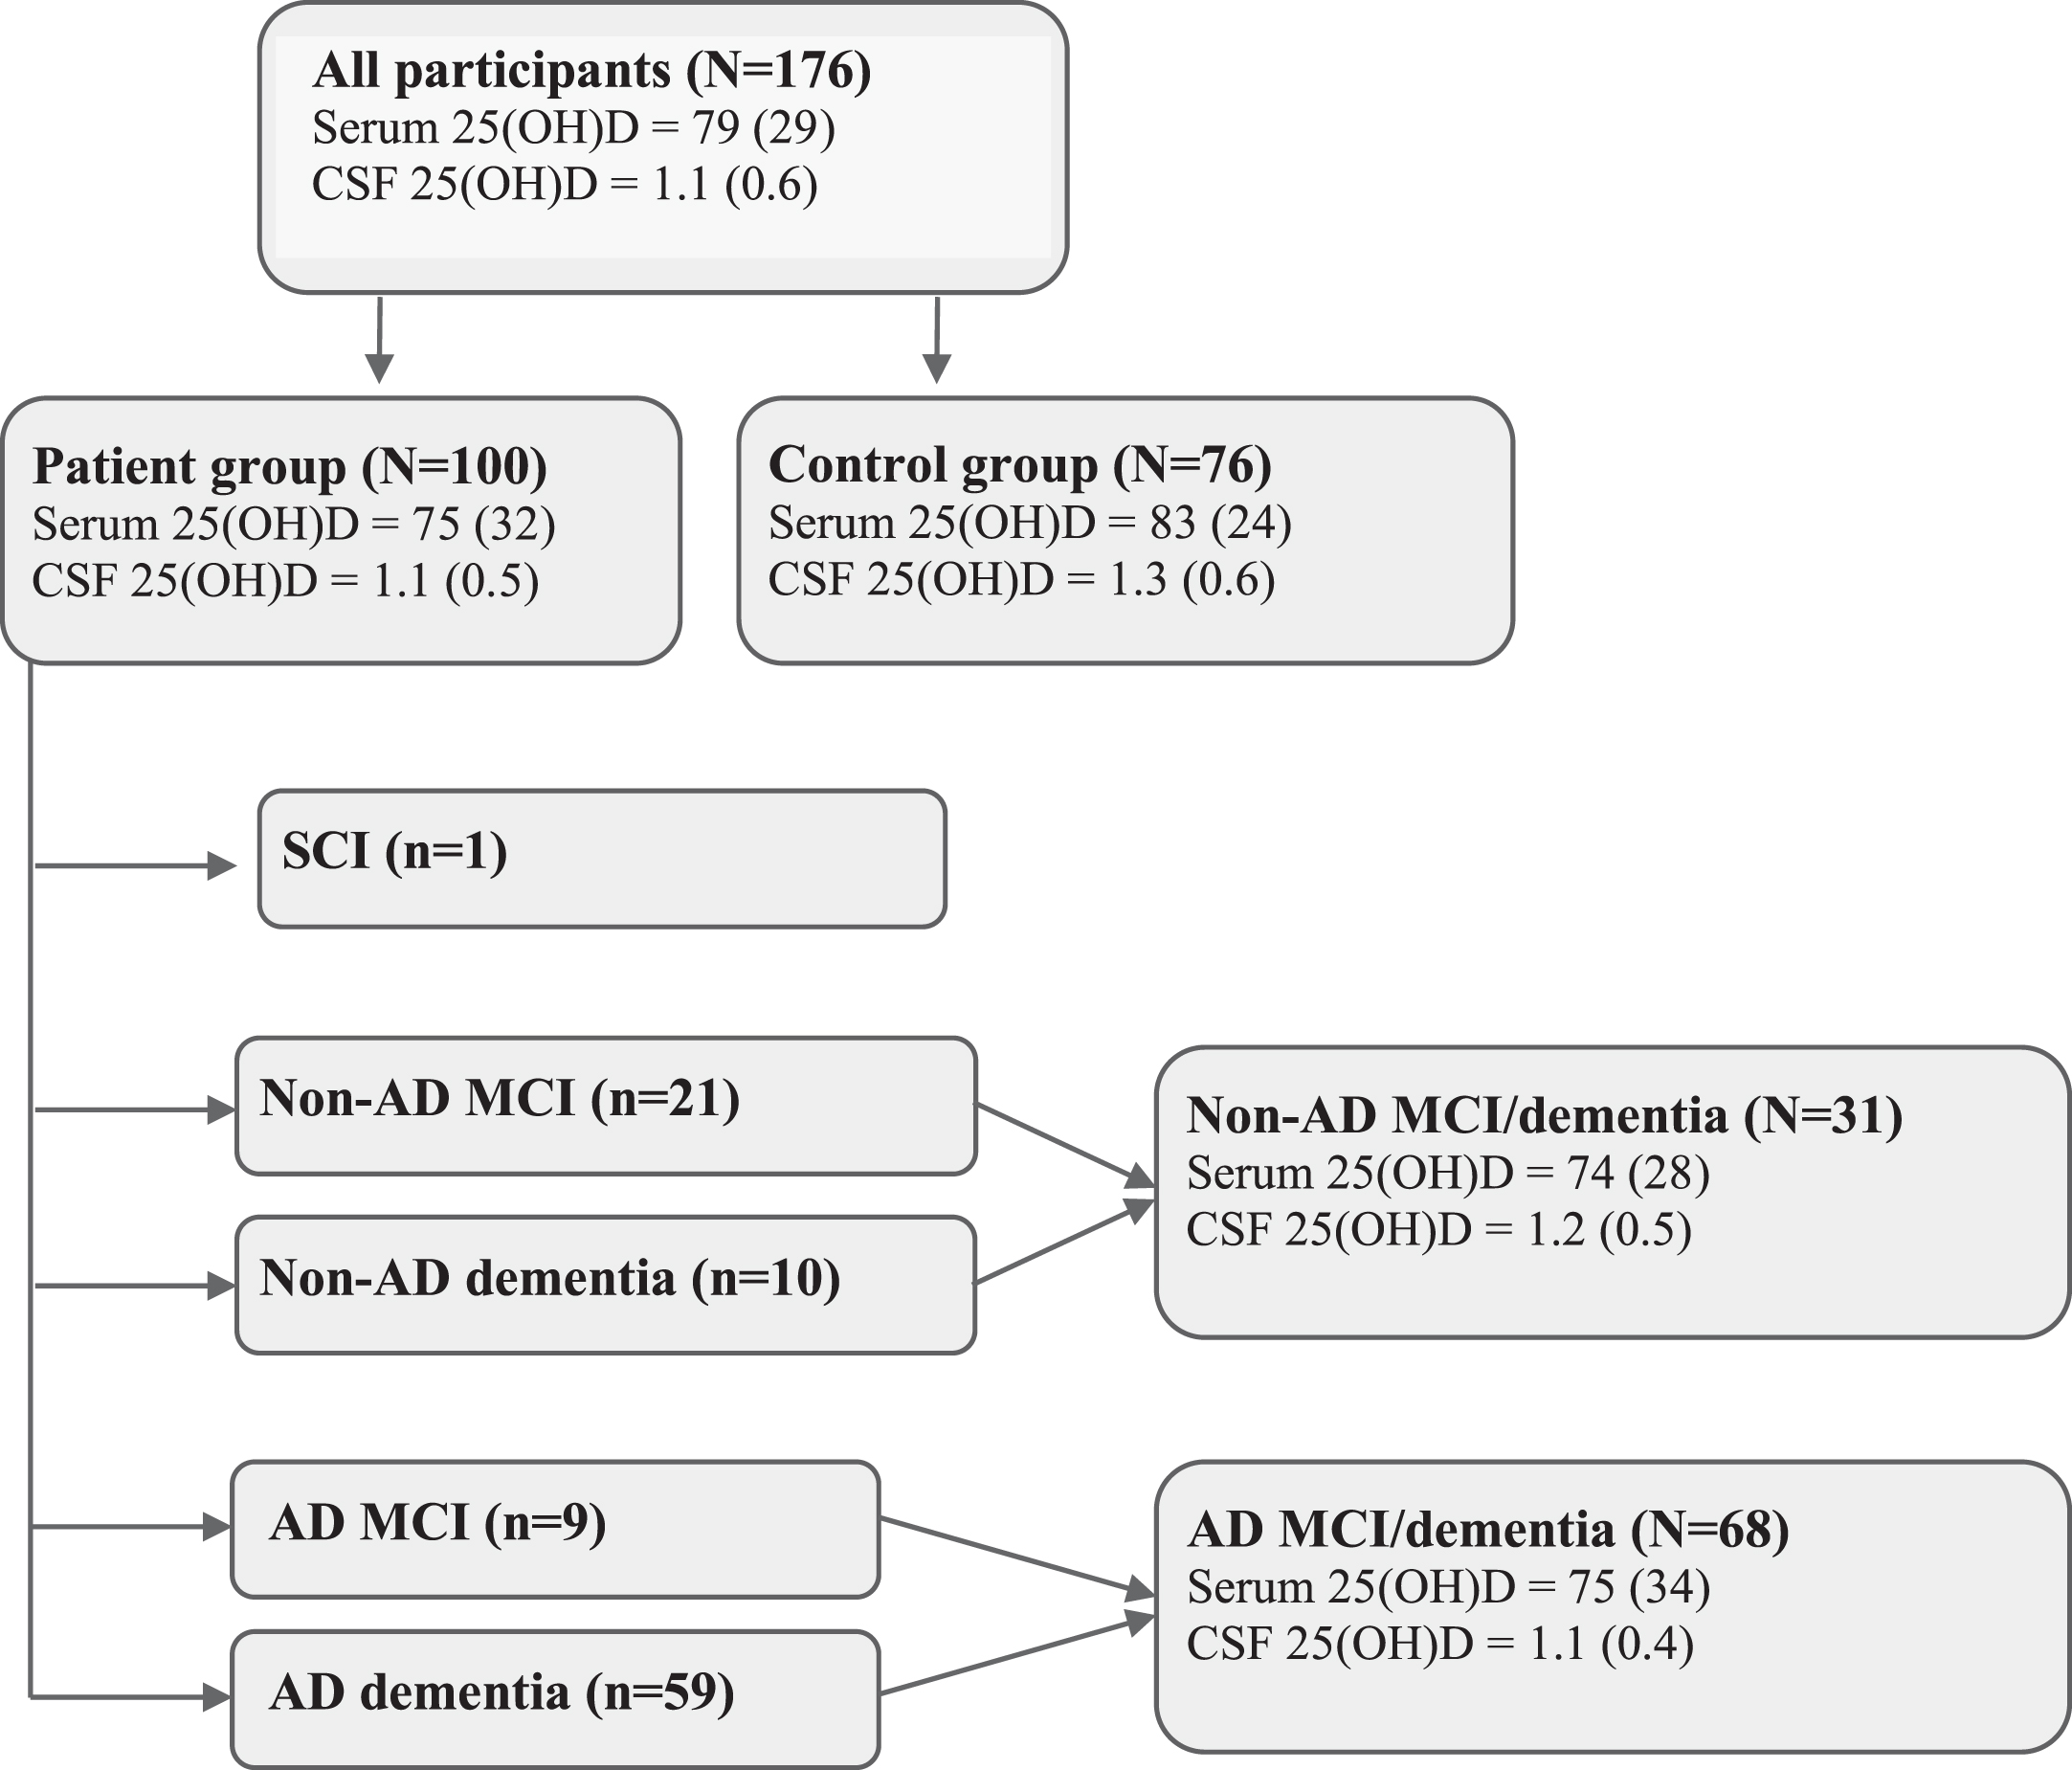
Participant flowchart with mean (SD) levels of 25(OH)D (nmol/l) in serum and CSF. AD, Alzheimer’s disease; CSF, cerebrospinal fluid; MCI, mild cognitive impairment; SCI, subjective cognitive impairment.
Descriptive characteristics of the patient and control groups
AD, Alzheimer’s disease; MCI, mild cognitive impairment; LLOD, lower limit of detection. *Mean and SD were calculated from a tobit regression model.
Alzheimer’s biomarkers and genotype frequencies in total sample (N= 176)
*The cut-off values for abnormality for the analysis of the amyloid-β, tau protein, and phosphorylated tau protein at the national reference laboratory Akershus University Hospital have changed between 2011 and 2020 due to use of different analytic methods. The values in the table are thus presented as pathological or normal according to the test method used at the time of analysis. 1p-value for χ2-test.
Vitamin D in serum and CSF
Severe vitamin D deficiency was uncommon. Only one person (0.6%) had serum 25 (OH)D levels < 25 nmol/l and 8% had levels < 50 nmol/l. About 50% of the participants had vitamin D < 75 nmol/l. The mean level of 25(OH)D in CSF was 1.1 (SD 0.6) nmol/l, and in serum 78.6 (SD 28.9) nmol/l. The mean 25(OH)D CSF/serum ratio was 0.02 (SD 0.008). The association between 25(OH)D in CSF and in serum (PCC 0.25) and between free vitamin D fraction in serum and 25(OH)D in serum (PPC 0.95) is illustrated in Fig. 2.

Associations between (A) 25(OH)D in CSF and in serum and (B) free vitamin D fraction in serum and 25(OH)D in serum.
As presented in Table 3, the patient group had significantly lower levels of 25(OH)D in CSF compared to the cognitively healthy controls in the adjusted analysis (p = 0.001). Patients with AD (dementia and MCI group) had significantly lower levels of 25(OH)D in CSF compared to the control group (p = 0.001).
Regression models of associations of patient status and diagnosis with 25(OH)D in CSF, CSF/serum ratio, and serum (N = 173)
AD, Alzheimer’s disease; CI, confidence interval; CSF, cerebrospinal fluid; MCI, mild cognitive impairment; RC, regression coefficient. *Models are adjusted for age, sex, education (in years), alcohol consumption, smoking habits, and vascular risk factors.
The analysis with 25(OH)D CSF/serum ratio showed significantly lower levels of 25(OH)D-ratio in patients with positive AD core biomarkers compared to the control group (p = 0.02). There was no significant difference in serum levels of 25(OH)D between the patient and control groups nor between patients with or without positive AD core biomarkers compared to the control group.
VDR SNPs and vitamin D
For BsmI, FokI, and TaqI, there were respectively one, two and one failed samples that likely indicate individuals carrying an unusual allele. ApaI had the highest failure rate (11 samples). The assay used did not yield signals as strong as the other three, despite repeating the assay three times.
According to the multiple regression models in Table 4, there were no significant associations between any of the four examined VDR SNPs and levels of 25(OH)D in CSF or 25(OH)D CSF/serum ratio. However, both patients and controls with the Taql minor homozygote genotype had significantly lower levels of 25(OH)D in serum than those with the Taql major homozygote genotype.
Regression models of associations of VDR genotypes with 25(OH)D in CSF, CSF/serum ratio and serum (N = 173)
VDR, The vitamin D receptor; SNP, single nucleotide polymorphism; CSF, cerebrospinal fluid; CI, confidence interval; RC, regression coefficient. *Models are adjusted for season, APOE ɛ4 polymorphism, sex, and age.
VDR SNPs and cognitive tests
Both patients and controls with the BsmI major homozygote genotype had significantly lower scores on the CERAD 10-word delayed recall test (p = 0.04) and the COWA FAS test (p = 0.01) compared to those with the BsmI minor heterozygote genotype. Furthermore, those with the TaqI major homozygote genotype had significantly lower COWA FAS test scores (p = 0.03) after adjusting for APOE polymorphism. There were no significant associations between any of the other SNPs and cognitive test scores.
Vitamin D and APOE genotypes
Values of 25(OH)D in serum and CSF were compared within both patient and control group according to APOE genotypes. We did not find any significant differences in vitamin D levels in serum or CSF between APOE ɛ4-carriers and non-carriers. The results are presented in Table 5.
Associations of 25(OH)D in serum and CSF with APOE genotypes
1Calculated from tobit-model.
DISCUSSION
To the best of our knowledge, we are the first group to assess 25(OH)D in CSF in patients with cognitive impairment classified according to the AD core biomarkers, using the LC-MS/MS method, and the first group to investigate a possible relation between 25(OH)D levels in CSF and VDR polymorphisms. We found that persons with MCI and dementia with positive AD core biomarkers have low cerebrospinal fluid levels of 25(OH)D, despite normal blood levels. We found no association between 25(OH)D levels in CSF and VDR polymorphisms. However, carriers of the Taql minor homozygote genotype had lower serum 25(OH)D compared to carriers of other Taql genotypes.
Methods for evaluation of vitamin D in CSF
Mean levels of 25(OH)D detected in CSF in the present study were about 1–2% of serum values. As the LC-MS/MS method is considered the gold standard for vitamin D analysis in serum due to its high specificity and sensitivity [15], we suggest that this might be a more accurate method than immunoassay analysis, which may overestimate the concentration of 25-OHD in CSF.
Different methods used in previous studies have resulted in widely different values for CSF/serum ratio of 25(OH)D. In 2009, Holmøy et al. were the first group to analyze 25(OH)D in CSF using the ultra-performance LC-MS/MS method [28]. The authors found CSF/serum 25(OH)D ratio to be around 0.5%, similar to the CSF/serum albumin ratio, supporting the theory that 25(OH)D is likely to pass through the BBB by passive diffusion and not active transport. These findings diverged from the only previous study from 1984, where the median concentration of 25(OH)D in CSF was reported to be as high as 20.8 nmol/l [29]. After 2009, a few other research groups measured 25(OH)D in CSF, but none of the studies utilized the LC-MC/MS assays until the publication by Zelzer et al. (2021) [30]. The authors validated the LC-MS/MS method for the analysis of 25(OH)D in CSF and found that the results were consistent with those of Holmøy et al. Furthermore, the authors found that persons with vitamin D deficiency, had upregulated transport of vitamin D metabolites across the brain-CSF-barrier, suggesting tightly regulated metabolism of vitamin D in the brain [30].
The ELISA method for analysis of 25(OH)D in CSF was used in a study published in 2013 where the authors found median CSF 25(OH)D levels in the control group to be 0.7 nmol/l [31]. In contrast to those results, the immunoassay Roche Cobas e601 assay was used for analysis of 25(OH)D in CSF in a second publication from 2013. This method reported much higher values of 25(OH)D in CSF, with a median around 12 nmol/l [32]. Even higher levels were reported in a study from 2019, where the immunoassay Cobas 8000 e602 analyzer was used. The authors reported the concentration for 25(OH)D in CSF to be 1.4-fold higher than that in the serum (median around 94 nmol/l), a result that strongly diverges from previous studies [33].
We presume that the highly divergent levels of 25(OH)D in CSF reported previously are due to the use of electrochemiluminescence binding assays, which might not be suitable for the determination of 25-OHD in CSF [30]. That method is based upon the interaction of 25(OH)D with DBP, which is only present at trace amounts in CSF [34]. We suggest that direct chemical determinations, such as LC-MS/MS, or immunoassays that base their principle on antibodies against 25(OH)D, should be used for more accurate detection of 25(OH)D in CSF.
Vitamin D in serum and CSF
Almost all participants in this study were considered to have sufficient vitamin D levels in serum. We do not have data regarding how many persons used vitamin D supplementation, but it is assumed that at least some of the persons in both patient and control group used supplementation. As Table 1 shows 25(OH)D levels in serum were 26–304 nmol/l in patients and 23–140 nmol/l in controls. However, there was no significant difference between patients and controls regarding the serum 25(OH)D levels. Even though we found no differences in the serum levels of 25(OH)D between our groups, patients with AD positive core biomarkers had lower levels of 25(OH)D in CSF compared to cognitively healthy controls. This finding is in accordance with a previous study [32] that used the immunoassay for analysis of 25(OH)D.
In the present study, there was no association between 25(OH)D in CSF and levels in serum, a result which might imply that other mechanisms of vitamin D metabolism are present in human brain than are known to date. One possibility could be increased loss of vitamin D metabolites through the BBB in AD patients, although this would be contrary to the findings of Zelzer and colleagues [30], who found increased levels of vitamin D metabolites in CSF in persons with dysfunction of the BBB. Therefore, other mechanisms for intracerebral vitamin D deficiency in AD patients might be suspected, e.g., malfunction in active transport. Vitamin D deficiency is suspected to alter the brain metabolism and induce amyloid aggregations [35].
Whether an increase in serum levels of vitamin D would have a positive effect on levels of vitamin D in CSF, and thus a positive clinical effect in this subgroup of patients, is unknown and should be explored in future studies. In 2011, the National Academy of Medicine (formerly the Institute of Medicine) defined levels of 25(OH)D above 50 nmol/l as adequate to maintain bone health [36]. There is as yet no international consensus on what the optimal level of vitamin D in serum for extra-skeletal health should be, and hence the definition of deficiency is not uniform. The use of different diagnostic assays for measuring 25(OH)D in serum can also yield significant discrepancies in results [37]. The ‘Endocrine Society Clinical Practice Guideline’ from 2011 recommended 25(OH)D of 75 nmol/l and above as sufficient vitamin D levels [38]. The results of our study do not suggest changing the current guidelines on vitamin D supplementation, but we do recommend further exploring CSF levels of 25(OH)D and evaluating whether extra vitamin D supplementation might have a positive effect on them.
We did not find support for using the calculated serum free vitamin D fraction (formula by Bikle et al. [11]) in future studies, as the levels of calculated serum free vitamin D fraction strongly correlated with total 25(OH)D in serum. However, directly measuring the free and bioavailable vitamin D fraction and comparing it to the calculated value might be of interest in future studies.
VDR SNPs and vitamin D
We did not find any significant associations between levels of 25(OH)D in CSF or CSF/serum ratio of 25(OH)D and any of the 4 VDR SNPs examined, which suggests that these VDR polymorphisms likely do not affect the metabolism of 25(OH)D in CSF. However, we did find that serum values of 25(OH)D were significantly lower in persons with the Taql minor homozygote genotype as compared to those with heterozygote and major homozygote, suggesting that this polymorphism might be a risk factor for vitamin D deficiency. There are several previous studies that have explored this association, where some have confirmed our findings [39, 40], but not all [41, 42]. Therefore, we suggest that this association needs to be confirmed in larger studies, as it might have an impact on clinical practice in preventing vitamin D deficiency in certain patient groups based on genetic risk factors.
VDR SNPs and cognitive tests
It has been suggested that genetic polymorphisms of the VDR gene may lead to altered gene expression [43] or stability of mRNA [44] and thus negatively influence cognitive function. Both TaqI and BsmI major homozygote genotypes have previously been found to be possible risk genotypes for development of cognitive decline [45–47], and our findings support this hypothesis. In the present study, we found a significant association between the major homozygote genotype for both TaqI and BsmI and worse performance on the COWA FAS, a test that evaluates verbal fluency, a cognitive function that facilitates information retrieval from memory. For the BsmI major homozygote genotype, there was also a significant association with worse performance on the CERAD 10-word delayed recall test, which examines verbal memory and hippocampal function. Similar findings were reported by another research group [48].
Since it is not clear by which mechanism these polymorphisms might affect specific cognitive functions, it is particularly intriguing that the aforementioned tests are both related to prefrontal and hippocampal function. This observation is in line with the distribution of VDR in the brain, where it is mostly localized in the interneurons of the prefrontal cortex, the hippocampal structures and basal ganglia [49].
Variations in the VDR genes, and hence differences in vitamin D metabolism in the brain, have been suggested as a possible explanation for some of the conflicting results seen in the previous studies regarding vitamin D and cognitive function [50–53]. We did not find any associations between ApaI polymorphism and the cognitive tests used in the present study, in contrast to the findings from a large Norwegian cross-sectional and prospective study where ApaI polymorphism was found to be associated with word recall and digit–symbol coding tests [54]. It is to be noted that the smaller number of participants with valid results for the ApaI SNP in the present study might have weakened our statistical power and affected the results.
Haplotypes were not analyzed in present study. A future larger study may wish to examine haplotypes in addition to the individual SNPs.
Vitamin D and APOE genotypes
Previous studies have found an association be-tween APOE ɛ4 genotype and higher vitamin D levels [35, 56], hypothesizing that the allele protects against vitamin D deficiency. It is also suggested that vitamin D deficiency presents a greater risk for brain disease in APOE ɛ4 non-carriers [57]. We could not, however, confirm those findings in the present study.
The study’s strengths and limitations
A strength of the present study is the larger number of participants with CSF analysis of 25(OH)D than included in similar previous studies, which might yield better statistical power. In addition, our study includes a cognitively healthy control group, in contrast to most previous similar studies. We also consider using the LC-MS/MS method for analyzing 25(OH)D in both serum and CSF a study strength, as it is the only method validated to measure 25(OH)D in CSF. In the genetic analysis, all models were adjusted for APOE polymorphism in addition to covariates identified as potential confounders for both cognitive symptoms and vitamin D metabolism. Furthermore, the biological samples were collected and analyzed simultaneously.
As for the limitations of the study, the number of the participants is lower than in similar studies of genetic analysis of VDR SNPs, which might have weakened the statistical power. The data on BMI were incomplete in our material and therefore we chose to exclude this variable. In addition, information on vitamin D supplementation in the study population was deficient. Even though other potentially confounding variables identified in previous studies were corrected for, residual confounding cannot be ruled out.
Conclusion
This study indicates that persons with cognitive impairment with positive AD core biomarkers have lower levels of 25(OH)D in CSF compared to cognitively healthy controls, despite having normal 25(OH)D serum levels. The four most common VDR gene polymorphisms did not appear to be associated with metabolism of 25(OH)D in CSF in this Norwegian population. Whether the Taql minor homozygote allele is a risk factor for low serum levels of 25(OH)D, and weather Taql and Bsml major homozygote genotypes might be possible risk genotypes for the development of cognitive decline, needs further investigation. We recommend further exploration of the role of vitamin D in human brain, preferably through CSF studies, particularly by investigating the interaction of 25(OH)D and inflammation processes in persons with AD pathology. Future intervention studies should evaluate if extra vitamin D supplementation has a positive effect on 25(OH)D levels in CSF and on clinical outcomes in AD patients.
Footnotes
ACKNOWLEDGMENTS
This study was funded by Lovisenberg Diaconal Hospital. The authors would like to thank the anesthesiologists, orthopedic surgeons, and nurses at Lovisenberg Diaconal Hospital, as well as bioengineers at the Unger Vetlesens Institute for their help with data collection and excellent cooperation on this project. We would also like to thank the Norwegian register of persons assessed for cognitive symptoms (NorCog) for providing access to patient and caregiver data and biological material.
