
Abstract
Background:
Affecting nearly half of the patients with Alzheimer’s disease (AD), apathy is associated with higher morbidity and reduced quality of life. Basal ganglia and cortical atrophy have been implicated in apathy. However, the findings have varied across studies and left unclear whether subdomains of apathy may involve distinct neuroanatomical correlates.
Objective:
To identify neuroanatomical correlates of AD-associated apathy.
Methods:
We performed a meta-analysis and label-based review of the literature. Further, following published routines of voxel-based morphometry, we aimed to confirm the findings in an independent cohort of 19 patients with AD/mild cognitive impairment and 25 healthy controls assessed with the Apathy Evaluation Scale.
Results:
Meta-analysis of 167 AD and 56 healthy controls showed convergence toward smaller basal ganglia gray matter volume (GMV) in apathy. Label-based review showed anterior cingulate, putamen, insula, inferior frontal gyrus (IFG) and middle temporal gyrus (MTG) atrophy in AD apathy. In the independent cohort, with small-volume-correction, right putamen and MTG showed GMVs in negative correlation with Apathy Evaluation Scale total, behavioral, and emotional scores, and right IFG with emotional score (p < 0.05 family-wise error (FWE)-corrected), controlling for age, education, intracranial volume, and depression. With the Mini-Mental State Examination scores included as an additional covariate, the correlation of right putamen GMV with behavioral and emotional score, right MTG GMV with total and emotional score, and right IFG GMV with emotional score were significant.
Conclusion:
The findings implicate putamen, MTG and IFG atrophy in AD associated apathy, potentially independent of cognitive impairment and depression, and suggest potentially distinct volumetric correlates of apathy.
Keywords
INTRODUCTION
AD neuropathology and apathy
Affecting 30–70% of patients with Alzheimer’s disease (AD) [1–3], apathy or reduced goal-directed activity is associated with more severe cognitive decline, higher morbidity, and reduced quality of life [1]. In individuals with mild cognitive impairment (MCI), apathy is associated with higher risk of dementia [4]. Positron emission tomography imaging associated AD apathy with hypoperfusion [5] and amyloid/tau pathology [6–8] of the prefrontal cortex (PFC), including the orbitofrontal cortex (OFC) and anterior cingulate cortex (ACC).
Earlier studies have implicated meso-cortico-limbic and nigrostriatal dopaminergic dysfunction in AD apathy [9–12]. However, mounting evidence from anatomical, physiological, and behavioral studies has identified key roles of parallel, cortical-basal ganglia (BG) circuits in motivated behavior [3, 13]. Severe motivational and emotional dysregulation are noted in association with PFC damage [14, 15]. In AD, the degeneration of sub-regions of the dorsolateral, orbital-ventromedial, and dorsomedial PFC may better explain the common occurrence of apathy syndromes [3, 15]. These PFC regions are targets of the noradrenergic circuits, which are known to support motivation, effort and goal-directed behavior and have also been implicated in AD apathy [3, 16–19]. Thus, AD apathy may follow pathological changes in brain regions that extend beyond the dopaminergic circuits.
Cerebral volumetric correlates of apathy in AD and related dementia
Studies have employed morphometric magnetic resonance imaging (MRI) to examine the structural bases of apathy. AD patients with relative to those without apathy showed lower cingulate and insular gray matter volumes (GMVs) [20, 21] and higher cerebellar and lingual gyral GMVs [21]. The latter study also observed lower GMV of the middle frontal gyrus in AD patients with reduction in initiatives compared to those without, and lower insula/parahippocampus GMVs in AD patients with emotional blunting [21]. However, another study noted no such correlation in AD, but a negative correlation between anterior temporal lobe and OFC GMV with emotional blunting in a pooled sample of AD and behavioral variant of frontotemporal dementia (bvFTD) [22]. More studies have assessed GMV correlates of apathy in pooled samples of AD and elderly healthy participants and showed divergent findings, including lower GMVs in the middle/superior frontal gyrus, superior temporal sulcus, cerebellum, precentral gyrus [23], ventromedial/ventrolateral PFC, posterior cingulate cortex [24], insular cortex [25], and middle temporal/hippocampus [23, 26] in association with the severity of apathy. A few others reported null findings. For instance, a study observed no association between frontal, temporal, parietal, and occipital cortical gray matter atrophy with apathy in AD [27]. In a population of patients with amnesic MCI with 32% eventually converting to AD, no regional GMV correlates of apathy were evident [28]. Another study of advanced AD likewise reported no GMV correlates of apathy [29].
Very few studies delineated GMV correlates of the subcomponents of apathy. As per the multidimen-sional model, affective/emotional (reduced empathy), executive/cognitive (impaired planning), and initiation/behavioral (inactivity or lethargy) apathy possibly follow distinct neuropathology [9]. Wei and colleagues noted executive and initiation apathy during both early and late stages and emotional apathy only during late stages of AD [2]. Pooling samples of AD, bvFTD, other forms of dementia, and healthy participants in the analyses, studies have reported lower insula and PFC GMVs in emotional, BG and PFC GMVs in initiation, and PFC, temporal and posterior cingulate cortical GMV in executive apathy [2, 30].
Together, the literature suggests less than consistent findings in the neuroanatomical correlates of AD apathy. A number of factors may potentially contribute to the varied findings, including AD-associated comorbidities, with depression likely being the most important. Depression and apathy overlap in the clinical manifestations of AD. Studies showed depression to be almost always comorbid with apathy while apathy may be present alone without depression [2, 31], suggesting potentially distinct etiology of apathy [32]. More severe frontal lobe dysfunction was noted in AD patients with both apathy and depression than those with apathy or depression alone [33]. A recent review of the cerebral structural basis of neuropsychiatric symptoms of AD highlighted the roles of OFC/ACC thalamic striatal circuits in the pathophysiology of apathy and of the fronto-limbic circuits in depression [34]. Additionally, clinical heterogeneity arising from mixed study populations, differences in the severity of AD, and different methods of assessment and of analyses may all account for the disparity in findings. There is a need for systematic review and meta-analysis of the findings.
The present study
The current study aimed to identify the volumetric correlates of AD apathy. To the best of our knowledge, no meta-analysis of the neural correlates of AD apathy is available to date, likely because only a small number of studies have focused exclusively on AD patients and the great majority of studies employed solely region-of-interest (ROI) analysis. An earlier meta-analysis reported lower GMV of the left inferior frontal gyrus and left BG, including the caudate and putamen, in Parkinson’s disease, AD, and FTD, although analysis of AD patients alone was not attempted [35].
We first conducted a meta-analysis on the GMV correlates of apathy across dementias, including only those studies with an AD population. Second, although meta-analysis has advantages over label-based review [36], it is limited to studies of whole-brain analyses which typically included multiple forms of dementia. Thus, in addition to meta-analysis, we conducted a label-based review of studies specifically on AD. Finally, to confirm the findings of meta-analysis and label-based review, we investigated GMV correlates of apathy in a cross-sectional study of an independent cohort. We performed ROI analyses, accounted for the influence of depression and cognitive ability, and examined the potentially distinct correlates of subdomains of apathy. On the bases of the literature, we hypothesized that gray matter volumetric alterations in the regions of cortico-basal ganglia circuit, especially the PFC and BG, may be associated with the pathophysiology of apathy.
METHODS
Meta-analysis of GMV correlates of apathy in AD and related dementia
Activation likelihood estimation (ALE) meta-ana-lysis [37–40] was performed using GingerALE 3.0.2 (http://www.brainmap.org/ale/). ALE algorithm uses peak coordinates (foci) reported in neuroimaging studies as inputs and evaluates the convergence between these foci, controlling for sample size, modelled as a probability distribution of finding at a given coordinate against null-distributions of random spatial associations between studies [39].
Literature search and study selection
Following the guidelines detailed in ‘Preferred Reporting Items for Systematic Reviews and Meta-analysis (PRISMA) [41] (Supplementary Table 1), we searched PubMed (https://pubmed.ncbi.nlm.nih.gov/) for MRI-based volumetric AD-apathy studies with the key words (“Alzheimer’s” OR “Alzheimer’s Disease” OR “AD”) AND (“apathy”) AND (“MRI” OR “magnetic resonance imaging” OR “VBM” OR “morphometry” OR “volume” OR “gray matter” OR “grey matter”). The search yielded 109 entries as of April 16, 2021, of which 17 met the inclusion criteria: study population including patients with AD, apathy assessment, whole-brain MR imaging, evaluation of GMV, and report of peak-coordinates in standard stereotactic space. Studies assessing cortical thickness or other morphological features were excluded. We also searched on Google Scholar (https://scholar.google.com/) and PsyNet (https://psycnet.apa.org/) using the same key words. The search yielded no new studies. Among the 17 studies, the 14 studies that assessed GMV correlates of apathy with linear regressions were included, while the three [20, 42] evaluating GMV differences between AD patients with and without apathy were excluded. Eight of the 14 studies used ROI analysis, which violated the assumption of ALE algorithm that each voxel in the entire brain has equal chance of being activated/showing correlation [43]. One study did not report the coordinates of the findings. Thus, the final sample included a total of 5 studies (Fig. 1; Supplementary Table 2). Details of the 12 excluded studies are shown in Supplementary Table 3. Peak-coordinates (activation foci) with significant apathy-GMV correlation were extracted for meta-analysis. We did not approach the authors for additional data and those presented by authors in publication were used throughout the analysis. Literature search and study selection were independently performed by the authors SC and SZ and verified by other authors.
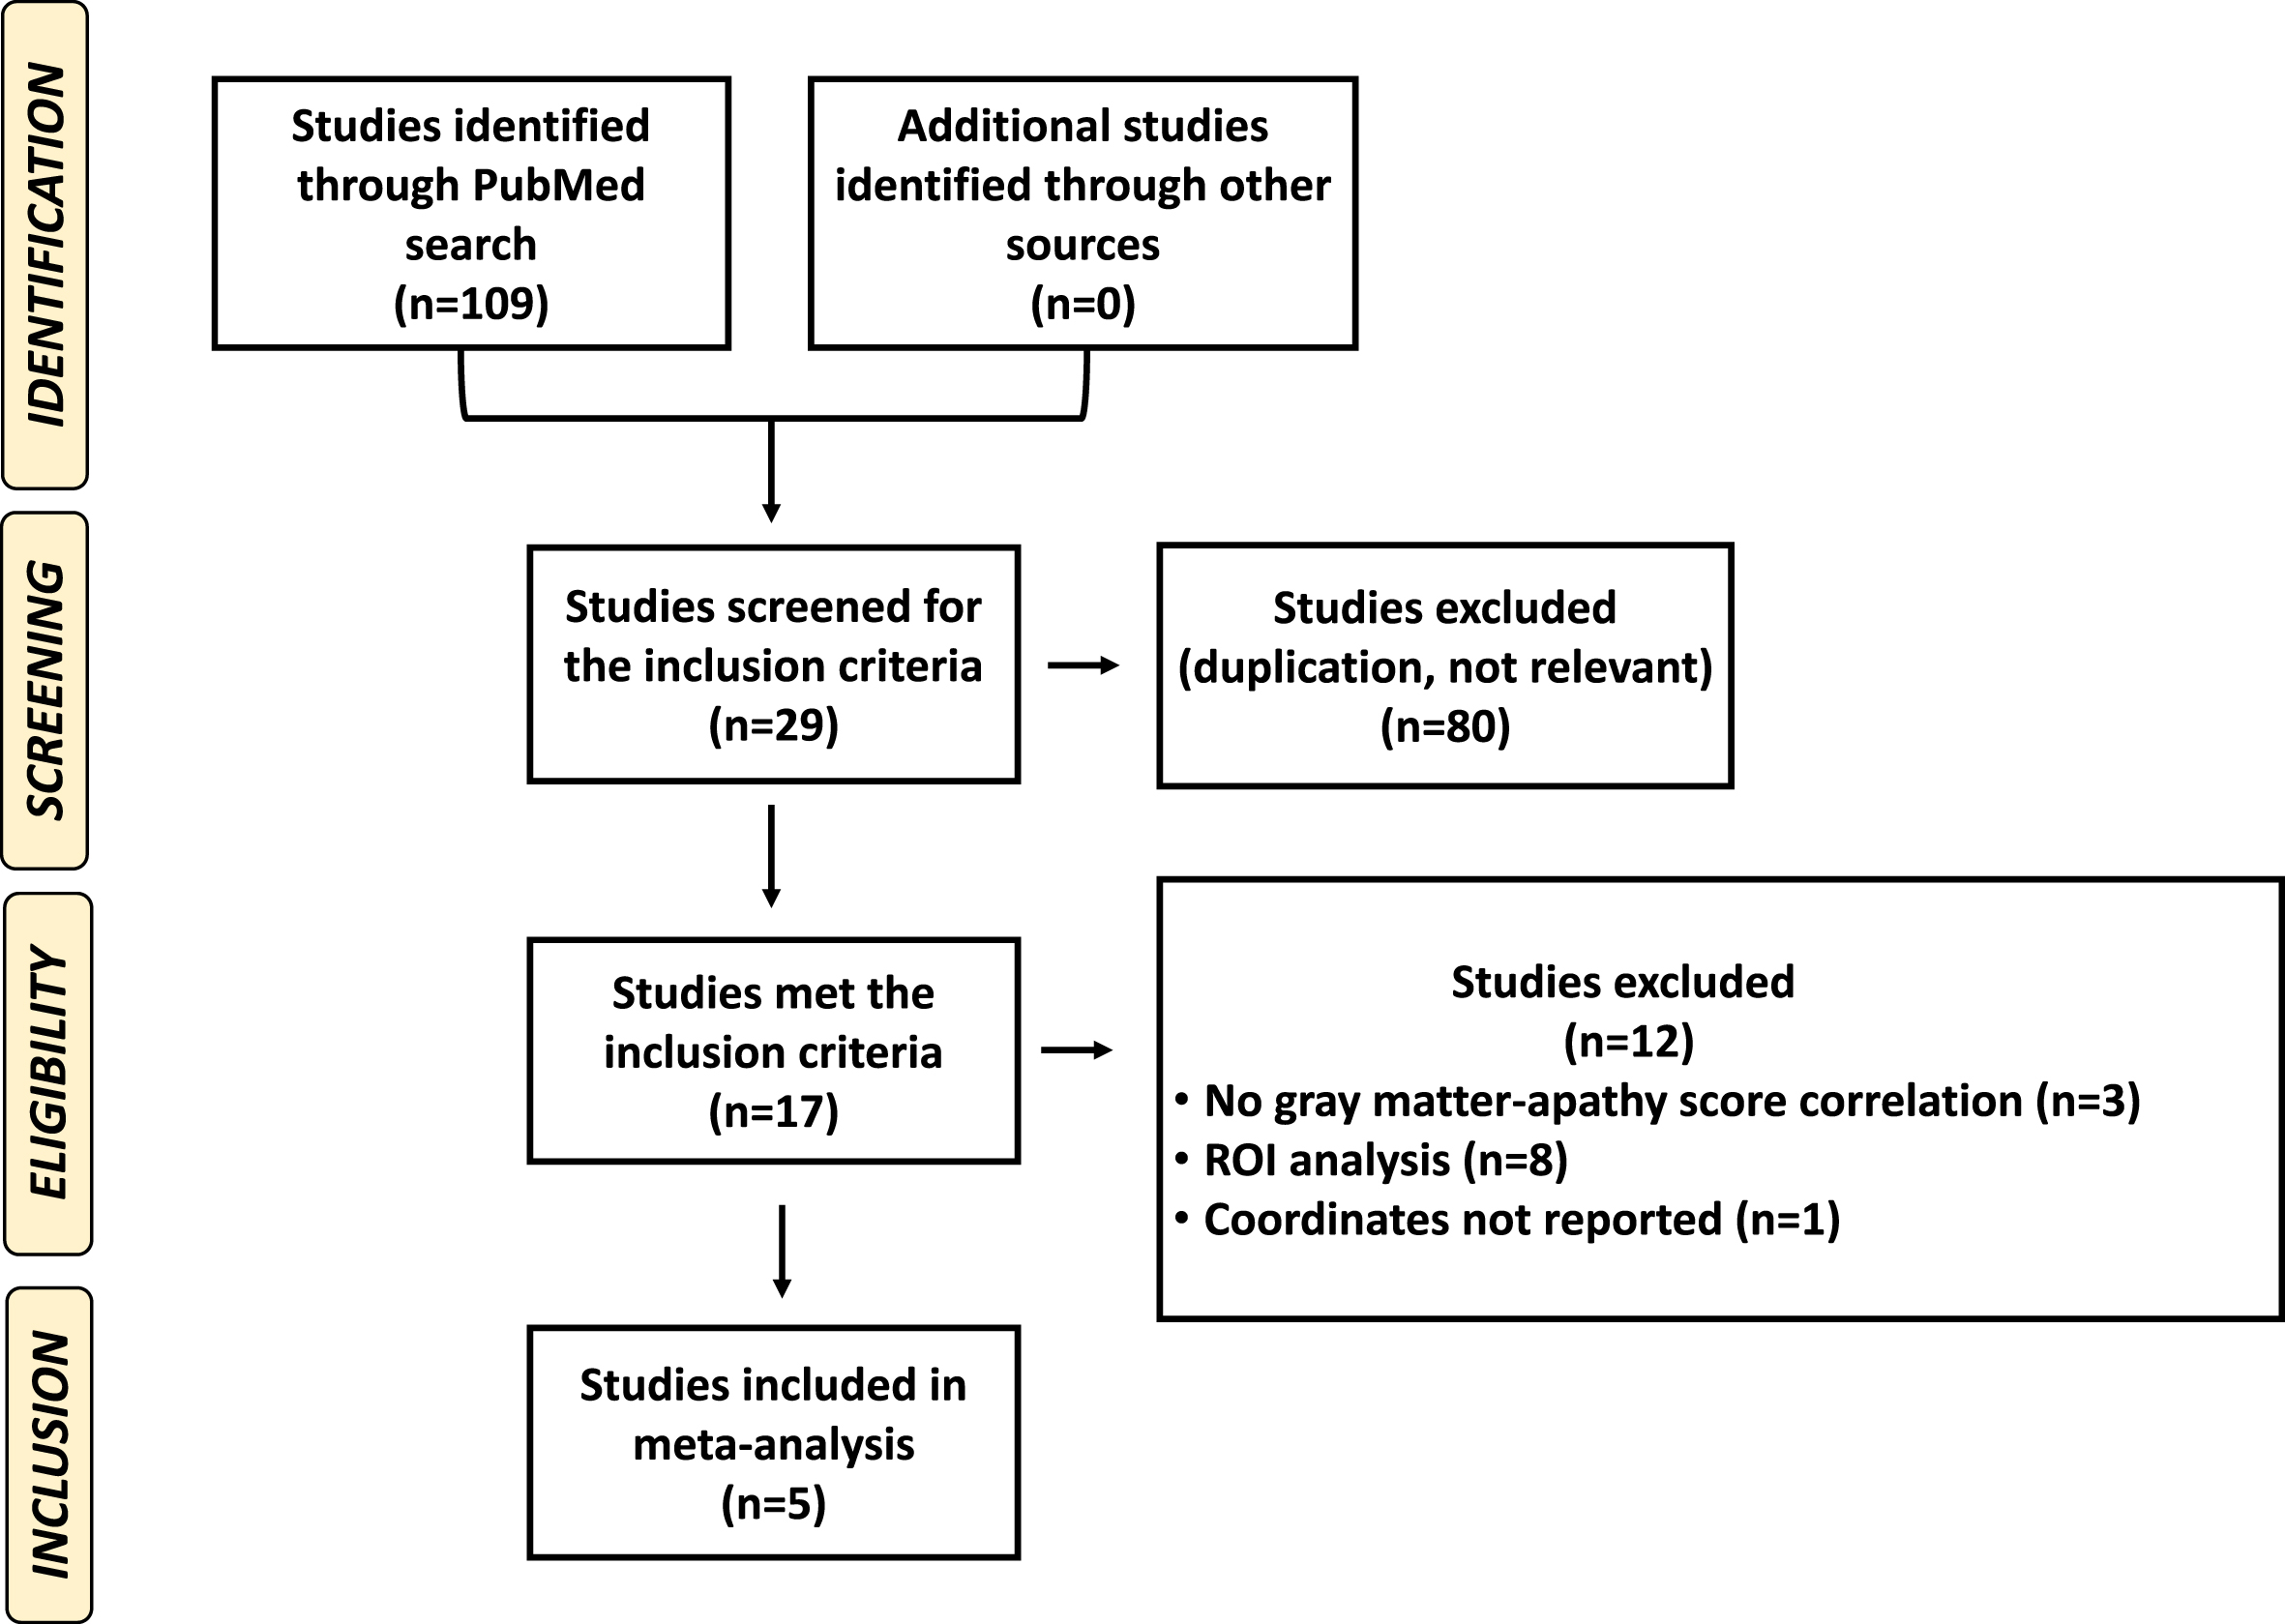
A flow-chart for the procedure to arrive at the final sample for meta-analysis, following ‘Preferred reporting items for systematic reviews and meta- analyses (PRISMA).’
Quality assessment
Study quality was assessed using a 10-point check-list (Supplementary Table 4) via an objective description of individual studies on demographics and clinical characteristics (Supplementary Table 2) and imaging methods (Supplementary Table 5), as with earlier meta-analyses [44, 45]. The selected studies were all of sufficient quality with scores ≥9.
Meta-analysis
Activation foci from the 5 studies (20 foci; 281 participants) were included in ALE analysis. The analyses were carried out in MNI space using non-additive algorithm to prevent closely spaced multiple small clusters of a single study from dominating the results [38]. To achieve a balance between sensitivity and specificity, cluster-level inference was made using cluster-forming threshold of voxel-level p < 0.005, uncorrected and the resulting supra-threshold clusters were compared to a null distribution of cluster sizes established by 1000 permutations of the data, at an FWE-corrected threshold of p < 0.05 [46]. The resulting ALE map was visualized using Mango software with Colin brain template in Montreal Neurological Institute (MNI) space [47].
Publication bias and heterogeneity
To evaluate potential publication bias, “Fail-Safe N” analysis adapted for ALE meta-analysis was conducted [48]. Briefly, we used R program to generate “noise” studies from the list of foci, sample size, and the distribution of sample sizes, as in the five studies included in meta-analysis [49]. Meta-analysis was repeated with the same thresholds but with a number of noise added to the original studies. A significant ALE finding would reflect robustness of the findings against missing studies in meta-analysis [49].
For ALE-based analyses, one determines potential sources of heterogeneity in the meta-analysis and perform a number of post-hoc tests on relatively homogeneous sample of reduced number of studies. The difference in findings between the original and post-hoc analyses represents an indirect measure of heterogeneity in the original sample [48]. Here, we would have determined mixed dementia population as a potential source of heterogeneity. However, we could not perform such post-hoc analyses due to a small number of homogeneous studies (n = 2, AD-only studies per inclusion criteria).
Label-based review of GMV correlates of apathy in AD
The meta-analysis included studies of dementia other than AD. Thus, we performed a label-based review and summarized the frequency of regional volumetric correlates of apathy specific to AD, with sample-size weighting (see also Supplementary Methods) [36, 50]. A total of six studies specifically investigated apathy-GMV correlates in AD and were included in this review (Supplementary Figure 1 and Supplementary Table 6). The six studies included a sample size ranging from 31 to 59 and both whole-brain and ROI analyses with varying statistical thresholds. Study quality assessment followed the methods as described for meta-analysis earlier. The selected studies were all of sufficient quality with scores > 9 (Supplementary Tables 6 and 7). Altogether, with hemisphericity considered, 15 regions (labels) were reported across studies, with some regions reported in more than one study, resulting in a total of 30 study-regions. The frequency (the number of times a region was reported) of each region was calculated with sample size weighting. The findings are presented in a frequency plot with the percentage calculated on the basis of the total number of reported study-regions (i.e., 30).
A clinical study to confirm the findings of meta-analysis and label-based review
Participants and assessments
Nineteen participants with AD (n = 15)/MCI (n = 4) and 25 control (HC) participants, matched in age and sex composition (Table 1) were recruited from Yale Alzheimer’s Disease Research Center and the greater New Haven area. Participants with AD met the criteria for probable dementia because of AD according to the National Institute of Aging-Alzheimer’s Association [51]: Clinical Dementia Rating (CDR) score of 0.5 to 1.0; Mini-Mental State Examination (MMSE) score of 16 to 26 (inclusive); impaired episodic memory as evidenced by a Logical Memory II (LMII, Delayed Paragraph Recall) score of 1.5 SDs less than an education-adjusted norm: ≤8 for 16 or more years of education; ≤4 for 8–15 years of education; ≤2 for 0–7 years of education. Amyloid pathology was confirmed by positron emission tomography imaging in 13 of the 15 AD participants [52]. Participants with MCI met the criteria for amnestic MCI [53]: CDR score of 0.5; MMSE score of 24 to 30 (inclusive); impaired episodic memory as evidenced by LMII Delayed Paragraph Recall score of 1.5 SDs less than an education-adjusted norm (as mentioned for AD). HC participants had a CDR score of 0, MMSE score > 26, and normal education-adjusted LMII score. The exclusion criteria for all participants included current or history of diagnosis of psychotic or substance (except nicotine) use disorders or current diagnosis of major depressive disorder according to DSM-5 criteria; severe depression (total score ≥29) as assessed the Beck Depression Inventory-II (BDI-II); current use of any psychoactive drugs including anxiolytics and antidepressants; significant current medical condition including other neurological, cardiovascular, endocrine, renal, hepatic or thyroid pathology; history of brain injury with loss of consciousness or of a cerebrovascular event including transient ischemic attack; MRI contraindications; pregnant or nursing women. Written informed consent was obtained prior to the study in accordance to institutional guidelines and a protocol approved by the Yale Human Investigation Committee.
Demographic and clinical characteristics of HC and AD/MCI participants in the independent cohort
*p < 0.05; atwo-sample t-test; bchi-square test, ctwo-sample Wilcoxon rank-sum (Mann-Whitney) test. TIV, total intracranial volume; MMSE, Mini-Mental State Examination; BDI, Beck Depression Inventory; AES, Apathy Evaluation Scale.
All participants completed self-rated Apathy Evaluation Scale (AES-S) [54], a questionnaire of 18 items to assess behavioral (five items), cognitive (eight items), emotional (two items), and the other (three items) aspects of apathy. The items are scored on 4-point Likert scale and the score ranges from 18 to 72 points with a higher score indicating more severe apathy [55, 56]. Participants were also assessed with BDI-II [57], a self-reported measure of depression that consists of 21 items with each item referencing to a symptom (e.g., sadness) and related responses (generally four to six evaluative statements in the order of increasing severity) to reflect symptom severity over the past 2 weeks. The total BDI-II score ranges from 0 to 63, with higher score indicating greater severity of depression [58].
Imaging protocol and data analyses
Participants were scanned on a Siemens 3-Tesla scanner (Trio; Siemens AG, Erlangen, Germany). Data for each participant consisted of a single high-resolution T1-weighted gradient-echo scan: 176 slices; 1 mm3 isotropic voxels; field of view = 256×256 mm; data acquisition matrix = 256×256; TR =2530 ms; TE = 3.66 ms; bandwidth = 181 Hz/pixel; flip angle = 7.
The raw 3D T1 images underwent a manual quality check and were reoriented to set the origin close to anterior commissure. Further analysis was done using Computational Anatomy Toolbox (CAT version 12) package in Statistical Parametric Mapping or SPM12 [59].
The reoriented T1-images underwent spatial-adaptive non-local means denoising to remove noise while maintaining the edges followed by resampling to accommodate anisotropic spatial resolution or low-resolution images [60]. The images were then bias corrected followed by affine registration, standard unified segmentation, and skull-stripping. The brain was then parcellated into right/left hemisphere, subcortical areas, and cerebellum. Further, local adaptive segmentation transformed the local intensity of all tissue classes to correct local intensity variations (under and over estimations). These intensity corrected images were segmented into gray matter (GM), white matter, and cerebrospinal fluid using an adaptive maximum a-posteriori (AMAP) algorithm, which performs segmentation based on an adaptive estimation that models local variations of the parameters (mean/variance) as slowly varying spatial functions and accounts for local intensity variations and inhomogeneities [61]. AMAP segmentation was refined by applying a partial volume estimation that effectively estimates fraction of each pure tissue type in each voxel [62]. The segmented and initially registered tissue class maps were normalized to MNI space using template derived from 555 healthy subjects of the IXI-database using the Geodesic Shooting (Large Deformation Diffeomorphic Metric Mapping) normalization procedure [63]. Normalized GM maps were modulated to obtain absolute volume of GM, corrected for individual brain size. The modulated GM maps were smoothed using a kernel size of FWHM = 8 mm.
Because we aimed to validate the findings of meta-analyses and label-based review, we evaluated the regions identified from meta-analyses and label-based review with small volume correction (SVC) in an ROI analysis at voxel p < 0.05 corrected for FWE in whole-brain regressions against AES scores, with the total intracranial volume (TIV) as a covariate. We extracted the GMVs of significant clusters, tested the correlations with AES scores in additional models with age, years of education, BDI-II and MMSE scores as covariates, and plotted the partial correlations for visualization.
Additional analyses: GMV differences between AD/MCI and HC
Other than the ROI analysis, we also employed a two-sample t test to compare HC and AD/MCI in GMVs, with TIV and other clinical variables as covariates. We evaluated the results at voxel p < 0.001 uncorrected in combination with cluster p < 0.05 corrected for FWE. Voxels peaks were identified with MNI coordinates.
RESULTS
Meta-analysis
The meta-analysis showed that a single cluster located in the left-hemispheric caudate and putamen GMVs was significantly and negatively correlated with the severity of apathy in AD and associated dementia (Fig. 2). The cluster comprised three peaks: putamen (two peaks: x1 = –14, y1 = 14, z1 = –8; voxel Z1 = 4.64; x2 = –26, y2 = 16, z2 = –10; voxel Z2 = 4.05), and caudate (x = –16, y = 22, z = 0; voxel Z = 3.61).

ALE map for GMV correlates of apathy in AD and associated dementia with cross-hair pointing to (A) left putamen (–14, 14, –8), (B) left putamen (–26, 16, –10), and (C) left caudate (–16, 22, 0), in a single cluster, at cluster-level p < 0.05 FWE corrected, with a cluster-forming threshold of voxel p < 0.005, uncorrected. The color bar shows ALE-values. Neurological orientation: L, Left; R, Right.
Three [2, 64] out of 5 studies contributed to the cluster formation. Fail-safe N analysis revealed the same results with the addition of only one noise study.
Label-based review
The analysis revealed a total of 15 regions all with sample size-weighted frequency < 10%. We set an arbitrary threshold and considered only those regions with a frequency > 6% for further analyses. Showing smaller GMV in association with apathy, these regions included bilateral putamen, left insula, right ACC, right IFG, and right MTG in AD (Fig. 3). Among them, the right ACC was reported in 3 out of the 6 studies and the other regions in ∼34% of the studies. With the reported statistics we derived and showed the effect sizes in Supplementary Table 8.
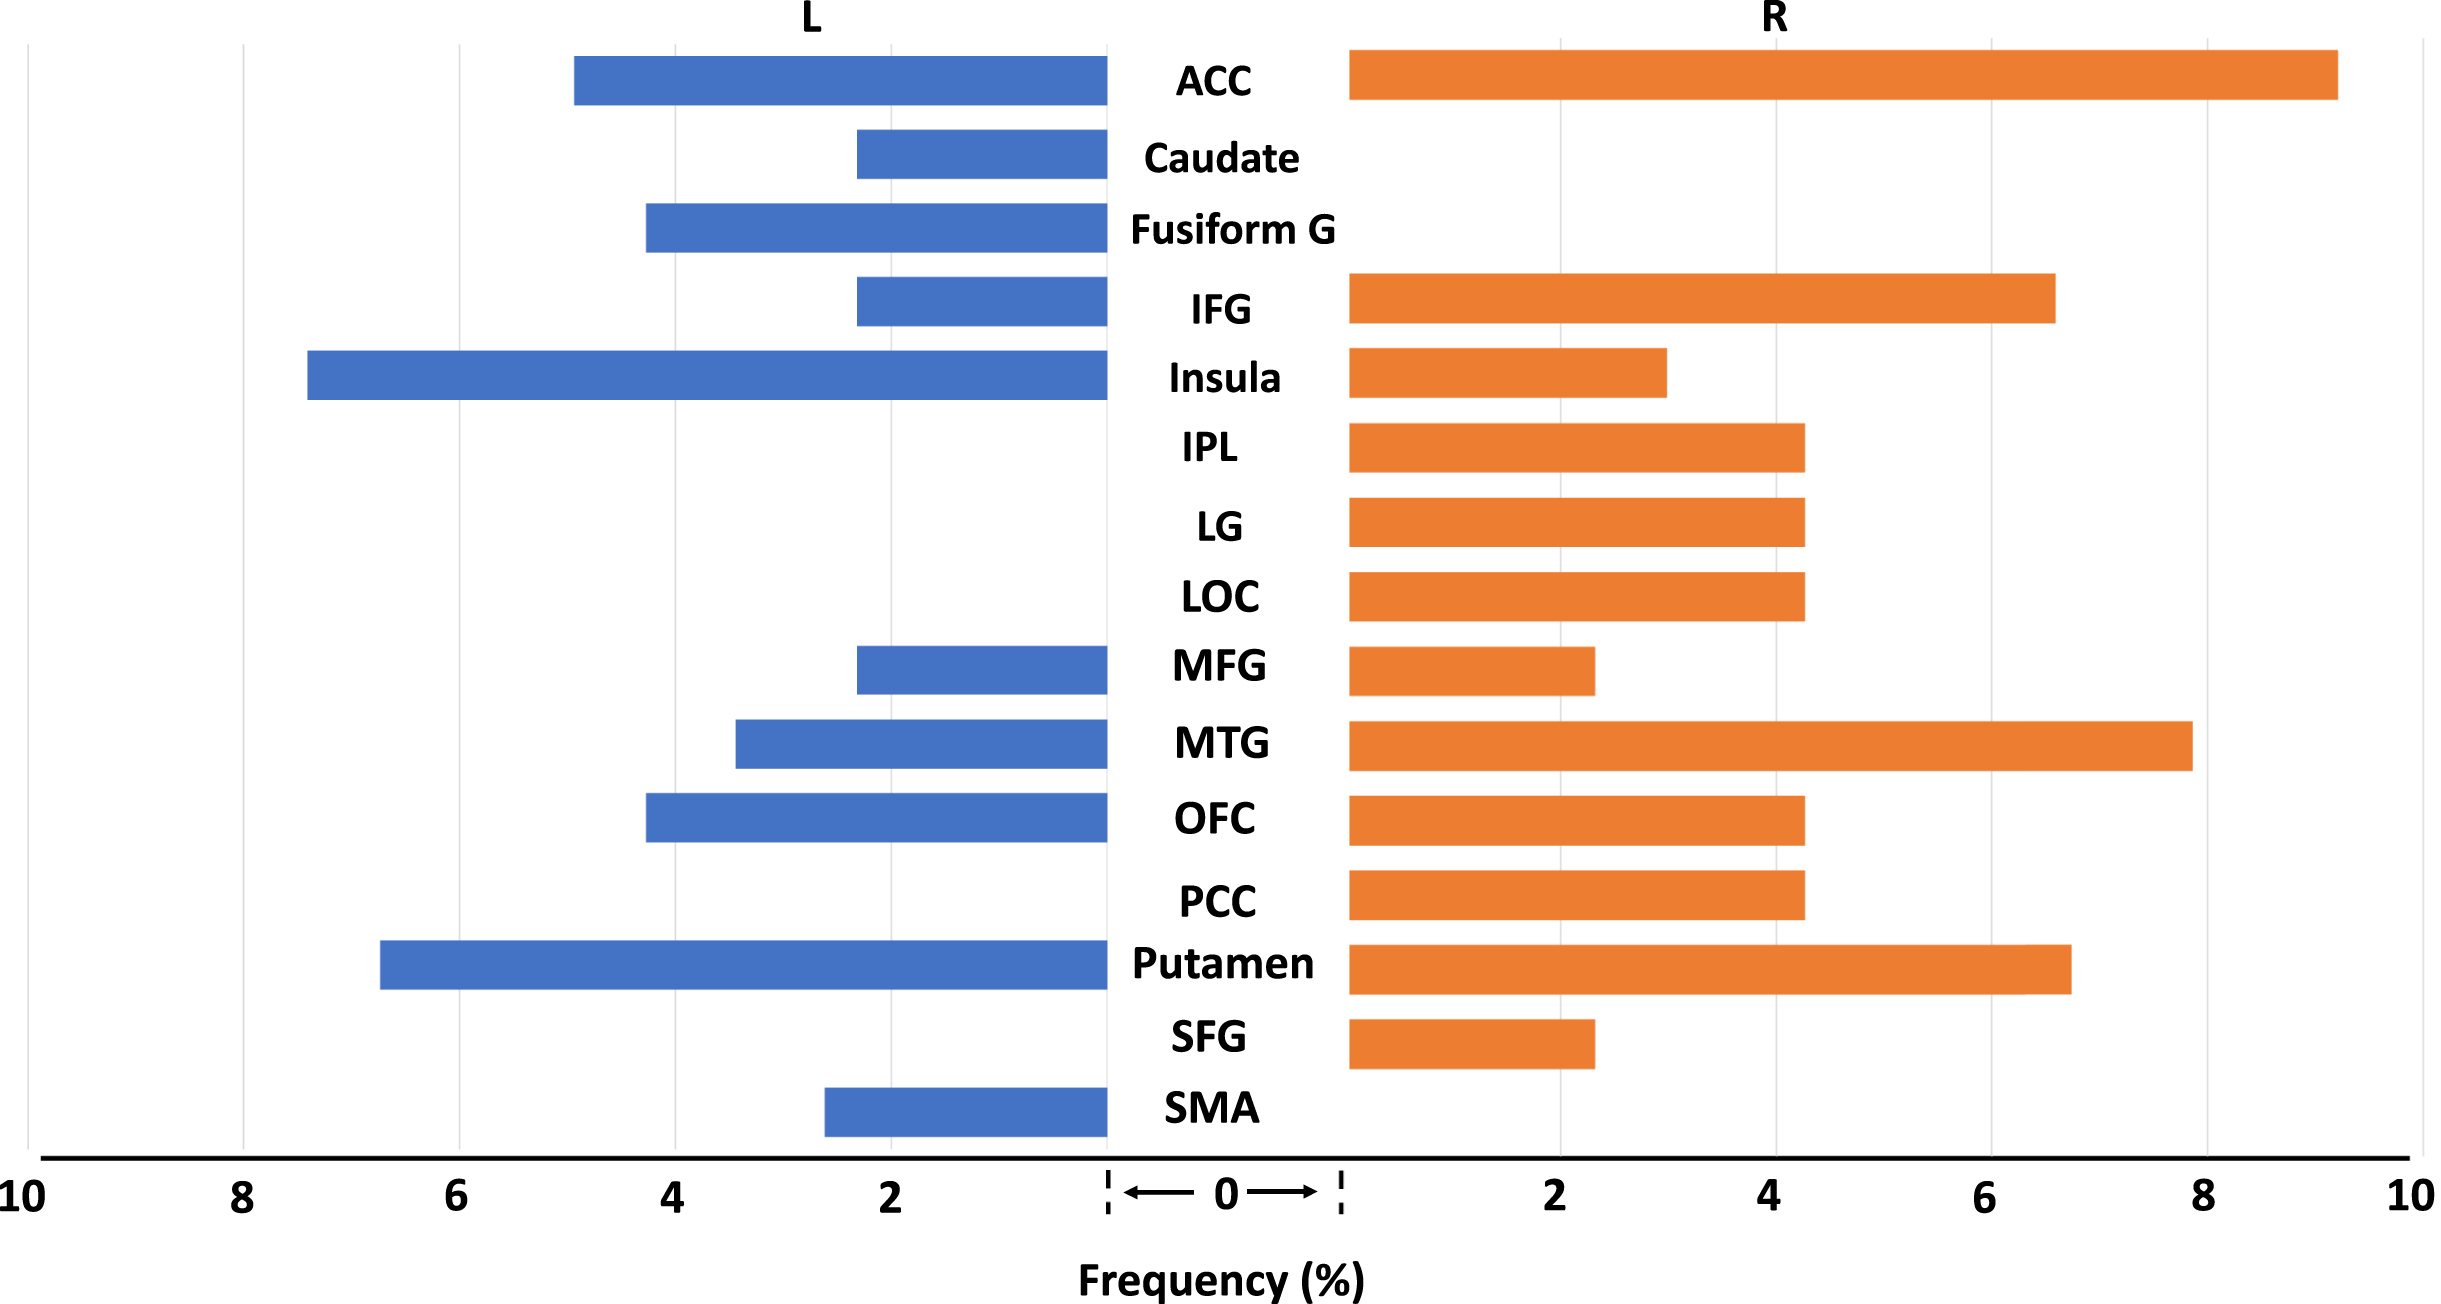
Sample size-weighted frequency (%) of regional GMV correlates of apathy in AD, as observed using label-based review. Left (L) and right (R) hemispheric regions are shown on the left and right, respectively. ACC, anterior cingulate cortex; IFG, inferior frontal gyrus; IPL, inferior parietal lobule; LG, lingual gyrus; LOC, lateral occipital cortex; MFG, middle frontal gyrus; MTG, middle temporal gyrus; OFC, orbitofrontal cortex; PCC, posterior cingulate cortex; SFG, superior frontal gyrus; SMA, supplementary motor area; G, gyrus.
Experimental findings
Clinical characteristics
HC and AD/MCI participants were comparable in age, sex composition, and TIV. HC relative to AD/MCI participants showed higher MMSE score and more years of education. AD/MCI relative to HC participants showed higher BDI-II score, AES total score, and AES cognitive and behavioral but not emotional subscore (Table 1).
Table 2 summarizes the results of Spearman’s rank-order correlation between AES scores and clinical variables. Apathy was correlated positively with BDI-II and negatively with MMSE scores but not significantly with age or with years of education. Thus, in imaging data analyses to confirm the findings from meta-analysis and label-based review, we considered BDI-II and MMSE scores too in additional regression models.
Correlation of AES apathy scores with clinical variables across all participants
ρ, Spearman’s rho, *p < 0.05. MMSE, Mini-Mental State Examination; BDI, Beck Depression Inventory; AES, Apathy Evaluation Scale.
VBM to validate the findings of meta-analysis and label-based review
Meta-analysis and label-based-review showed bilateral putamen, left caudate, right ACC, left insula, and right IFG and MTG GMV in negative correlation with the severity of apathy. Hence, in the independent study sample (HC + AD/MCI), we performed ROI analysis with these regional masks. Left putamen and left caudate masks were spheres of 5 mm radius and centered at peak coordinates as shown by meta-analysis (Fig. 2). For the regions identified from label-based review, anatomical masks were used. Right putamen, right ACC, left insula, right IFG masks were obtained from the Hammers atlas [65] and right MTG from the Neuromorphometric atlas [66].
With SVC, multiple regression controlling for TIV showed significant (p < 0.05, FWE-corrected) clusters centered at right putamen, right MTG, and right IFG (Supplementary Table 9) that remained significant in partial correlations accounting for age, years of education, TIV, and BDI scores (Supplementary Table 10). The correlation of right putamen GMV with AES behavioral (two peaks: x1 = 30, y1 = –10, z1 = –10; voxel peak Z1 = 3.53; x2 = 27, y2 = –8, z2 = –9; voxel peak Z2 = 3.43, volume = 33.75 mm3) and emotional subscore (x = 28, y = –10, z = –8; voxel peak Z = 3.16, volume = 10.13 mm3), right MTG GMV with AES total (two peaks: x1 = 56, y1 = –10, z1 = –22, voxel peak Z1 = 4.05; x2 = 57, y2 = –4, z2 = –36, voxel peak Z2 = 3.9, volume = 1644 mm3) and emotional subscore (two peaks: x1 = 58, y1 = –4, z1 = –36, voxel peak Z1 = 3.59; x2 = 54, y2 = –10, z2 = –24, voxel peak Z2 = 3.58; volume = 557 mm3), and right IFG GMV with emotional subscore (x = 44, y = 33, z = 8; voxel peak Z = 3.43, volume = 64 mm3) were significant with MMSE scores included as an additional covariate (Fig. 4, Supplementary Table 10).
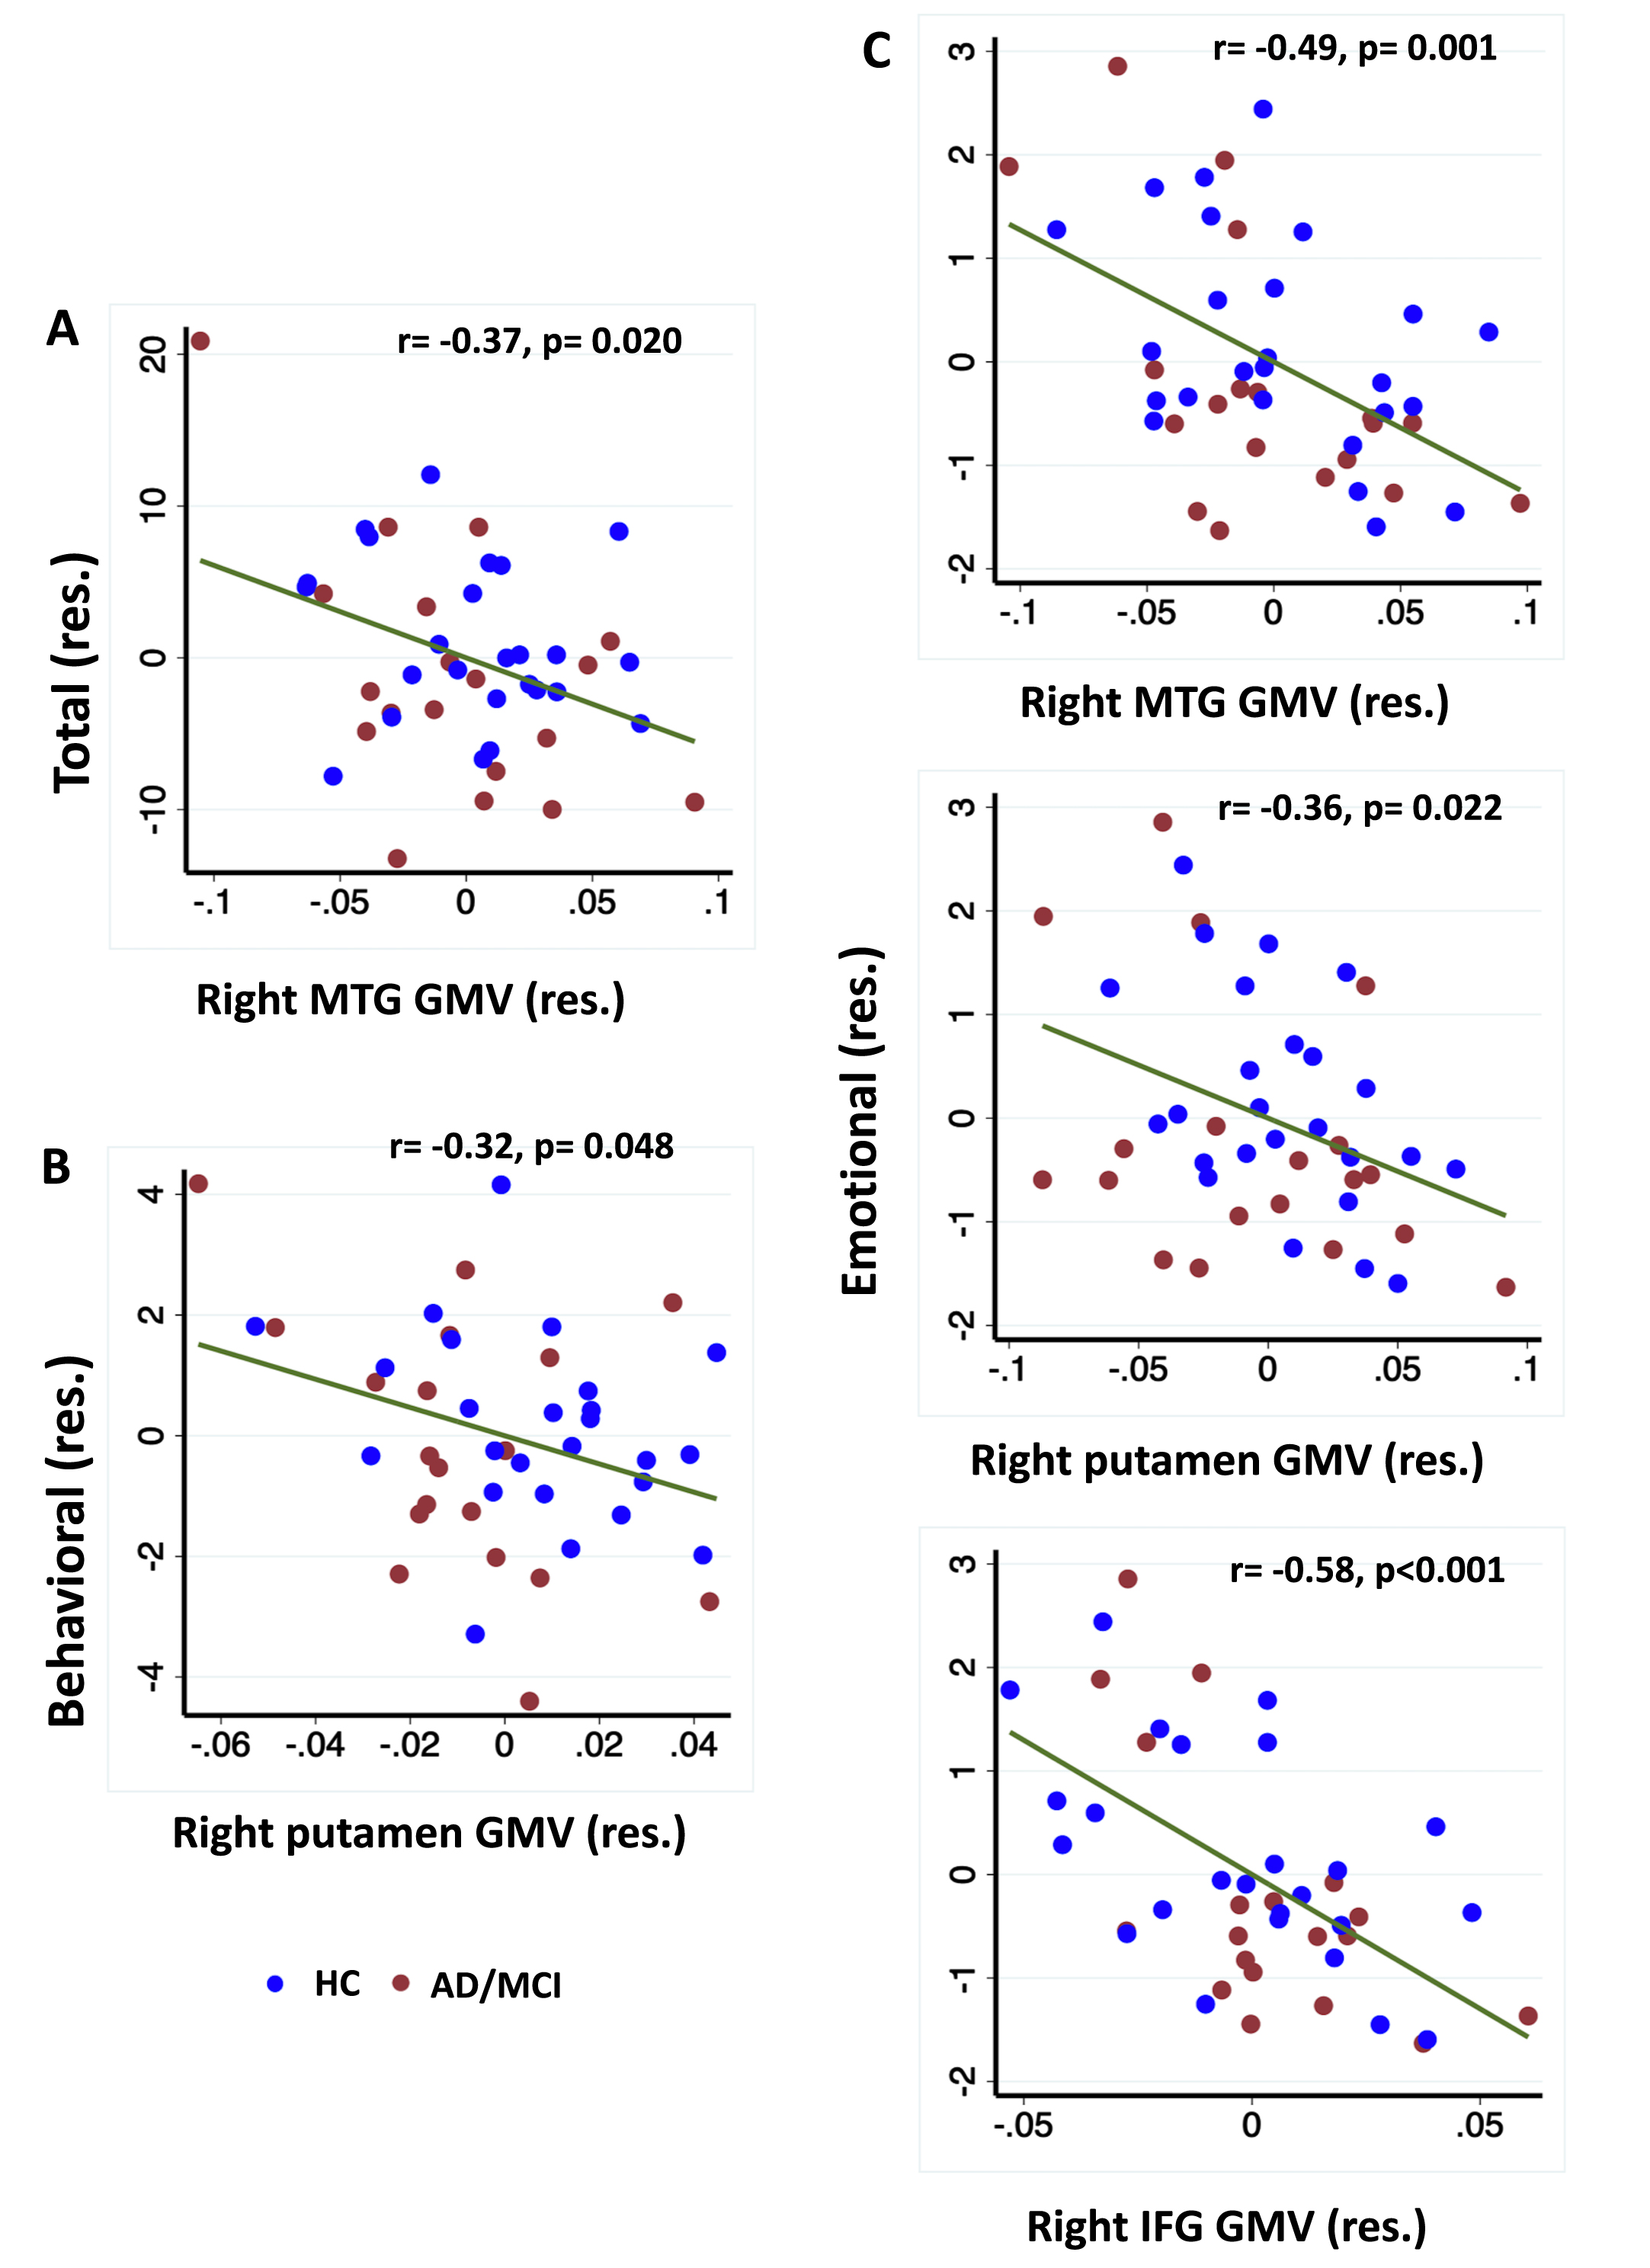
Pearson’s partial correlations of (A) AES total score with right MTG GMV, (B) behavioral subscore with right putamen, and (C) emotional subscore with right MTG, putamen, and IFG GMV. Covariates in the regressions included age, years of education, TIV, BDI-II score, and MMSE score. Note that the residuals from partial regressions, not original values, were plotted here. AES, Apathy evaluation scale; BDI, Beck depression inventory; MTG, middle temporal gyrus; IFG, inferior frontal gyrus; GMV, gray matter volume; MMSE, Mini-Mental State Examination; TIV, total intracranial volume; res., residual.
Neither right ACC nor insula nor left putamen/caudate showed significant clusters with SVC.
The analysis repeated in amyloid-β PET-confirmed AD revealed right IFG GMV in negative correlation with emotional AES that remained significant after controlling for age, years of education, and TIV scores (Supplementary Table 10). However, the correlation was not significant with BDI-II and MMSE scores included as additional covariates.
Additional VBM analyses: GMV differences between AD/MCI and HC, and apathy GMV correlates
Though not a primary aim of the study, to facilitate future meta-analysis, we conducted whole-brain analyses to compare AD/MCI and HC in GMVs with TIV, age, years of education as covariates. The results showed smaller GMVs in AD/MCI versus HC in bilateral entorhinal cortices, hippocampus, left supramarginal gyrus, and left fusiform gyrus (Supplementary Figure 2). These clusters are summarized in Supplementary Table 11. No brain regions showed smaller GMVs in HC relative to AD/MCI. Additionally, with SVC, we observed smaller right putamen (x = 20, y = 3, z = –14, Z = 4.78, volume = 456 mm3), left putamen (x = –14, y = 14, z = –8, Z = 3.76, volume = 125 mm3), and right MTG (most significant peak: x = 56, y = –26, z = –10, Z = 4.50, volume = 6139 mm3) GMV in AD/MCI versus HC.
Likewise, we examined the GMV correlates of apathy with whole-brain regressions in a combined sample of HC and AD/MCI. Evaluated at voxel p < 0.001 uncorrected in combination with cluster p < 0.05 FWE-corrected, and TIV, BDI-II, MMSE as covariates, the results revealed a negative correlation of AES total and behavioral subscore with left cerebellar vermis GMV (Supplementary Tables 12 and 13). No clusters showed GMVs in positive correlation at the same threshold. No clusters showed GMVs in positive or negative correlation with emotional or cognitive subscore at the same threshold.
DISCUSSION
Meta-analysis on GMV correlates of apathy in studies including AD participants revealed a distinct cluster in the left caudate and putamen. Label-based review of studies solely of AD patients identified right anterior cingulate, putamen, IFG and MTG, and left insula showing smaller GMVs in AD apathy. To validate these findings, we examined the apathy-GMV correlates in a cohort of 44 participants (19 AD/MCI and 25 HC) using VBM analysis. With age, years of education, TIV, BDI-II, and MMSE scores as covariates, right MTG, IFG, and putamen GMVs significantly correlated with AES emotional subscore and MTG/putamen with total and behavioral scores. Notably, both right putamen and MTG GMVs were reduced in AD/MCI relative to HC. These findings support right putamen, MTG, and IFG as volumetric markers of apathy, potentially independent of depression and cognitive impairment.
Apathy-GMV correlates: meta-analysis and label-based review
Meta-analysis and label-based review findings are in line with an earlier meta-analysis of studies including participants with AD, Parkinson’s disease, and FTD [35], and broadly in support of a role of the PFC-BG (putamen) circuit in goal-directed and motivational behavior [9–11, 68]. Additionally, the findings of meta-analysis were left-hemispheric whereas those of label-based review were bilateral or right-hemispheric. Although it has been suggested that apathy is more prevalent in patients with right than left hemispheric damage [69], apathy is reported in patients with left hemispheric dysfunction [70–72]. Another consideration is that spatial and peri-personal neglect commonly observed with right hemispheric damage may augment or mimic symptoms of apathy [73, 74].
As a key component of the affective memory systems, the MTG is likely involved in the emotional aspects of apathy [75]. However, other than the right-hemispheric MTG, IFG, and putamen which were verified in the independent cohort, the extant findings implicate a multitude of other brain regions. Indeed, lesions of ACC—a hub of the saliency and executive circuits—may cause mild to severe apathy [67]. With its connections to ACC, OFC, amygdala, and hypothalamus, the insula plays an integral role in emotional responses and awareness [76], and insula damage has been associated with apathy in patients with traumatic brain injury [77]. Thus, more studies are needed to investigate the volumetric correlates of apathy and to identify those that may be specific to AD.
GMV correlates of apathy in the independent cohort
The study cohort confirmed a significant association between right MTG, putamen, and IFG atrophy and apathy. In particular, this association remained true for emotional apathy even with depression and cognitive deficits accounted for. In the cortico-striatal circuits, the putamen is best known for cognitive motor control and stimulus-response association and seems to less directly involved in complex goal-directed contingencies [78]. On the other hand, a number of studies have specifically implicated the putamen in emotion processing [79–82], and a meta-analysis of fMRI studies in HCs revealed consistent putamen activation across different emotion tasks [83]. Other studies noted putamen atrophy in association with impaired facial emotion processing and emotional concept comprehension in a pooled sample of primary progressive aphasia and HC [84]. Further, the putamen demonstrated activation differentiating wins and losses during incentive tasks, suggesting its role in reward processing and motivated behavior [80, 85–88].
The study cohort also confirmed the association of right MTG with apathy, especially emotional apathy. Emotion perception and memory recruits the MTG [89–91] and MTG dysfunction impairs emotion processing [92–94]. Emotion processing in the MTG is possibly mediated through its connections with amygdala and hippocampal structures [95, 96]. The MTG may serve as a mediator between subcortical affective and frontal cognitive regions during emotion regulation [97]. Notably, right MTG GMV showed a significant correlation with cognitive apathy score (Supplementary Table 10). The latter finding suggests a role of the MTG in cognitive dysfunction in AD. Indeed, the middle temporal lobe is heavily connected with the hippocampus and parahippocampus in the memory circuit [98–100]. Memory dysfunction is a defining feature of AD [101] and MTG atrophy may lead to apathy in conjunction with cognitive deficits. However, it remains to be seen why right, but not left, hemispheric MTG is involved in the pathophysiology of AD apathy.
Emotional apathy was also found to be associated with lower right IFG GMV. Studies have implicated the right IFG in emotion processing and social emotion [102, 103]. A PET study showed reduced cerebral blood flow to right IFG in association with apathy in AD [15]. Here, AD with amyloid pathology showed a similar association between lower right IFG GMV and apathy.
Whole brain analysis revealed additional regional correlates, especially the cerebellum, in association with total and behavioral apathy scores. Volumetric studies on apathy and depression have implicated the cerebellum [2, 104]. Although best known for its role in motor control, investigators have long recognized the importance of cerebellum in emotion processing [105, 106]. Here, however, we observed a significant correlation of cerebellar GMV with behavioral but not emotional apathy, potentially supporting the role of cerebellum in regulating social behavior [107]. Notably, at a lower threshold of p < 0.001 uncorrected (k = 100), we observed whole-brain correlations corroborating the findings of ROI analysis (Supplementary Tables 14–17).
Depression and cognitive deficits in the manifestation of apathy
Apathy and depression may co-occur in the clinical manifestation of AD. Indeed, we observed that the severity of all subdomains of apathy were significantly associated with depression. On the other hand, the correlations between regional GMVs and apathy total score and subscores we observed of the independent cohort all remained significant after controlling for depression. In whole-brain analysis too, cerebellar vermis GMV was significantly associated with total and behavioral apathy scores after controlling for depression. These observations are in line with earlier reports of differentiable anatomical and functional correlates of apathy and depression [108–110]. Apathy and depression may be associated with distinct functional and anatomical correlates or, alternatively, regional atrophy and functional changes may differentially affect apathy and depression either in time course or in severity.
Apathy has been associated with greater cognitive decline in AD. In accord, we observed significant correlations between apathy and MMSE scores. The correlation was significant for total and behavioral but not for emotional or, surprisingly, cognitive (p = 0.07) subscore. The latter observation may suggest that specific (e.g., attention) but not global cognitive ability contributes to cognitive apathy [111, 112]. MMSE scores may also not reflect the deficits specific to cognitive apathy as characterized by the AES.
Limitations and conclusion
A number of limitations need to be considered for the study. First, in meta-analysis, we could not evaluate heterogeneity due to a small number of AD-only studies. The meta-analysis findings may be influenced by missing data and/or publication bias. Second, similar diagnostics for label-based review was not available. Third, the independent cohort study comprised a relatively small sample size that did not allow a direct comparison between apathetic and non-apathetic participants. Also on account of insignificant findings from AD/MCI cohort, possibly because of the small sample size, we conducted VBM analyses across both AD/MCI and HC, an approach used in other studies [2, 30], to increase the statistical power in detecting brain-behavior associations [84]. Fourth, we employed the AES in the current study, whereas multiple instruments may be needed to thoroughly evaluate apathy in the participants. Fifth, AD/MCI participants on psychoactive medications were excluded, which may have introduced sampling bias in the cohort. Finally, these are cross-sectional findings, and a longitudinal study would be needed to understand how cerebral atrophy may evolve along with the manifestation of apathy during the course of AD.
In light of these limitations, the current study identified putamen, IFG and MTG atrophy in emotional apathy, an association likely independent of depression and cognitive deficits. The study also revealed cerebellum as a candidate region in the pathophysiology of apathy.
Footnotes
ACKNOWLEDGMENTS
The current study is supported by NIH grants R21AG067024 (Li), R01AG072893 (Li), R01CA218502 (Chao), and P30AG066508 (van Dyck) as well as a VA Merit Award CX001301 (Chao). The NIH and VA is otherwise not responsible for the design of the study or data analyses and interpretation or in the decision to publish this review. We have no conflicts of interest in the current study.