
Abstract
Background:
Cerebral white matter lesions (WML) are related to a higher risk of vascular and Alzheimer’s dementia. Moreover, oligomerized amyloid-β (OAβ) can be measured from blood for dementia screening.
Objective:
We aimed to investigate the relationship of plasma OAβ levels with clinical and radiological variables in a health screening population.
Methods:
WML, other volumetric parameters of magnetic resonance images, cognitive assessment, and plasma OAβ level were evaluated.
Results:
Ninety-two participants were analyzed. The majority of participants’ clinical dementia rating was 0 or 0.5 (96.7%). White matter hyperintensities (WMH) increased with age, but OAβ levels did not (r2 = 0.19, p < 0.001, r2 = 0.03, p = 0.10, respectively). No volumetric data, including cortical thickness/hippocampal volume, showed any significant correlation with OAβ. Log-WMH volume was positively correlated with OAβ (r = 0.24, p = 0.02), and this association was significant in the periventricular area. White matter signal abnormalities from 3D-T1 images were also correlated with the OAβ in the periventricular area (p = 0.039). Multivariate linear regression showed that log-WMH values were independently associated with OAβ (B = 0.879 (95% confidence interval 0.098 –1.660, p = 0.028)). Higher tertiles of WMH showed higher OAβ levels than lower tertiles showed (p = 0.044). Using a cutoff of 0.78 ng/mL, the high OAβ group had a larger WMH volume, especially in the periventricular area, than the low OAβ group (p = 0.036).
Conclusion:
Both WML and plasma OAβ levels can be early markers for neurodegeneration in the healthcare population. The lesions, especially in the periventricular area, might be related to amyloid pathogenesis, which strengthens the importance of WML in the predementia stage.
Keywords
INTRODUCTION
Alzheimer’s disease (AD) is becoming a rapidly increasing burden worldwide. Recently, a novel drug targeting amyloid-β (Aβ), aducanumab, was approved by the United States Food and Drug Administration and could inspire hope in patients and caregivers. To explore early pathologic signals, a considerable amount of animal and human research has been performed. As a result, many imaging biomarkers, such as magnetic resonance imaging (MRI)-based volumetric changes, functional degeneration revealed on fluorodeoxyglucose-positron emission tomography (FDG-PET), and molecular alterations revealed by amyloid and tau PET, have been discovered. Recent evidence emphasizes that the oligomeric form of Aβ is the main toxic molecule that results in AD [1, 2]. In line with these findings, a blood marker indirectly reflecting plasma oligomerized burden, namely plasma oligomerized amyloid-β (OAβ), could clearly distinguish AD patients from a cognitively normal population [3, 4].
Cerebral white matter lesions (WMLs) have been associated with a higher risk of vascular dementia and conversion of dementia in patients with mild cognitive impairment [5, 6]. These WMLs can be visualized and quantified by hyperintense lesions (white matter hyperintensities, WMHs) on T2 or fluid attenuated inversion recovery (FLAIR) sequences of MRI or hypointense lesions on T1 sequences (white matter signal abnormalities, WMSAs). Despite being simple literally, the pathophysiology is complex and still under much debate. Atherosclerosis caused by poorly controlled conventional vascular risk factors, such as hypertension, diabetes, and hyperlipidemia, is considered one of the major causes of AD. Furthermore, reduced compliance of small penetrating vessels, inflammation and ineffective glymphatic operating systems are implicated. The relationships in each diagnostic modality are intermingled and hardly explained independently. Amyloid PET, cerebrospinal fluid (CSF) amyloid, and other blood amyloid markers have been studied to demonstrate the relationship with WMHs, but whether plasma OAβ levels reflect WMHs in the pre-disease population is still unknown. Hence, in this study, using a recently developed blood amyloid marker, we aimed to identify the correlation between the burden of WMH and Aβ in the healthcare population.
MATERIALS AND METHODS
Study participants and clinical data
Overall, data were included from 100 consecutive participants from the institutional cohort who attended regular health check-up sessions from September 2019 to August 2020. These sessions included brain MRI, and magnetic resonance angiography (MRA), and magnetization prepared rapid gradient echo (MPRAGE) sequences. All participants were scanned by the same MRI machine (Siemens Skyra 3T, Germany). Through routine extensive questionnaires, the history of hypertension, diabetes, hyperlipidemia, stroke, chronic kidney disease, smoking and drinking behaviors were obtained and analyzed. Additionally, depression was screened by the Quick Inventory of Depressive Symptomatology-Self-Report (QIDS-SR), where scores of 11 points or higher indicated moderate to severe depression [7]. APOE genotyping was performed after individuals provided informed consent. For cognitive tests, the Korean version of the Consortium to Establish a Registry for Alzheimer’s disease (CERAD-K) was utilized, and an abnormal CERAD-K score was defined as below –2.5 standard deviations of age-, sex-, and education-matched norms in the Korean population. The Clinical Dementia Rating (CDR) and Global Deterioration Scale (GDS) were determined by an experienced neurologist (KIP). A total of 92 individuals were included in the analysis, excluding 8 with insufficient image quality or with lesions affecting volumetric image analysis. The presence of hypertension was defined by the fact that the participant was taking hypertensive medication. The presence of diabetes mellitus was assumed if the patient was taking diabetes medication or had a hemoglobin A1c (HbA1c) ≥6.5% at the time of the MRI visit. Hyperlipidemia was defined as low-density lipoprotein (LDL) cholesterol≥160 mg/dl, total cholesterol≥240 mg/dl, or triglyceride≥200 mg/dl at the time of visit. Information about smoking and alcohol drinking behavior was obtained based on routine questionnaires [8]. At-risk drinking was defined according to The National Institute on Alcohol Abuse and Alcoholism (NIAAA) criteria [9]. The Institutional Review Board of the Seoul National University Hospital approved this study protocol and waived informed consent because this study retrospectively collected participants’ data from brain check-ups that were performed as part of health screening (IRB no. H-1910-193-1079).
Plasma OAβ
The OAβ evaluation method was described in detail in a previous paper [3, 8]. All analyses were entrusted to the laboratory (Seegen Technologies, Korea), which used a commercialized kit (inBloodTM oligomerized Aβ Test, Peoplebio Inc, Gyeonggi-do, Korea). Blood was sampled in a heparin tube and stored at –70°C after centrifugation. The technique entails an atypical sandwich enzyme-linked immunosorbent assay (ELISA) using epitope-overlapping antibodies specific for the N-terminus of Aβ to measure plasma OAβ levels. The epitopes for the 6E10 and W0–2-HRP antibodies overlapped at the N-terminus of Aβ, and mouse monoclonal anti-6E10 (BioLegend, San Diego, CA, USA). Anti-W0–2-HRP antibodies (Absolute Antibody Ltd., Oxford, UK) were therefore used to capture and detect OAβ levels, respectively [8]. Purified synthetic Aβ was added to plasma and then the plasma was incubated. Finally, the relative luminescence unit signal was detected using a spectrophotometer. Dilutions providing signals in the linear range of the standard curves were used for the conversion to relative values to determine the concentration of OAβ. Cutoff values for Multimer Detection System (MDS)-OAβ were set as 0.78 ng/mL.
WMH analysis
WMHs were quantified as described previously [10, 11]. FLAIR images were downloaded and stored in an offline computer. They were converted to one NIFTII file using MRIcron (https://www.nitrc.org/projects/mricron). A NIFTII file was loaded on a semiautomated volumetric program freely available, named Neuroi (Nottingham University, Nottingham, UK). A neurologist (KIP) reviewed all images and clicked on areas of WMHs, and then the program roughly determined the boundaries of the lesions, which were finally delineated correctly by adjusting the intensity threshold. The volume of WMHs were classified for total, periventricular, and subcortical areas. Normalization was performed with total intracranial volume.
Quantification of cortical thickness, hippocampal volume, and WMSAs
We quantified cortical thickness, hippocampal volume, and WMSAs automatically using the program FreeSurfer (version 5.3, Athinoula A. Martinos Center for Biomedical Imaging, Boston, MA, USA) and MPRAGE images with a 20-channel head-and-neck coil (repetition time (TR) = 1600 ms, echo time (TE) = 2.8 ms, flip angle = 9°, field of view (FOV) = 240 mm, and 256×256 mm of resolution). The raw images were transformed to NIFTI file format using MRIcron (https://www.nitrc.org/projects/mricron), followed by automatic FreeSurfer processes including skull stripping, normalization, transformation, registration, and parcellation [12, 13]. After automatic processing, we edited the images manually by reviewing them cut-by-cut using the ‘Freeview’ viewer, which is a command that is built into the software. Hippocampal volumes were adjusted by the estimated total intracranial volume. WMSAs were segmented on T1 images with a fully automated method based on their intensity and spatial information [14–16]. WMSAs were regionally classified into periventricular and subcortical WMLs. Pertinently, WMSAs are highly correlated with volumes with WMHs on FLAIR images [17].
Statistical analysis
The descriptive data are shown as a percent or mean±standard deviation. For continuous variables, Student’s t-test and ANOVA were used. To search for independent variables, multiple linear regression was used using SPSS (version 25) and GraphPad Prism (version 9). The results of the correlation analysis are presented as the Pearson correlation coefficient. To evaluate cortical thickness-associated OAβ levels, correction for multiple comparisons was performed. Significance was defined as p < 0.05. The graphs were illustrated using GraphPad Prism (version 9).
RESULTS
A total of 92 participants (male: female = 43:49) were analyzed. The participants were aged 68.1±7.7 years (43–82). Demographic data are summarized in Table 1. Notably, 15 out of 69 participants examined were APOE ɛ4 carriers (15.6%). The Mini-Mental Status Examination (MMSE) score was 25.8±3.2 (10–30), and the majority of participants’ CDR was 0 or 0.5 (96.7%). Finally, only three persons are AD, according to the National Institute on Aging-Alzheimer’s Association criteria. The remaining participants with a CDR 0.5 were MCI and with a CDR of 0 were either cognitively healthy or subjective cognitive decline. All participants with a CDR 0.5 showed 0.5 for the memory component.
Demographic data
SD, standard deviation; CDR, clinical dementia rating; GDS, global deteriorating score; QIDS-SR, Quick Inventory of Depressive Symptomatology-Self Report; NA, data not available.
Effect of age on WMHs and plasma OAβ levels
Plasma OAβ levels were not correlated with age (r2 = 0.03, p = 0.10). The total volume of WMHs and the log-transformed WMHs increased according to age (r2 = 0.19, p < 0.001 and r2 = 0.38, p < 0.001, respectively) (Fig. 1B).
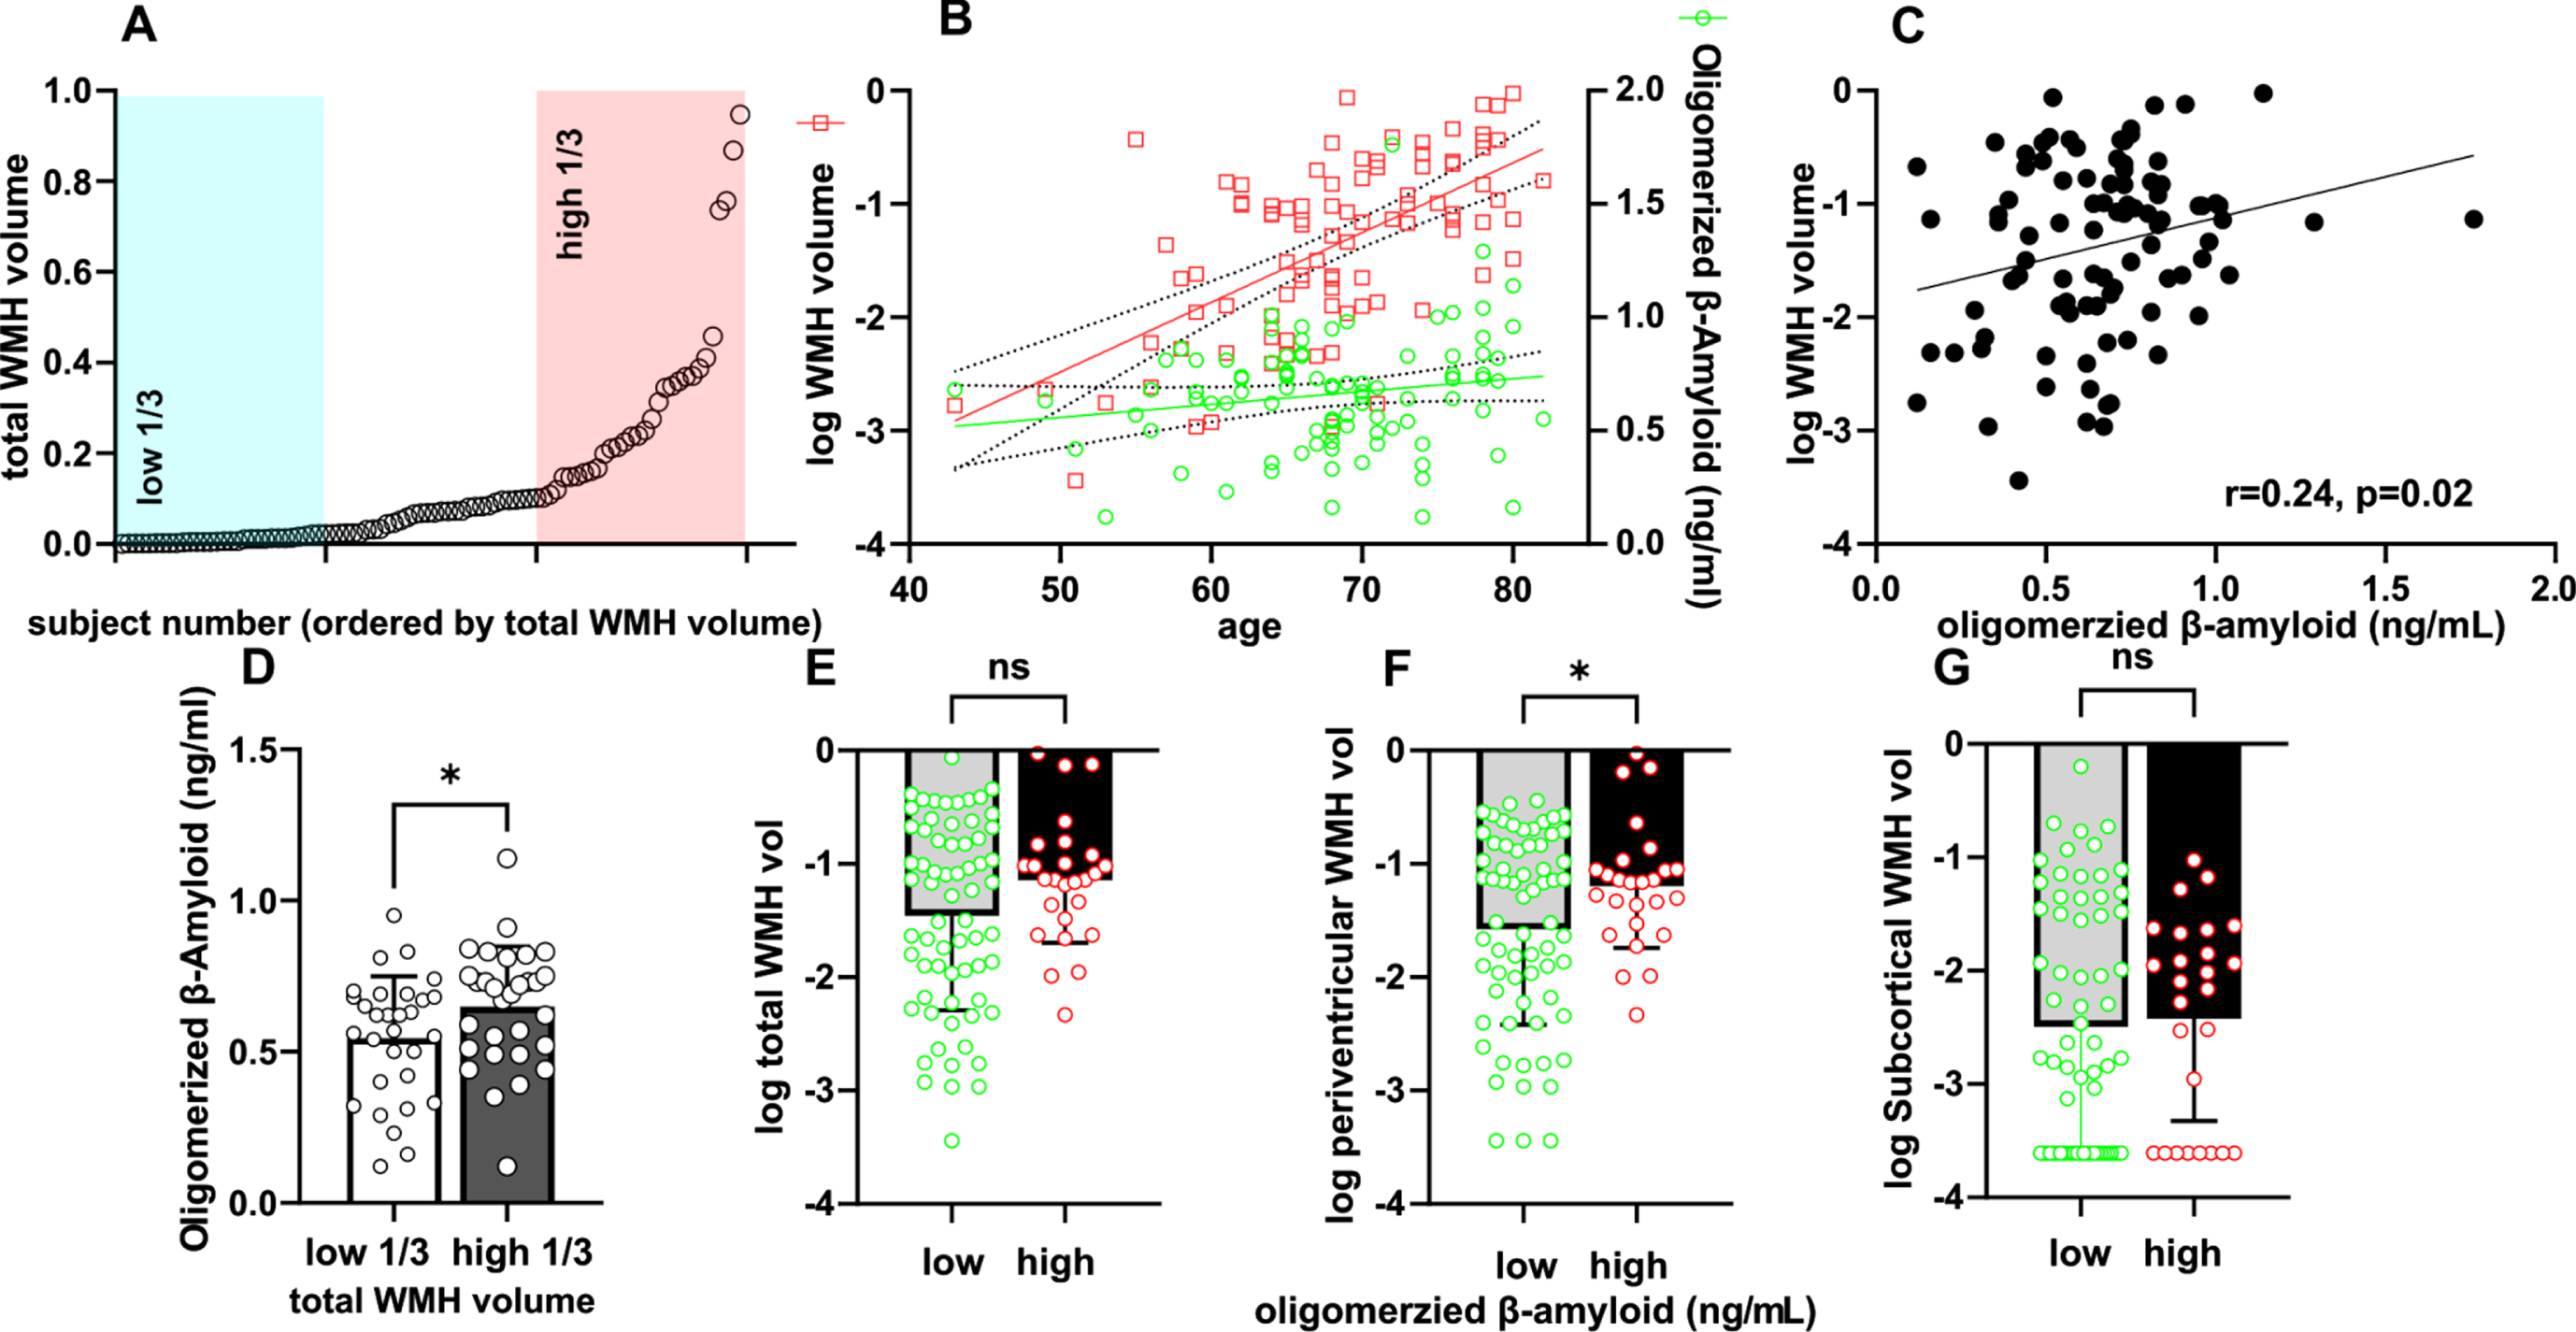
White matter hyperintensity (WMH) and plasma oligomerized amyloid-β (OAβ) according to locations. A) The distribution of WMH volume. B) While the volume of white matter hyperintensities increases with age, OAβ levels show no significant correlation with age. C) OAβ levels are correlated with log-WMH volume. D) The high tertile of the WMH volume group showed higher levels of OAβ. E-G) Using a cutoff of 0.78, compared to the low OAβ group, the high OAβ group showed a larger WMH volume, especially in the periventricular area, not in the total and subcortical areas. *p value < 0.05. ns, no significance.
WMLs and plasma OAβ levels
The burden of WMLs was quantified using FLAIR (WMH) and T1 MPRAGE (WMSA). The volume of WMLs was divided into total, periventricular and subcortical areas and normalized individually by the total intracranial volume. Since the total WMH volume did not show a Gaussian distribution (Fig. 1A), the analysis was performed using the log-transformed value. Log-transformed total WMH volume was positively correlated with OAβ levels (r = 0.24, p = 0.02) (Fig. 1C). In particular, its association was evident only in the periventricular area but not in the subcortical area (Table 2).
Correlation of OAβ levels with WMH
WMH, white matter hyperintensity; PV, periventricular; SC, subcortical.
The total WMSA volume was well correlated with WMHs (r2 = 0.629, p < 0.001) (Fig. 2A). After categorizing WMSAs into periventricular and subcortical WMSAs, log-transformed values of total and periventricular WMSAs were correlated with OAβ levels (r = 0.209, 0.211 and p = 0.047, 0.045, respectively). Subcortical WMSAs were not significantly correlated with WMHs (r = 0.202, 0.129 and p = 0.055, 0.129, respectively) (Fig. 2B-D).

Automatic measurement of white matter signal abnormalities (WMSA) using 3D MPRAGE analyzed by FreeSurfer. A) Comparison of automatic Freesurfer analysis of WMSA and the semiautomatic analysis of white matter hyperintensities on FLAIR. B-D) Relationship between oligomerized Aβ in plasma and WMSA volume according to location.
Univariate analysis identified different variables that were significantly associated with log-WMH values and OAβ levels. While univariate analysis showed that log-WMH values were associated with hypertension, at-risk drinking, abnormal CERAD-K scores and log-WMHs (p = 0.002, 0.02, 0.04, and p for OAβ levels, respectively), multivariate analysis confirmed the independent association of OAβ levels and age with log-WMH volume (B = 0.879, (95% confidence interval (CI) 0.098 –1.660), p = 0.028 and B = –0.006, (95% CI 0.015–0.065), p = 0.002, respectively).
When analyzing the independent variables associated with OAβ levels, log-WMH was the only significant factor revealed (B = 0.123, (95% CI 0.011–0.235), β= 0.484, p = 0.032) (Table 3). The higher tertile of WMH burden showed significantly higher OAβ levels than the lower tertile showed (p = 0.044) (Fig. 1D). With a cutoff of 0.78 in the level of OAβ, the high OAβ group showed a significantly larger WMH volume, especially in the periventricular area, not in total and subcortical WMH (p = 0.036, 0.234, and 0.768, respectively) (Fig. 1E-G).
Multivariate linear regression with OAβ level as a dependent variable
B, unstandardized coefficient; CI, confidence interval; β, standardized coefficient; WMH, white matter hyperintensity; HbA1c, hemoglobin A1C; LDL, low-density lipoprotein; MMSE, Mini-Mental Status Examination; CERAD-K, Korean version of the Consortium to Establish a Registry for Alzheimer’s disease. *p < 0.05.
Hippocampal volume, cortical thickness, and OAβ level
No correlation was observed between the levels of OAβ and the volume of hippocampus (Fig. 3B). Dichotomizing the high or low OAβ group with a cutoff of 0.78 did not reveal a difference in hippocampal volume. (p = 0.69 in right and 0.70 in left) (Fig. 3C). The association of cortical thickness in 34 regions of interest on each side with OAβ levels was evaluated. The correlations with OAβ levels in each area are shown in Fig. 3D and 3E. No regions showed statistical significance by multiple comparison analysis.
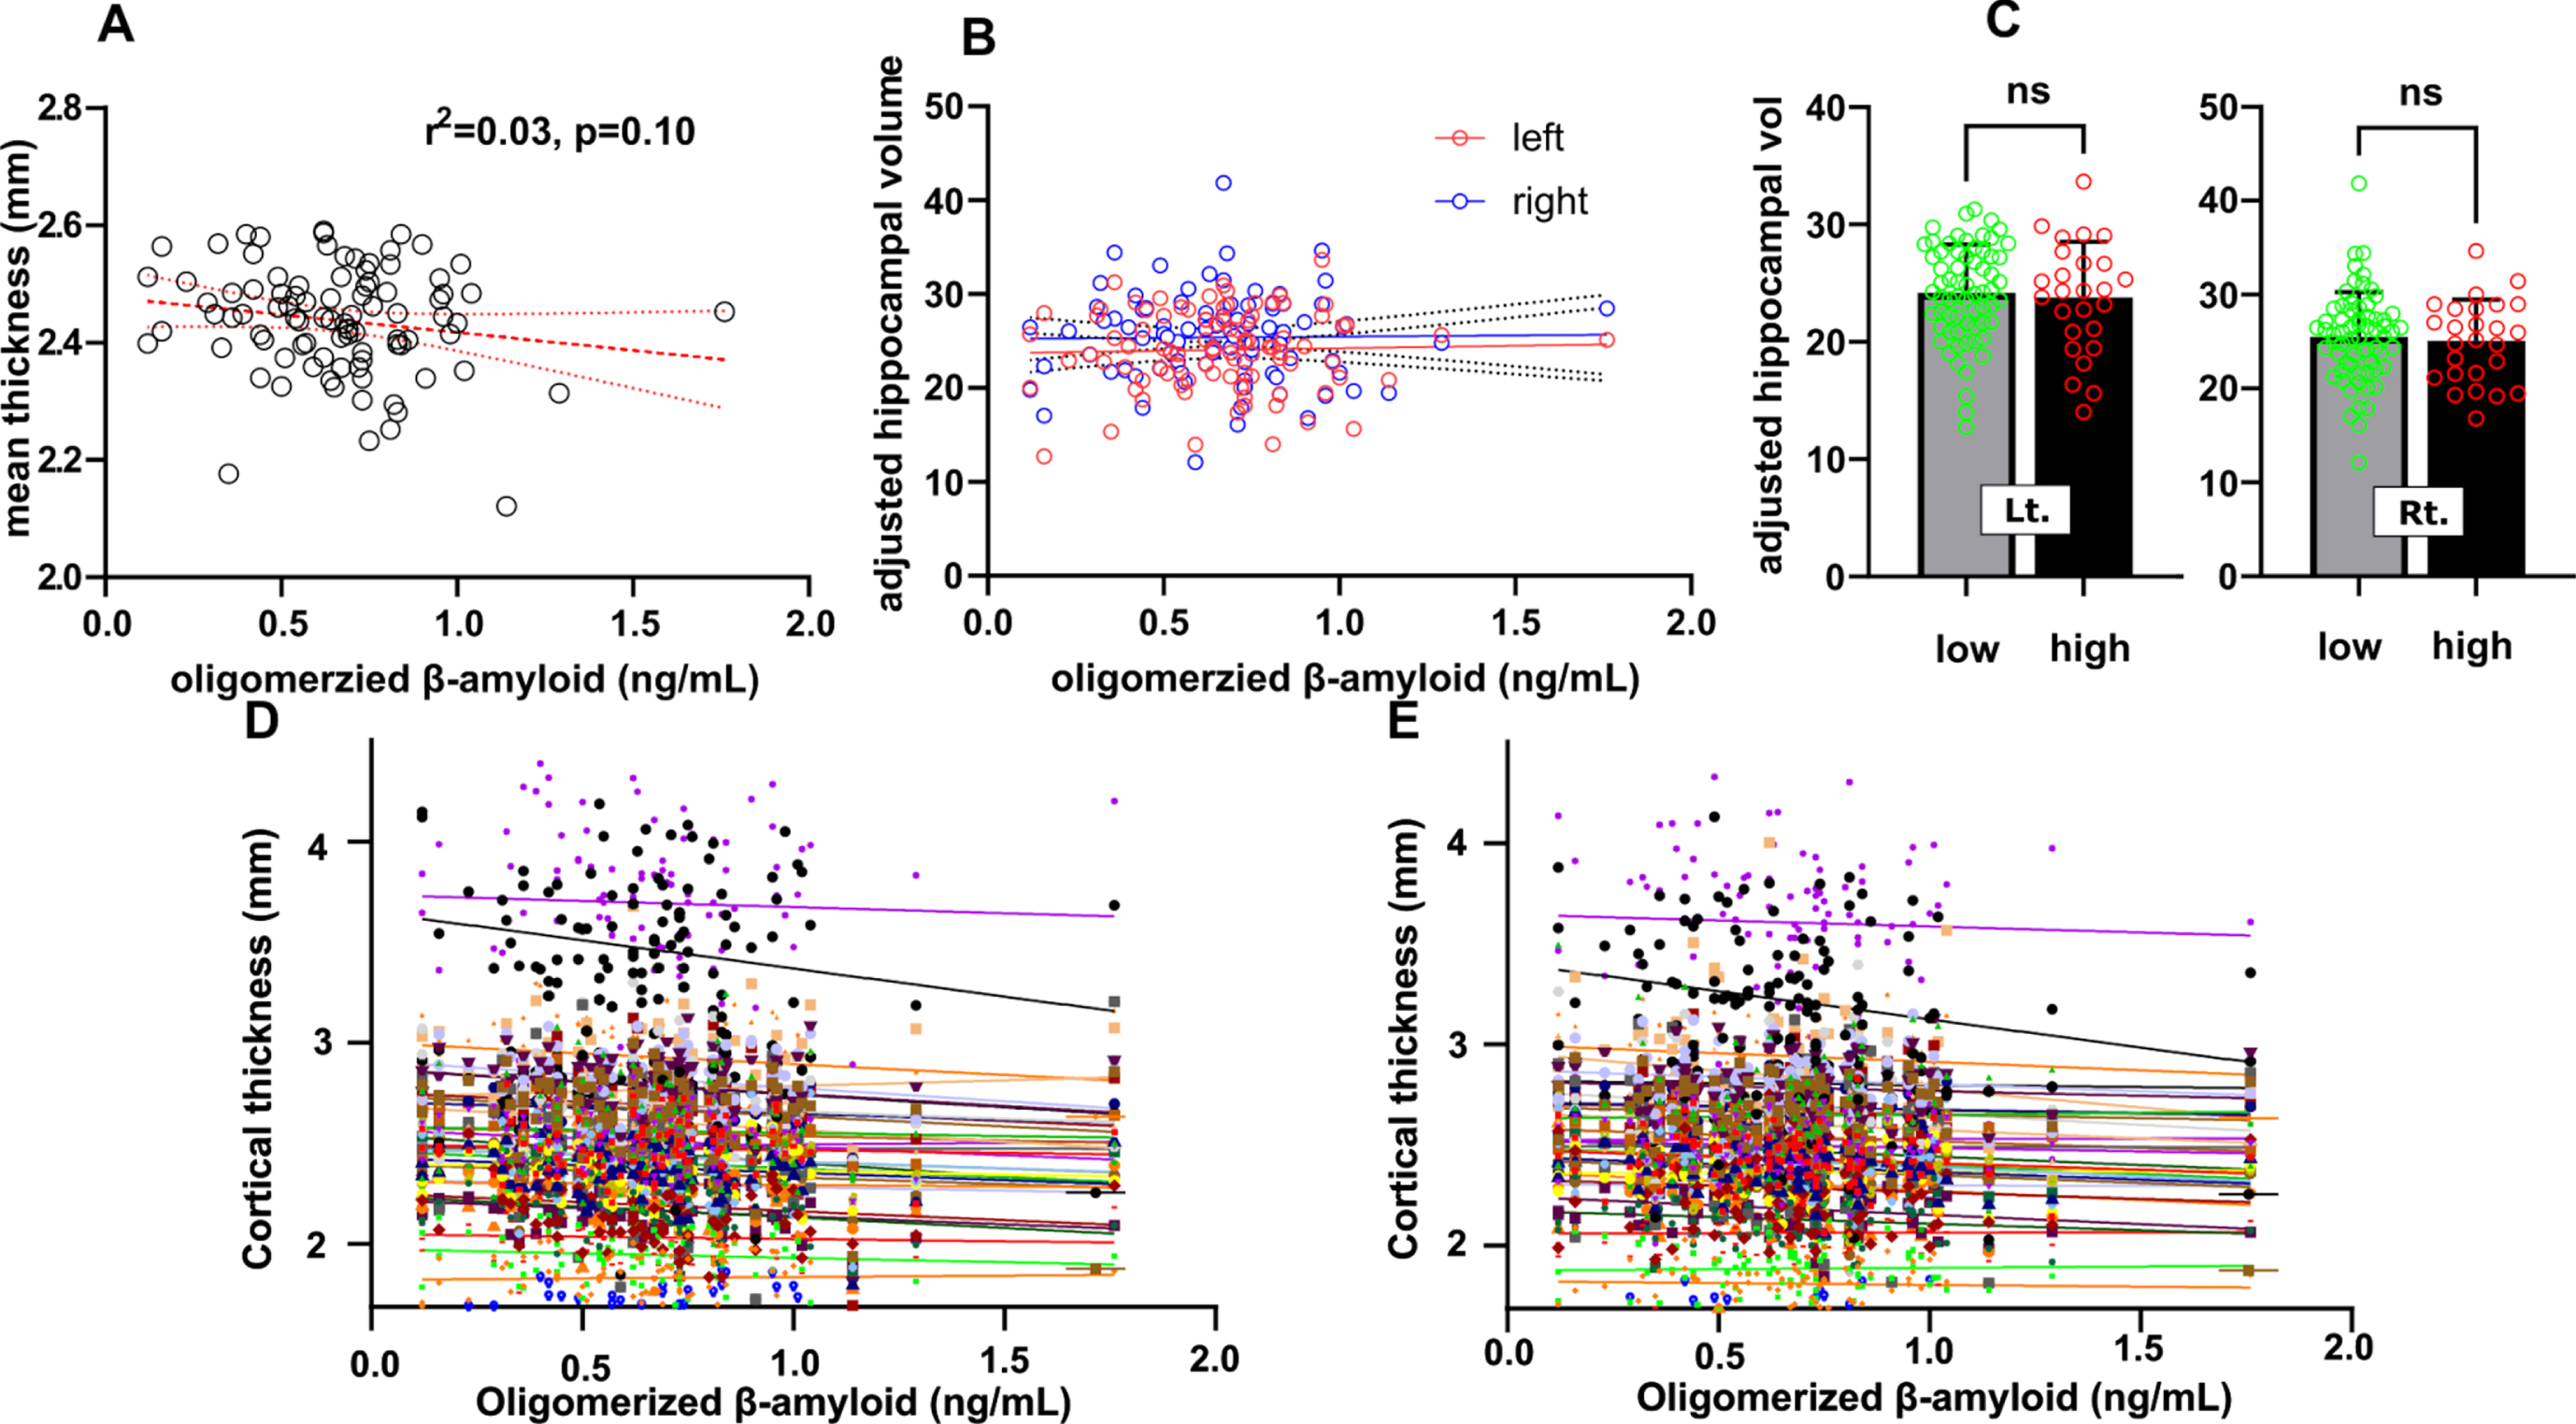
The relationship between volumetric parameters/white matter hyperintensity and plasma oligomerized amyloid-β (OAβ). A) OAβ is not correlated with mean cortical thickness in this population. B, C) Hippocampal volume was not different according to the OAβ levels. D, E) None of the subregions showed a correlation with OAβ levels. The subregions are presented as follows: each region is depicted by different color on the graph (banks of superior temporal sulcus, caudal anterior cingulate, caudal middle frontal, cuneus, entorhinal, fusiform, inferior parietal, inferior temporal, isthmus cingulate, lateral occipital, lateral orbitofrontal, lingual, medial orbitofrontal, middle temporal, parahippocampal, paracentral, pars opercularis, pars orbitalis, pars triangularis, pericalcarine, postcentral, posterior cingulate, precentral, precuneus, rostral anterior cingulate, rostral middle frontal, superior frontal, superior parietal, superior temporal, supramarginal, frontal pole, temporal pole, transverse temporal, and insula.). ns, no significance.
DISCUSSION
In this study, we demonstrated the link between plasma OAβ levels, a blood marker of AD, and WMHs. Pertinently, Aβ is a main molecule of AD pathology. Excessive accumulation of Aβ by overproduction or impaired clearance, known as the amyloid hypothesis, has been assumed to be a core pathophysiology of AD, despite controversies [18]. Previously, the same method of detecting OAβ in plasma, which measures OAβ by spiking synthetic Aβ, could clearly differentiate AD and nondemented people with 100% sensitivity and 92.3% specificity [4], although this measurement indirectly reflects oligomerized Aβ state in plasma. In addition, plasma OAβ levels efficiently reflects conventional biomarkers of AD, such as CSF Aβ42, phosphorylated tau protein, and total tau protein, as well as amyloid PET status [19].
WMHs increase the risk of dementia [6], and several mechanisms have been proposed to explain this relation. Given that the WMHs are basically MRI markers of small vessel disease and that conventional vascular risk factors contribute to AD pathogenesis, vascular risk factors are common features between WMH and AD. A large population-based study also supports the correlation of WMHs with AD risk and showed that vascular risk factors, such as hypertension and smoking were independent risk factors for WMH [20]. Thus, vascular risk factors are considered modifier of dementia prevention or progression. Hypertension is known as a leading cause in AD progression. Moreover, activation of the renin-angiotensin system in the brain is thought to affect the disease directly, and impaired blood supply due to atherosclerotic changes could also affect the disease [21]. However, hypertension reached statistical significance only in univariate analysis but did not in multivariate analysis in this study. Notably, diabetes mellitus damages cerebral vessels directly, leading to AD, and the direct impact of an insulin-associated mechanism alters Aβ production. The reason that the findings failed to show a significant association with these well-known risk factors for AD might be due to the small number of individuals included in the study. With age, the WMH burden increased, while OAβ levels did not differ significantly, which is comparable to the findings of previous studies [4, 20]. The finding that OAβ levels are correlated with WMH burden even after adjusting for various confounders, including vascular risk factors and age, implies that other risks are associated with an increase in OAβ levels.
Multivariate linear regression with log-transformed white matter hyperintensity as a dependent variable
B, unstandardized coefficient; β, standardized coefficient; WMH, white matter hyperintensity; HbA1c, hemoglobin A1C; LDL, low-density lipoprotein; CERAD-K, Korean version of the Consortium to Establish a Registry for Alzheimer’s disease. *p < 0.05, **p < 0.01.
A potential linkage between WMH and plasma OAβ is the impaired drainage of cerebral waste, supposed that plasma OAβ is a reliable marker of AD. Glymphatic (glial plus lymphatic) dysfunction is one of the mechanisms that could explain amyloid accumulation in AD pathophysiology. In AD, the glymphatic system, which provides astrocyte-dependent waste drainage, is proposed as one of the routes of Aβ clearance from the brain parenchyma. A perivascular pathway facilitates the movement of interstitial wastes, such as Aβ, from the brain parenchyma into the CSF [22]. Impaired glymphatic drainage is also involved in WMH development [23]. The evidence that WMHs increase and interstitial drainage decreases with age explains the age-dependent volume increase in WMHs. In this study, we demonstrated the association of the amyloid marker with an MRI marker of small vessel disease. Furthermore, a systematic review failed to demonstrate a clear association between the burdens of Aβ deposition in the brain using amyloid PET and WMH detection [24]. However, evidence of an association between WMHs and fluid biomarkers of AD is accumulating, but the results are still controversial. Also, Aβ1–42 in CSF was previously demonstrated to be related to WMHs in a cognitively normal population [5, 26], and dominantly inherited the AD population [27], while another study showed no significant association between WMHs and CSF Aβ [28]. Another study measuring plasma Aβ42 reported that plasma Aβ is associated with brain MRI markers of small vessel disease, which is consistent with our results. That study showed a higher group of plasma Aβ42, more lacunes or microbleeds, and enlarged perivascular space in patients compared to healthy individuals. It also reported the association between the inflammatory marker C-reactive protein, gray matter volume, and plasma Aβ. The authors proposed that inflammation mediates atherosclerosis, endothelial injury and hypoperfusion, leading to neurodegeneration [29]. Inflammation could be an explainable mediator between WMLs caused by small vessel disease and plasma OAβ levels. Interestingly, the inflammatory response is increased by microglia induced by the leakage of blood constituents through the blood-brain barrier. Among the constituents released, perivascular fibrin involves Aβ accumulation [30, 31]. The oligomer form of Aβ activates microglia, leading to an increase in inteukin-1β, which seems to contribute to AD. The smaller oligomer could be the more potent stimulus of AD development and progression [32]. Our findings further supported the potential link between intrinsic small vessel disease and AD pathology.
Although amyloid PET is the gold standard tool for diagnosing patients on the AD continuum, this method is still very expensive and not available in most clinics. On the other hand, the plasma OAβ technique is easily applicable and clearly differentiates AD patients and nondemented people [3, 4]. Furthermore, our previous study targeting a health screening population identified its association with abnormalities in the cognitive domains of neuropsychology batteries [8], indicating the feasible role of the OAβ technique in cognitively healthy populations as an early screening tool for at-risk AD patients. The CSF marker also has a limitation due to its invasiveness. As a part of the effort to determine correlations between pathological findings and OAβ levels, another study using the same technique showed a relationship between cortical thinning and white matter volume [33]. This study added potential evidence of an imaging marker, WMH, showing a strong association with OAβ levels. We observed that no subregion of the brain, in terms of thickness and volume, was correlated with OAβ levels, which is inconsistent with a previous study showing vulnerable areas to Aβ deposition, such as the posterior cingulate and precuneus [33, 34]. One possible reason for this discrepancy is that participants in the study may have been perceived being as within a cognitively healthy range, as indicated by their CDR. Most (96.7%) participants had a CDR of 0 or 0.5. As such, WMHs could potentially be an earlier marker of cognitive decline than cortical thinning or hippocampal atrophy.
Given the different clinical features and pathophysiological bases of WMHs or WMSAs depending on the relative location [35, 36], white matter lesions were quantified separately in periventricular versus subcortical regions. Intriguingly, the association between plasma OAβ levels and WMHs was more evident in the periventricular area but not in the subcortical white matter. This finding is partially consistent with previous results, showing that the volume of periventricular WMHs was independently associated with Aβ in CSF as well as florbetapir-PET uptake [37]. The reasons that WMHs in the periventricular and subcortical areas are differentially associated with Aβ status are not clearly understood.
Cognitive impairment has been associated more significantly with periventricular WMHs than subcortical WMHs [38]. The periventricular area is proposed to be more vulnerable to the aging-related reduction in microvascular compliance, which may affect Aβ clearance by the glympathic system because arterial pulsating is its major driving force of solute clearance from the brain parenchyma [23, 40]. The degree to which WMHs relate to OAβ levels is clinically intuitive. We showed statistical significance of OAβ levels only in a comparison between of WMH volume in the highest and lowest tertiles. However, a further longitudinal study is required to define the significance level of WMH regarding cognitive decline.
This study did not show that the APOE ɛ4 genotype, which is the strongest genetic risk of AD, is related to OAβ levels. Given that APOE ɛ4 inefficiently drains Aβ via blood circulation [41, 42], APOE ɛ4 is predicted to have a greater risk of white matter changes, which is also supported by clinical evidence. Larger size data are warranted to demonstrate this association.
From a methodological point of view, fully automated measurement of WMSA is easily applicable and highly reproducible, albeit 3D-T1 images, which are often excluded in routine MRI, are necessary. The compatibility of detecting WMSAs by FreeSurfer is well known and correlated well with WMHs in FLAIR as well as Fazekas grading scores [43, 44]. The automated technique of WMSA quantification in 3D T1 images affirms a correlation with the OAβ level.
This study has some limitations to be considered. The first limitation is the small number participants. This resulted in multiple potentially associating factors with OAβ levels and WMH being undervalued. The second limitation is that most participants were cognitively healthy. As such, the correlation between imaging markers and blood markers of AD could not extend the dementia risk in this population. The large WMH volumes and increased level of OAβ levels in plasma did not necessarily indicate a high-risk population for dementia, since aged people with normal cognitive function can have Aβ accumulation in the brain. Additionally, the inhomogeneous study population limits how to explain pathophysiological meanings of the relation between an amyloid marker with WMH directly, because Aβ is basically AD pathology. These urge us to conduct a longitudinal study with a large sample size of a more homogenous cognitive group, with a higher tier of WMH burden or higher OAβ levels and to validate the result using external dataset. Nevertheless, the strength of this study is that we identified that WMH burden is implicated with an oligomerized amyloid marker, OAβ, which precedes volumetric changes.
In conclusion, the detection of WMHs in the periventricular area and plasma biomarkers, such as elevated OAβ levels, may help ascertain at-risk people with dementia and advance the present understanding of the relation between Aβ and white matter changes.