
Abstract
Background:
BOLD signals in the gray matter (GM) and white matter (WM) are tightly coupled. However, our understanding of the cross-tissue functional network in Alzheimer’s disease (AD) is limited.
Objective:
We investigated the changes of cross-tissue functional connectivity (FC) metrics for the GM regions susceptible to AD damage.
Methods:
For each GM region in the default mode (DMN) and limbic networks, we obtained its low-order static FC with any WM region, and the high-order static FC between any two WM regions based on their FC pattern similarity with multiple GM regions. The dynamic and directional properties of cross-tissue FC were then acquired, specifically for the regional pairs whose low- or high-order static FCs showed significant differences between AD and normal control (NC). Moreover, these cross-tissue FC metrics were correlated with voxel-based GM volumes and MMSE in all participants.
Results:
Compared to NC, AD patients showed decreased low-order static FCs between the intra-hemispheric GM-WM pairs (right ITG-right fornix; left MoFG-left posterior corona radiata), and increased low-order static, dynamic, and directional FCs between the inter-hemispheric GM-WM pairs (right MTG-left superior/posterior corona radiata). The high-order static and directional FCs between the left cingulate bundle-left tapetum were increased in AD, based on their FCs with the GMs of DMN. Those decreased and increased cross-tissue FC metrics in AD had opposite correlations with memory-related GM volumes and MMSE (positive for the decreased and negative for the increased).
Conclusion:
Cross-tissue FC metrics showed opposite changes in AD, possibly as useful neuroimaging biomarkers to reflect neurodegenerative and compensatory mechanisms.
Keywords
INTRODUCTION
The pathological hallmarks of Alzheimer’s disease (AD) were the amyloid aggregations and neurofibrillary tangles [1]. Gray matter (GM) atrophy in the medial temporal lobe was the most prominent structural abnormality of AD [2]. Regarding functional connectivity (FC), consistent findings were the decreased FCs in the default mode network (DMN) and limbic network [3–5]. Moreover, increased FCs were found in various locations, especially in the salience and executive networks, indicating the compensatory changes [6–9].
Previous functional network studies mainly focused on the FC between two GM regions to reveal the AD’s neurodegenerative and compensatory changes. Recently, an emerging field delved into the temporal synchronization between GM and white matter (WM) regions, as the BOLD signal changes detected in the two tissues were tightly coupled through biochemical and vascular processes [10–13]. This novel neuroimaging biomarker, cross-tissue FC, has been applied in the studies of AD, mild cognitive impairment, major depressive disorder, and epilepsy [14–17]. A recent study demonstrated that using the cross-tissue FC could achieve a superior classification accuracy between AD and normal controls (NC), compared to using the FC within GM alone [15].
Most previous studies viewed the cross-tissue connection as stable across time. However, the synchronization of BOLD signals between WM and GM often fluctuated over time, and this transient feature could be described by the coefficient of temporal variation (CV) [18–20]. Evidence showed that the CV was lower in the primary sensory and motor networks and higher in the DMN, possibly reflecting the balance of stability and flexibility of different networks’ configurations [20–22]. This balance might be shifted in neurological disorders, with the enhanced CV indicating a more adaptable change to compensate for the pathological-related inefficiency [23, 24]. The directional property illustrated the direction of information flow, measured by effective connectivity (EC) [25–28]. A positive EC from Region X to Region Y indicates that the neural activity in the former region exerts an enhancing effect on the latter’s activity [29, 30]. To our knowledge, the dynamic and directional properties of cross-tissue FC metrics were rarely explored in previous studies.
Unlike the traditional low-order FC that focused on temporal synchronization between two regions, the high-order FC emphasized the similarity between two regions on their correlation profiles with multiple regions, also referred to as the “correlation of correlations” [31]. The high-order network could reflect the complex hierarchical architecture [32, 33]. A recent study included the high-order FC in the classification analysis and found the sensitivity improved by ∼25% in distinguishing amnestic mild cognitive impairment (aMCI) and NC [32]. An increased high-order FC between two regions could be due to their functional resemblance, or their shared pathological process; both reasons could enhance their similarity in topological profiles.
Our recent study employed a low-order static FC metric to characterize the cross-tissue network’s topological changes in AD and showed both increased and decreased changes, distributed in various GM and WM regions (https://www.biorxiv.org/content/10.1101/2021.08.30.458154v1). As the compensatory changes functioned as an offset for the neurodegenerative-induced neural inefficiency, we wondered how the cross-tissue FC would change for the GM regions that were particularly vulnerable to AD’s pathological damage. With these GM regions as our region-of-interest (ROIs), several questions were raised: 1) is it possible that there were both decreased and increased cross-tissue FCs for these ROIs in AD? 2) How would these cross-tissue FC changes in AD spatially distribute? 3) What mechanisms were underlying these changes? 4) How would the high-order FC between two WM regions (based on their FCs with one network’s GMs) change in AD, and what were the underlying reasons?
To address these questions and deepen our understanding of cross-tissue FC, we generated two layers of cross-tissue FC (i.e., low- and high-order FC) and examined each layer’s static, dynamic, and directional properties. The GM ROIs were restricted in the DMN and limbic networks, while the whole-brain WM regions were used as there was no consensus on the vulnerable WM regions in AD. We first calculated the static low-order FCs and high-order FCs, and then compared them between AD and NC, as the static metrics could provide us with a general intrinsic FC pattern between cross-tissue regions’ spontaneous neural activities, without presumptions on the causal model and temporal precedence. We then adopted a data-driven approach to quantify the dynamic and directional properties for specific GM-WM pairs/WM-WM pairs whose low-/high-order static FCs showed significant group differences, and then compared them between the two groups. Furthermore, we performed correlation analyses for these cross-tissue FC metrics with voxel-based GM volumes and cognitive performance in all participants to illustrate their neuroanatomical basis and cognitive relevance.
METHODS
ADNI database
The present study used the open database, the Alzheimer’s Disease Neuroimaging Initiative (ADNI), to acquire data. ADNI was launched in 2004 to investigate AD and its prodromal stages (http://www.adniinfo.org). ADNI included four databases (ADNI-1, ADNI-2, ADNI-3, ADNI-GO). An initial five-year study, termed ADNI-1, was followed by two renewal five-year studies termed ADNI-2 and -3; and ADNI-GO enrolled early MCI participants [34]. Consistent with previous studies on the database selection for the resting-state functional magnetic resonance imaging (rsfMRI) images of AD patients, we only used the data from ADNI-2, as the ADNI-1 phase did not collect rs-fMRI data, and the ADNI-3 phase included the longitudinal data of ADNI-2 [35, 36].
According to the standardized protocol, the ADNI data was collected from various acquisition sites across Canada, and the United States, approved by the Institutional Review Board at each acquisition site, and written informed consent was obtained from each participant.
Participants
The ADNI-2 imaging data were collected at multi-sites, with different scanners and parameters [37]. To alleviate the scanner effect, we carefully checked the scanner information and only used the image data acquired by the same scanner with same acquisition parameters. The inclusion criteria for the participants: 1) a clinician-confirmed diagnosis of AD or “normal” at the screening visit; and 2) the complete rs-fMRI data available for the participants at their first scan time in the ADNI 2 database; 3) the participants scanned by a 3.0T Philips scanner with the same acquisition parameters (see below for the parameters). In total, 30 AD patients and 37 NC were included in this study. The sample sizes of AD and NC were comparable with previous AD studies that used ADNI rs-fMRI data [35, 36]. No significant differences were found between the two groups on age and gender (Table 1).
Demographic characteristics and neuropsychological test results
Data are presented as the mean±SD. NC, normal control; AD, Alzheimer’s disease; MMSE, Mini-Mental State Examination; CDR, Clinical Dementia Rating Scale. aThe p-value was obtained by the two-sample two-tailed t-test. bThe p-value was obtained by the two-tailed Pearson χ2 test.
Image acquisition and preprocessing
The rs-fMRI data were obtained using an echo-planar imaging (EPI) sequence with the following parameters: repetition time (TR) = 3000 ms, echo time (TE) = 30 ms, flip angle (FA) = 80°, number of slices = 48, slice thickness = 3.313 mm, voxel size = 3×3×3 mm3, voxel matrix = 64×64, and total volume = 140. The T1-weighted images were acquired using the following parameters: TR = 6.8 ms, TE = 3.1 ms, FA = 9°, slice thickness = 1.2 mm, number of slices = 170, voxel size = 1.1×1.1×1.2 mm3, acquisition matrix = 244×244.
Rs-fMRI images were preprocessed using the Data Processing and Analysis of Brain Imaging software package (DPABI, http://rfmri.org/dpabi) and the SPM12. The preprocessing procedure consisted of eight steps: 1) discarding the first ten volumes; 2) slice-timing (the slice order sequence was the same for all participants); 3) head motion correction (the maximum motion threshold≤2 mm or 2°); 4) normalization to the EPI template and resampled to 3×3×3 mm3; 5) detrend; 6) nuisance covariates regression (Friston 24 for head motion, global signal, and cerebrospinal fluid signal regression); 7) temporal scrubbing (the scan volume with the frame-wise displacement (FD) > 1 was removed); and 8) band-pass filter (0.01 Hz–0.15 Hz) to reduce low-frequency drift and high-frequency physiological noise [38, 39]. One AD participant was removed from this study due to the maximum head motion beyond the threshold. Notably, we used the EPI template (provided by SPM, in standardized MNI space) for normalization, which generated satisfactory results. We also tried the normalization with T1 images using the DARTEL method, which generated poor quality results with parts of brain distortion, missing, or spatial mismatch. Previous AD studies have also used the EPI template for rs-fMRI normalization, instead of the T1 image, possibly due to severe structural atrophy of AD patients [40–43].
Low-order FC metrics between WM and GM
Static property: low-order FC (LOFC)
According to the Human Brainnetome Atlas, there were 58 GM regions in the DMN and 28 GM regions in the limbic network [44–47]; we chose them for the calculation of GM-WM FC metrics. The whole-brain WM regions (n = 48) were used, based on the John Hopkins University WM tractography atlas (see Fig. 1-I/II for the flow chart). The spatial distribution and details information for all the GM and WM regions used in our study were provided in the Supplementary materials (Supplementary Table 1 and Supplementary Figure 1 for the GM regions, and Supplementary Table 2 and Supplementary Figure 2 for the WM regions).
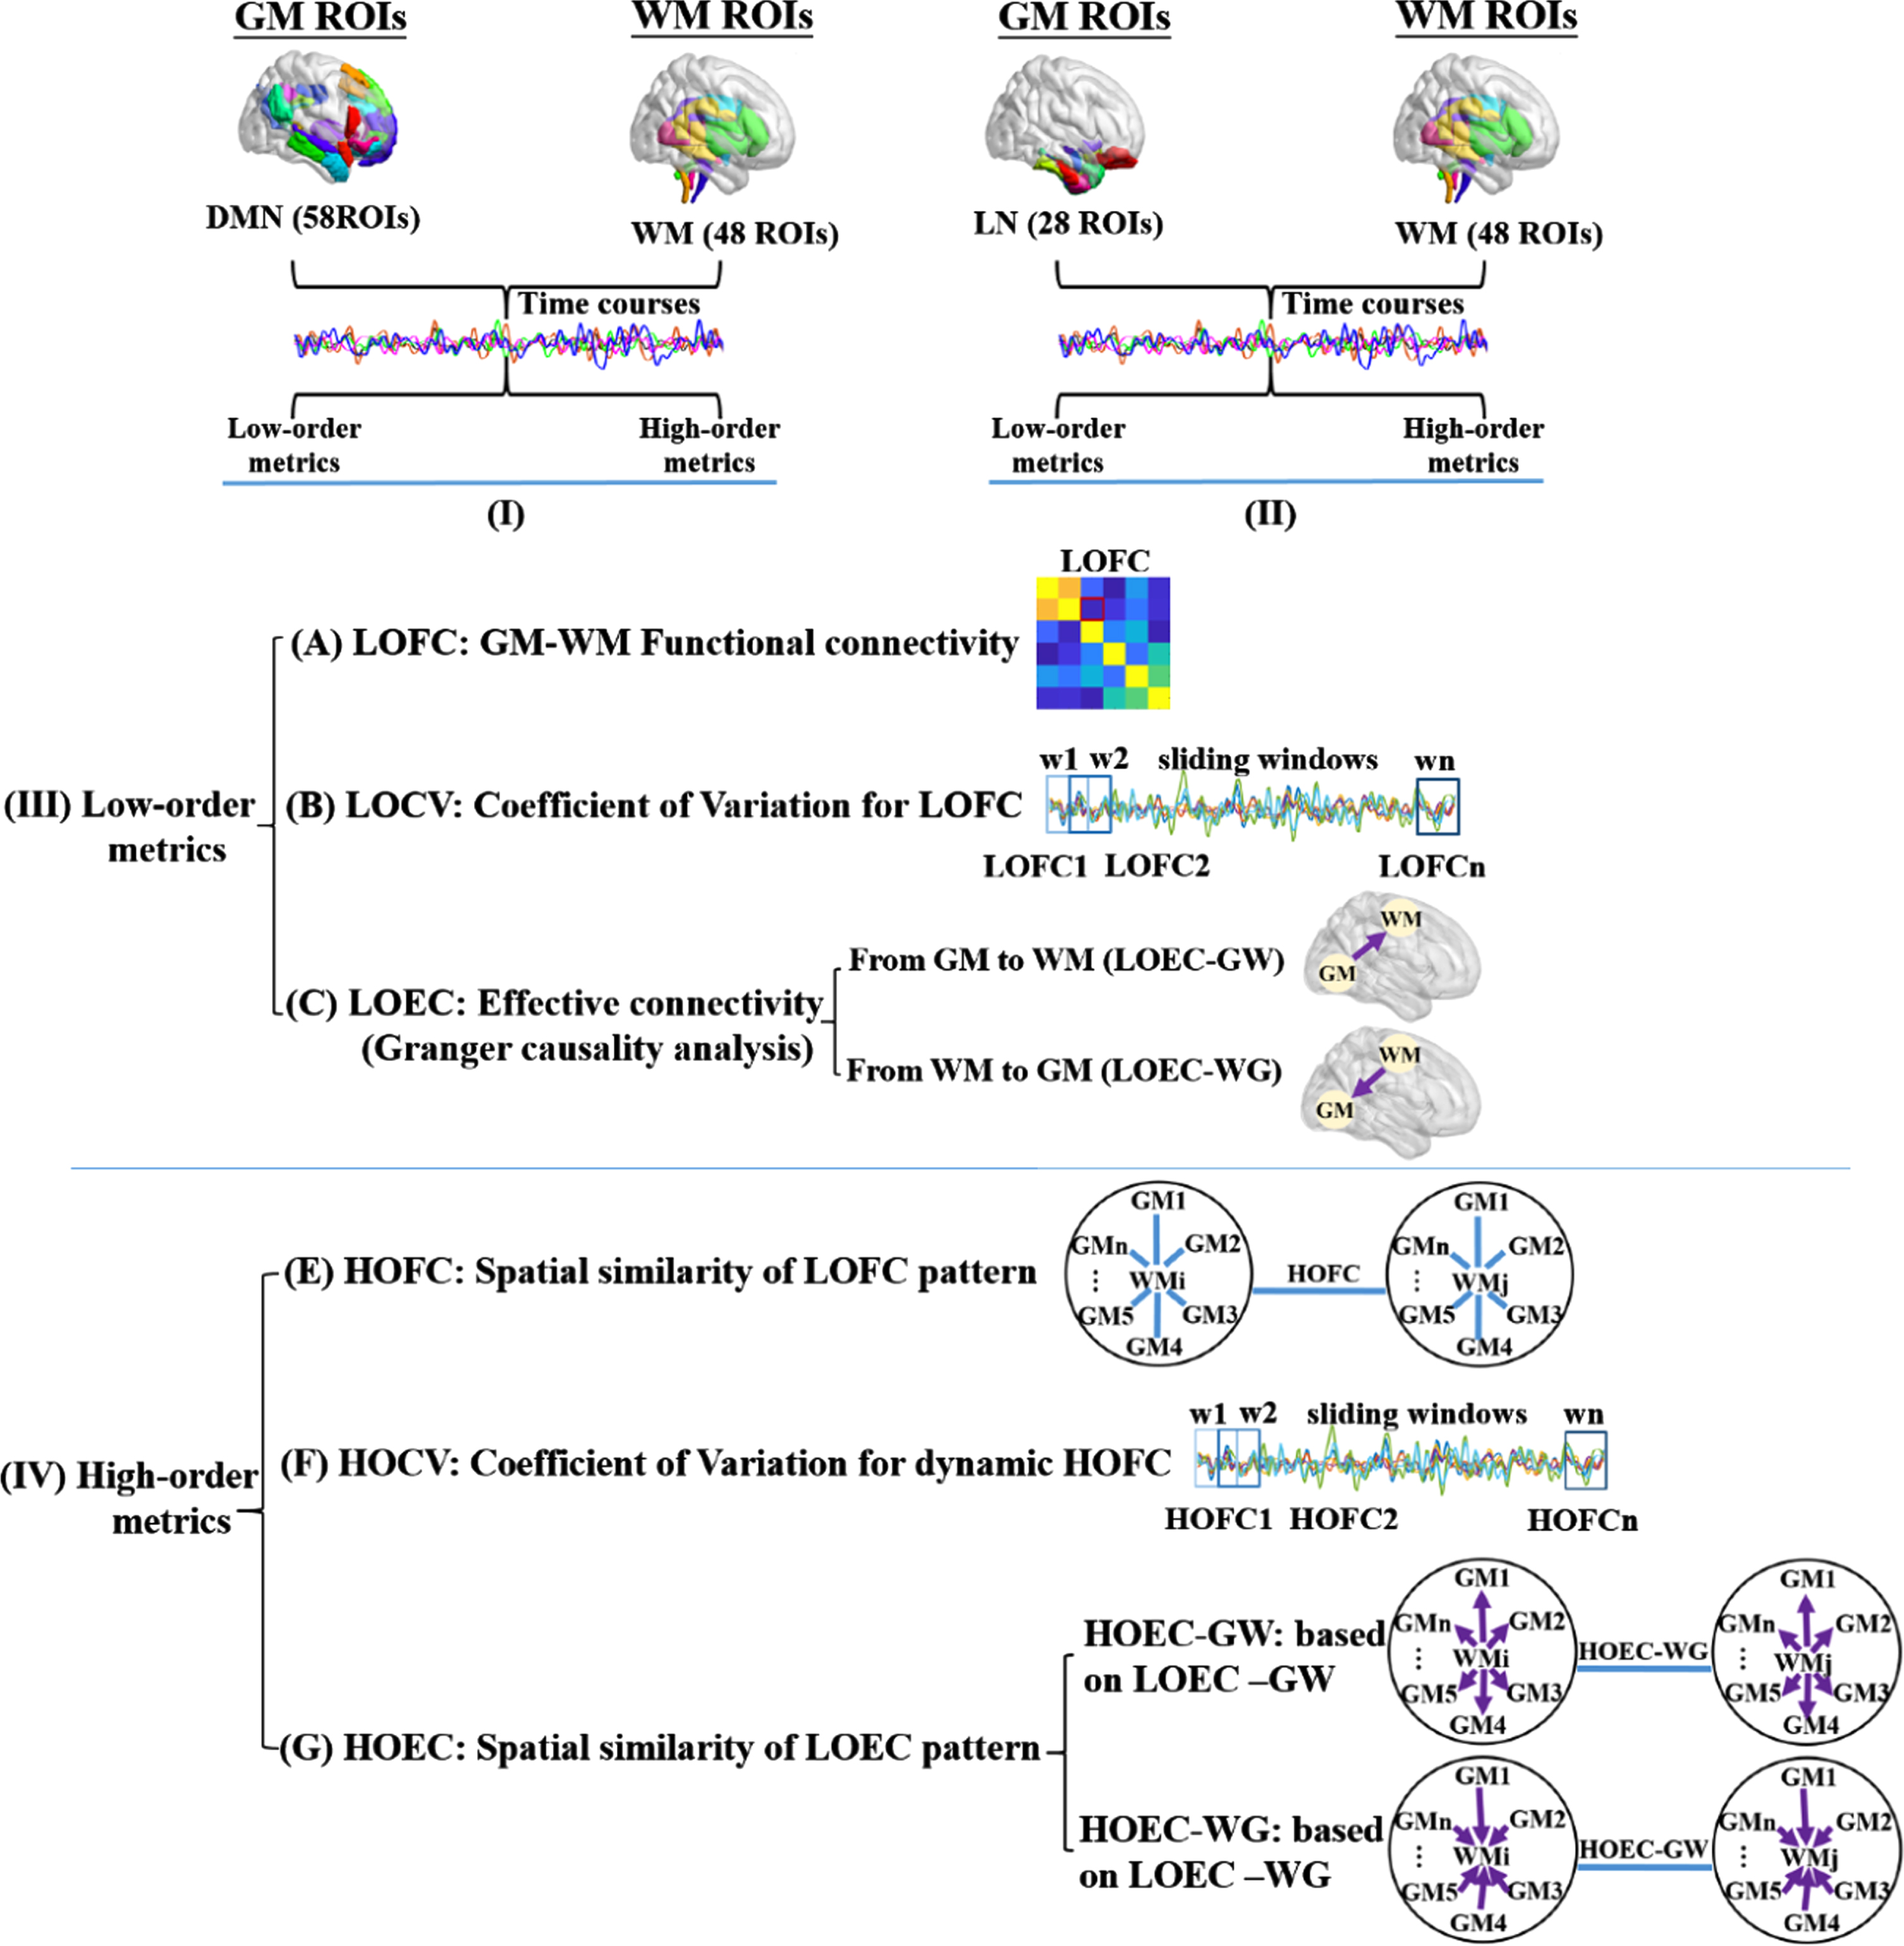
The calculation pipeline of functional connectivity metrics. Every functional connectivity (FC) metric calculated in this study followed this flow diagram. Maps I and II indicated the spatial distribution of whole-brain WM regions and the GM regions in the default mode network (DMN) and limbic network (LN) for the following calculations. Map III indicated the procedure of calculating low-order FC metrics between each pair of GM and WM regions, A) for the static property, B) for the dynamic property, and C) for the directional property. Map IV indicated the high-order FC metrics that described the spatial similarity between each pair of WM regions, based on their correlation patterns with multiple GM regions, D) for the static property, E) for the dynamic property, and F) for the spatial similarity of a pair of WM regions, based on their directional correlation patterns with multiple GM regions.
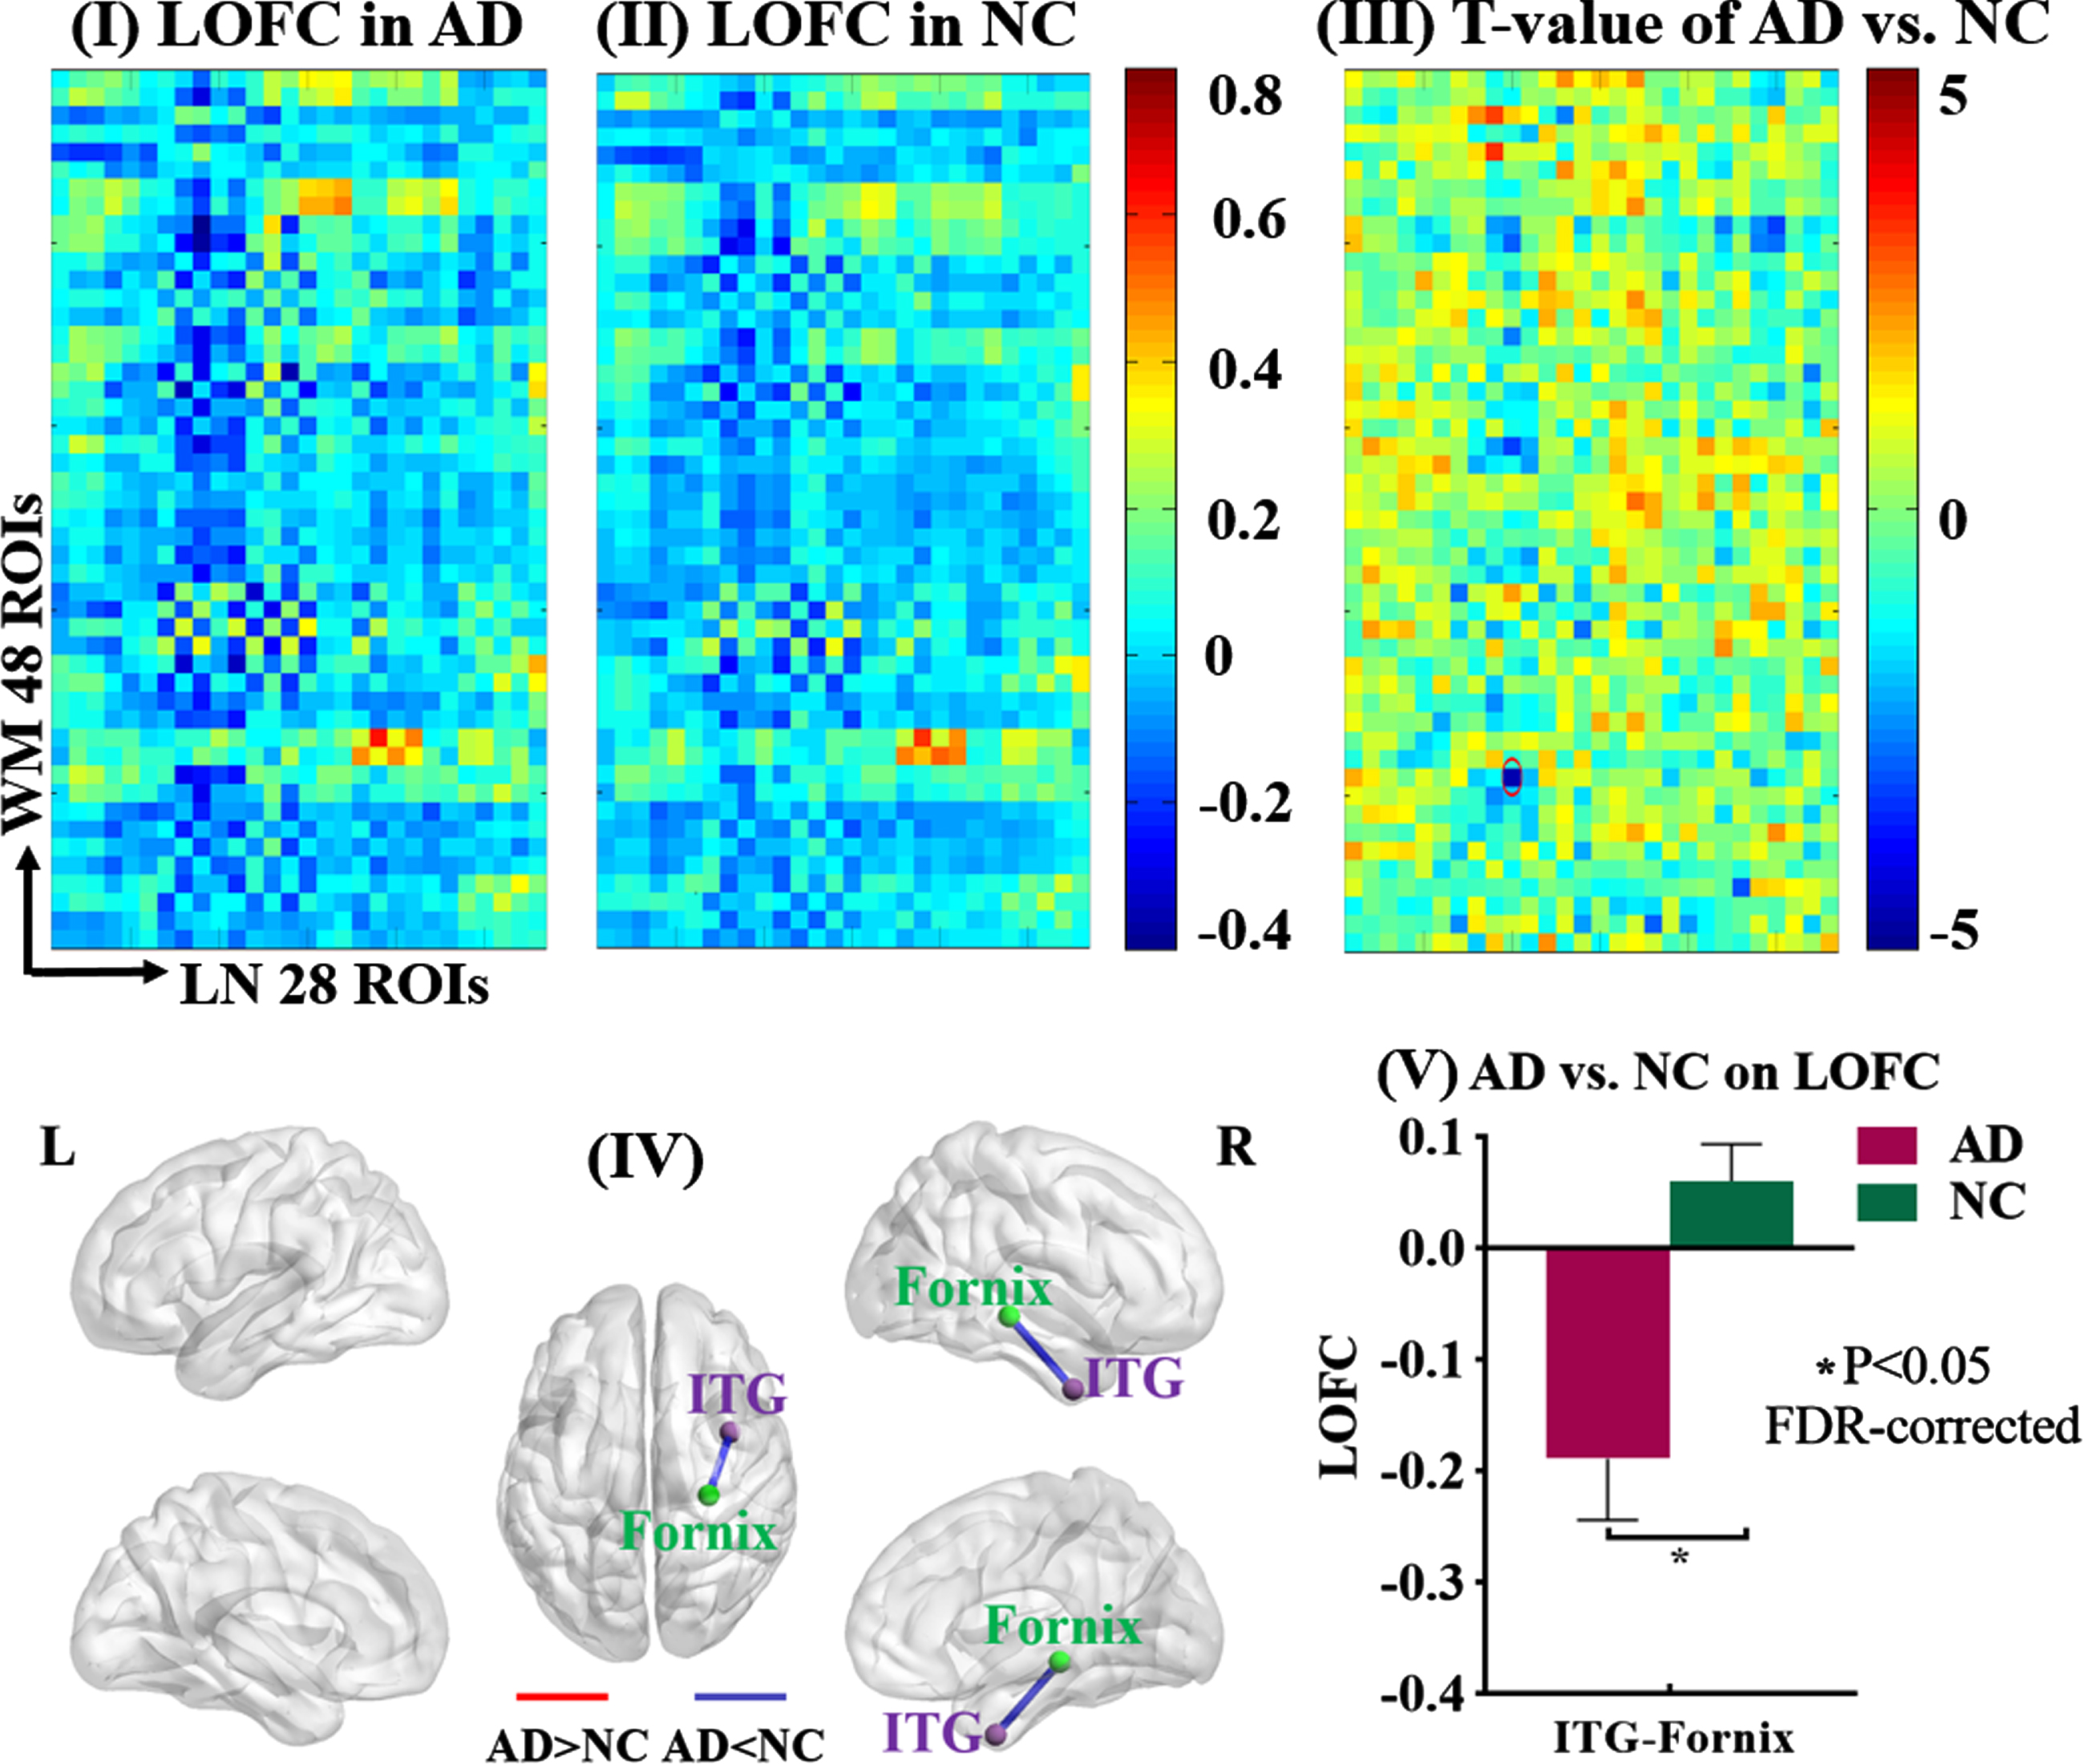
LOFC between GM of the limbic network and whole-brain WM. The static low-order FC (LOFC) between each GM region of the limbic network (LN) and each of the whole-brain WM regions was calculated and compared between AD patients and NC. Maps I and II showed the average LOFC matrices in AD group and NC group, respectively. Map III showed the T-value matrix derived from the comparison between Maps I and II, adjusted for age, gender, mean frame-wise displacement for head motion. The significance threshold was set at p < 0.05 (FDR-corrected). Map IV showed the spatial locations of the GM and WM regions (purple sphere: GM region, green sphere: WM region) whose LOFC was significantly different between the two groups (blue line: AD < NC, red line: AD > NC). Map V showed the mean and standard deviation of that LOFC in each group. ITG, inferior temporal gyrus.
Using the pre-processed rs-fMRI images, we extracted voxel-wise time series from each GM and WM region, and then obtained the average time series of each region using the DPABI software. The Pearson’s correlation coefficient between each GM region in the DMN or limbic network and each WM region was calculated, and then transformed by Fisher-z transformation. As such, two matrices with 58*48 and 28*48 correlation coefficients were obtained for each participant, and the low-order GM-WM FC (LOFC) was generated. This procedure was shown in the calculation pipelines of Fig. 1-III.
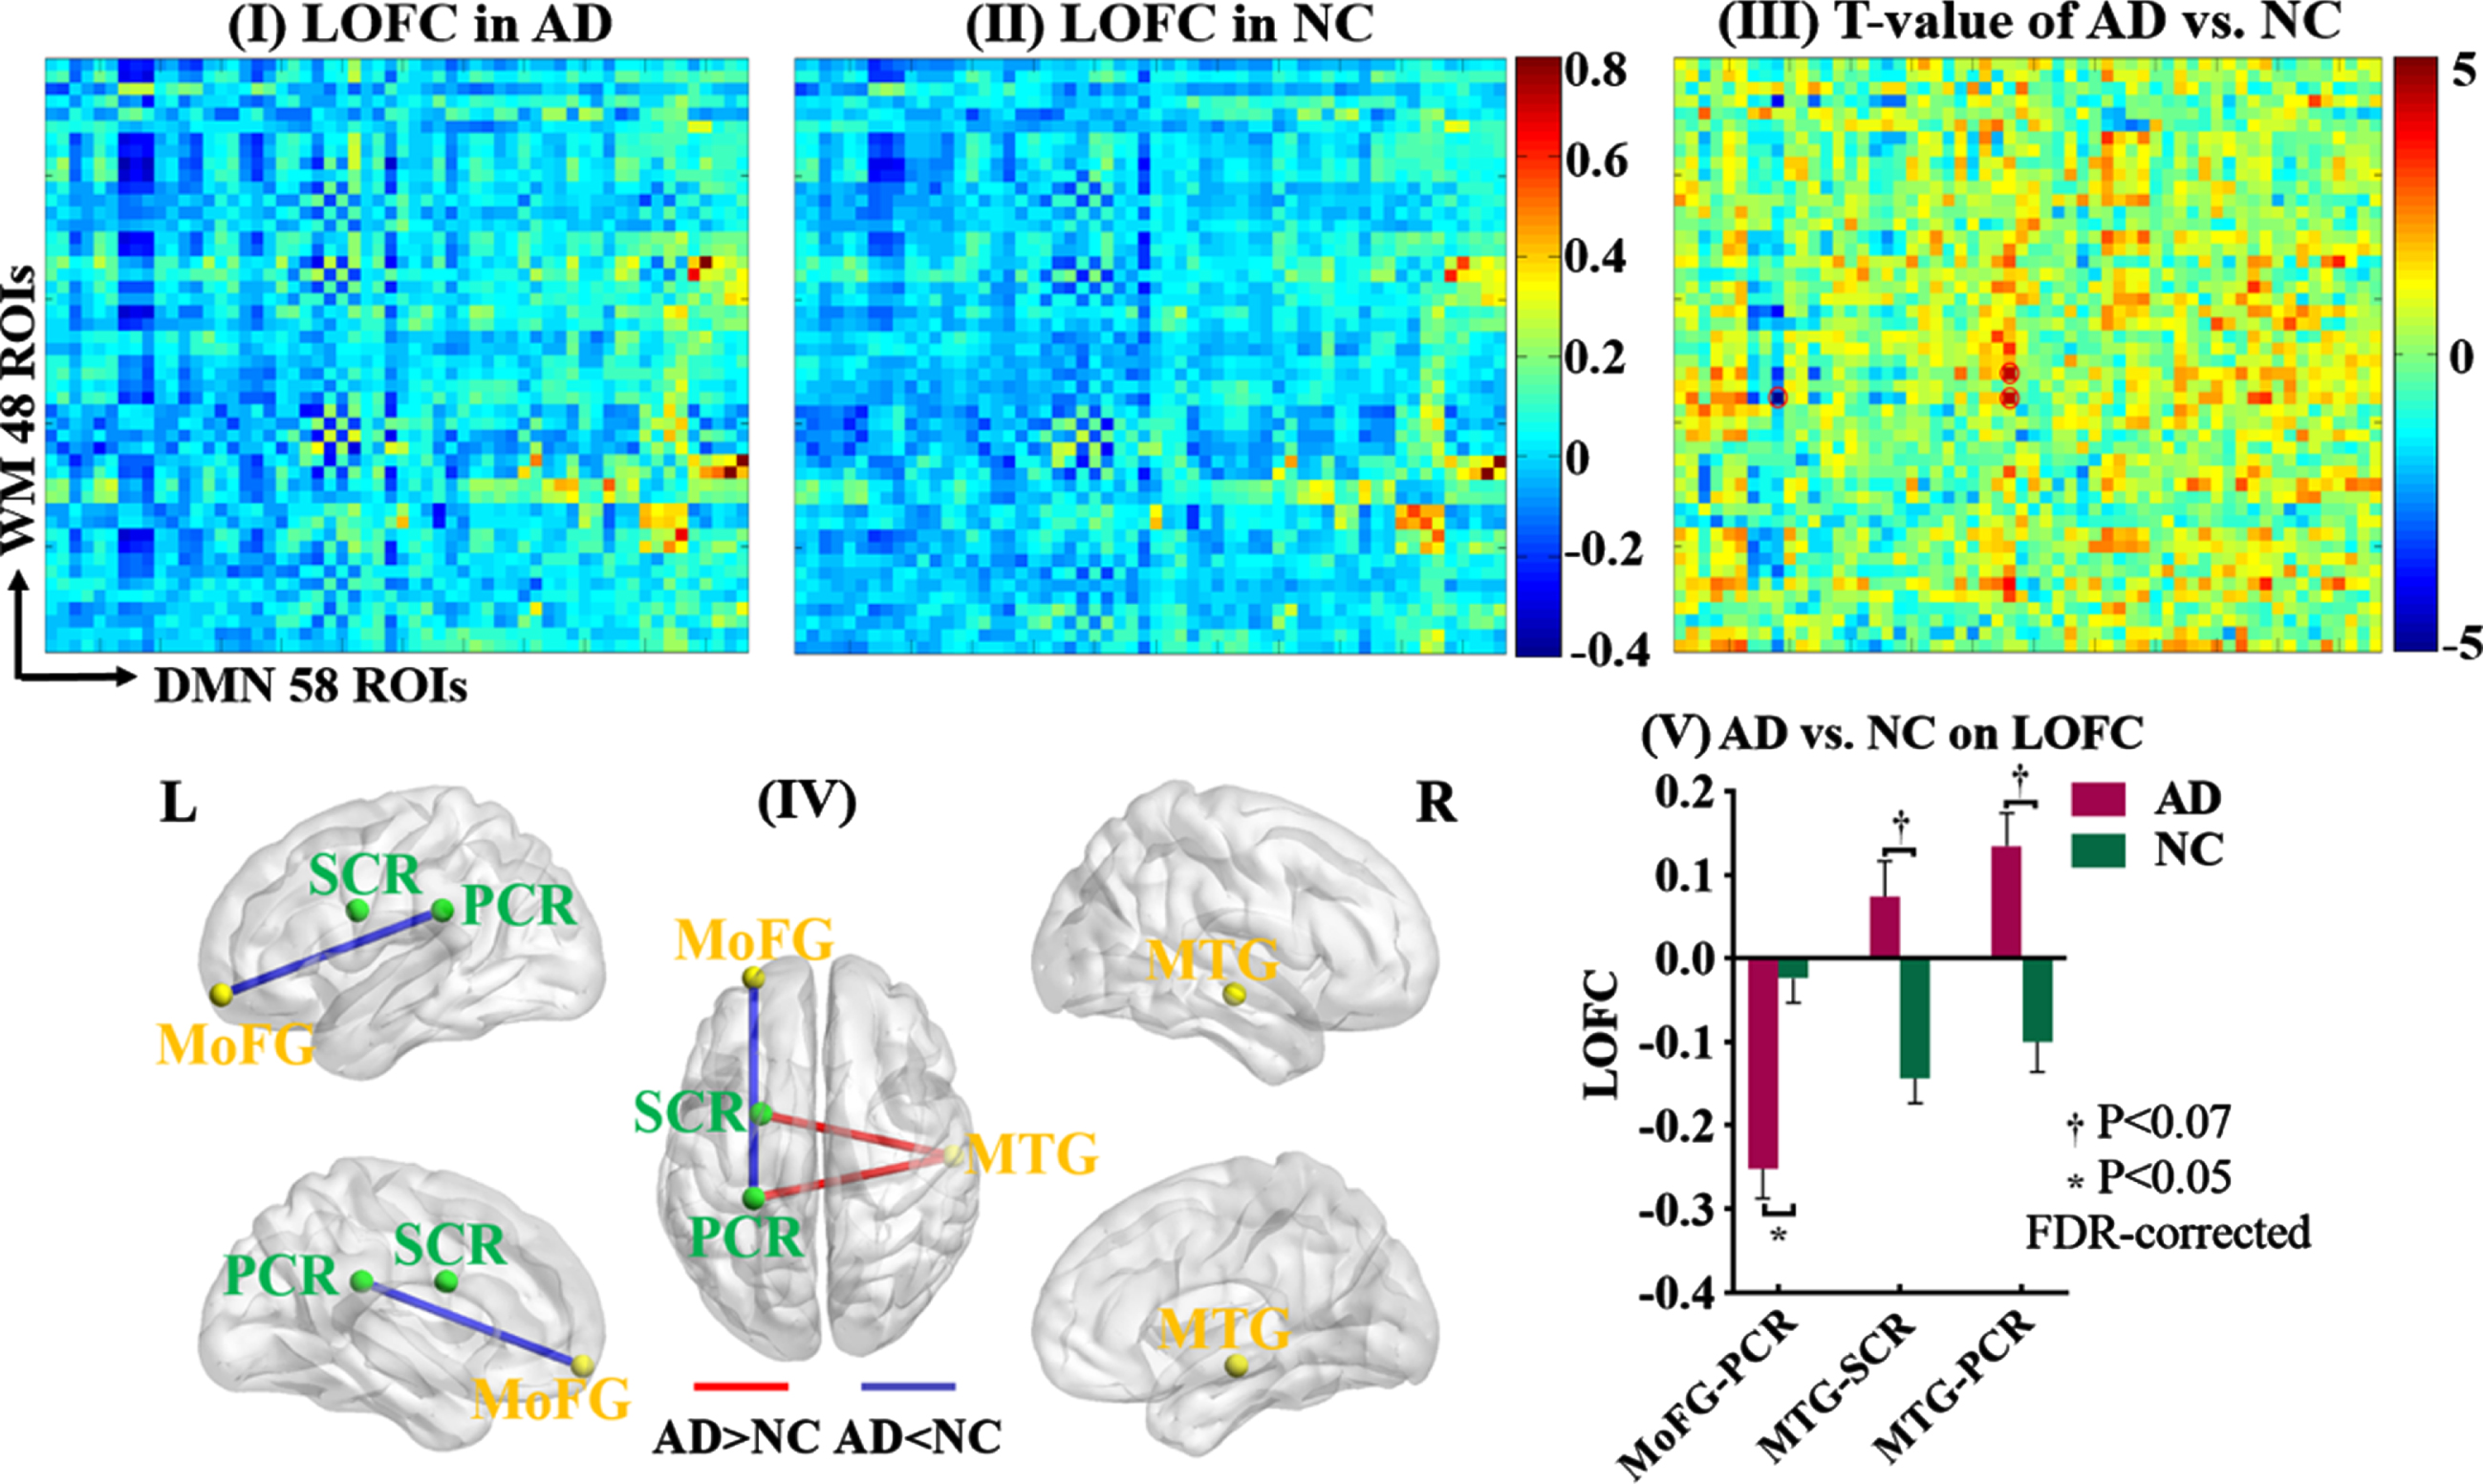
LOFC between GM of the DMN network and whole-brain WM. The static low-order FC (LOFC) between each GM region of the default mode network (DMN) and each of the whole-brain WM regions was calculated and compared between AD patients and NC. Maps I and II showed the average LOFC matrices in AD group and NC group, respectively. Map III showed the T-value matrix derived from the comparison between Maps I and II, adjusted for age, gender, mean frame-wise displacement for head motion. The significance threshold was set at p < 0.05 (FDR-corrected). Map IV showed the spatial locations of the GM and WM regions (yellow sphere: GM region, green sphere: WM region) whose LOFCs were significantly or almost significantly (p < 0.07) different between the two groups (blue line: AD < NC, red line: AD > NC). Map V showed the mean and standard deviation of those LOFCs in each group. MTG, middle temporal gyrus; MoFG, middle orbitofrontal gyrus; PCR, posterior corona radiata; SCR, superior corona radiata.
Dynamic property: Coefficient of variation of low-order FC (LOCV)
Based on the comparison result between AD and NC on the LOFC, we chose the GM-WM pairs whose LOFC showed significant or almost significant differences (p < 0.05 or 0.07, FDR-corrected) to calculate its dynamic property. Based on pre-processed rs-fMRI data, we adopted a sliding-window approach with the time window length (TWL) varying from 30 to 60 s with an incremental length of 1 TR, i.e., 3 s (TWL = 30, 33, 36, .... , 60 s), in order to avoid the arbitrary choice of TWL [48]. Whatever the TWL was, the difference between two neighboring time windows (i.e., step size) was one TR (e.g., TWL = 11TR, the time window ranging as 1∼11TR, 2∼12TR, 3∼13TR ....). The band-pass filter was set at 1/TWL–0.15 Hz to remove spurious fluctuations [49]. Based on the Fisher-z transformation method, the variation of LOFC across all time windows for each TWL was calculated as CV = SD/mean (standard deviation and mean of the LOFC values). Finally, the arithmetic average of CVs for all TWLs was calculated and referred to as the LOCV in this study (see Fig. 1-III for the procedure).
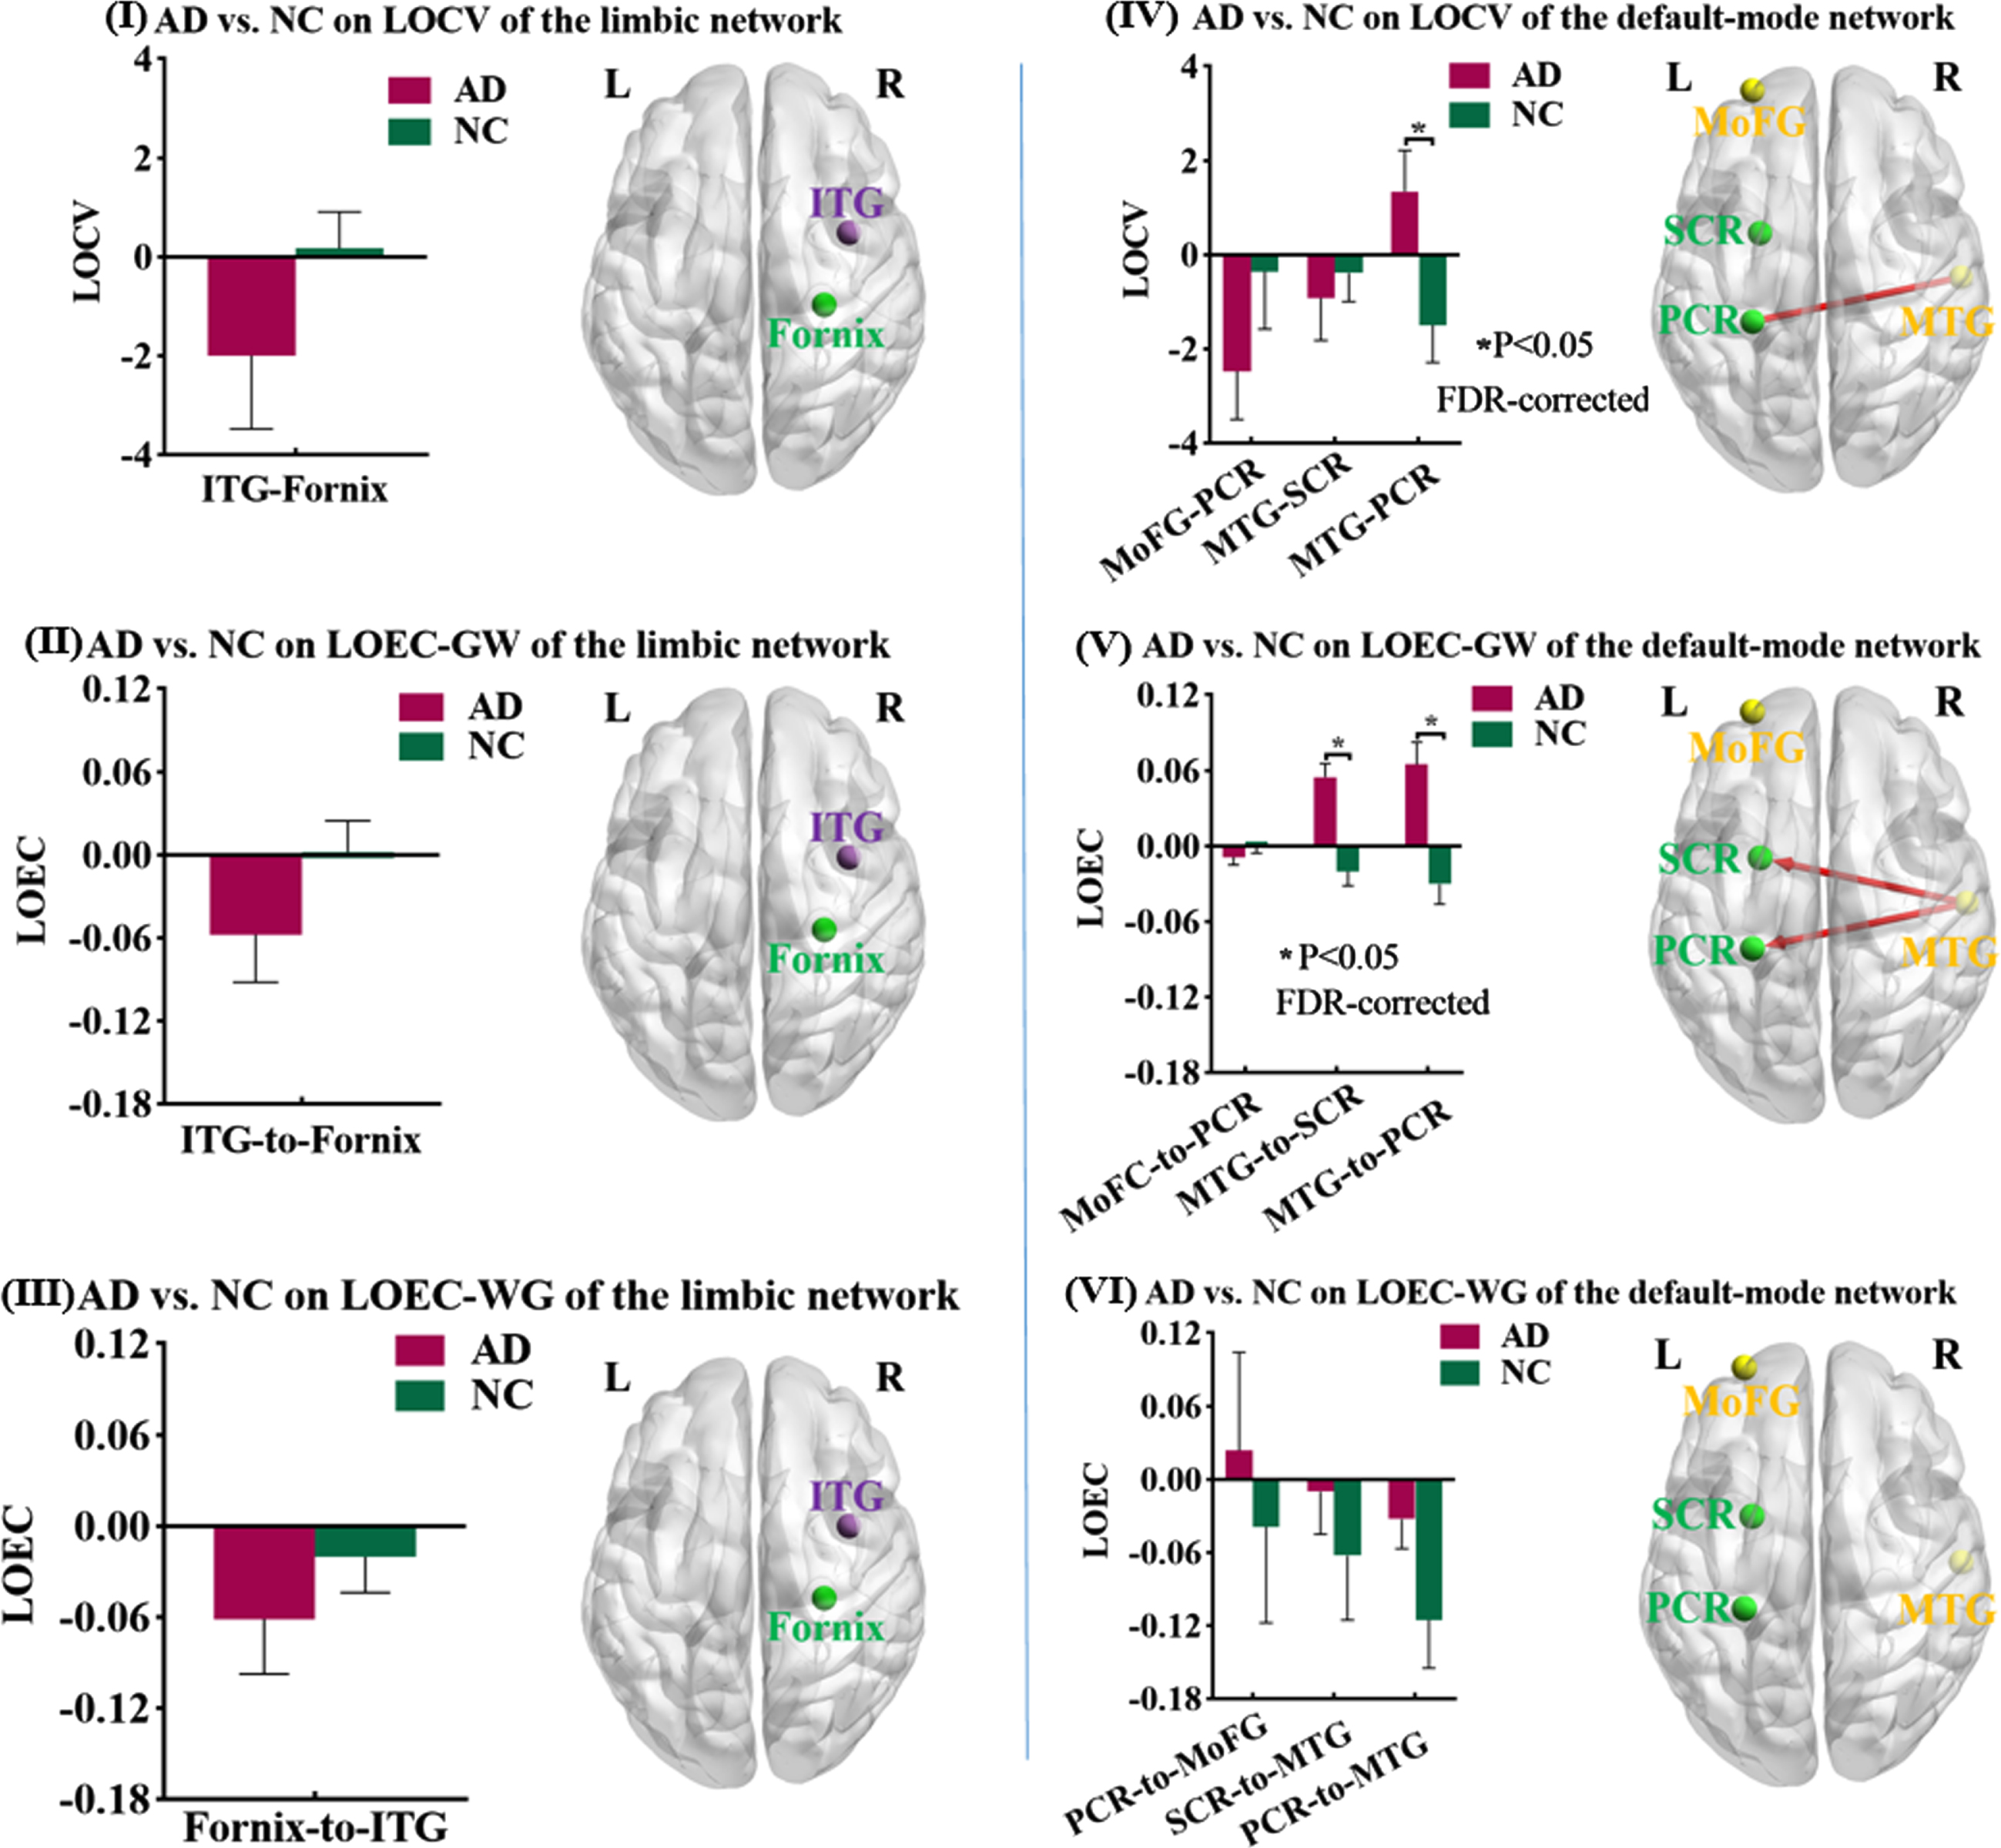
Differences of LOCV and LOEC between AD and NC. Based on the data-driven approach, we found four GM-WM pairs whose static low-order FCs (LOFCs) were significantly or almost significantly different between AD and NC. Their dynamic (coefficient of variation of low-order FC, LOCV) and directional (effective connectivity of low-order FC, LOEC) properties were calculated and then compared between AD patients and NC, adjusted for age, gender, mean frame-wise displacement for head motion. The significance threshold was set at p < 0.05 (FDR-corrected). On the left column, the results were based on the GM regions of limbic network; Maps I, II, and III showed the spatial location of one GM-WM pair, the mean and standard deviation of LOCV, LOEC-GW, and LOEC-WG of that pair and the comparison result (purple sphere: GM region, green sphere: WM region). On the right column, the results were based on the GM regions of DMN; Maps IV, V, and VI showed the spatial location of three GM-WM pairs, the mean and standard deviation of LOCV, LOEC-GW, and LOEC-WG of those pairs in each group and the comparison results (yellow sphere: GM region, green sphere: WM region; red line: AD > NC). ITG, inferior temporal gyrus; MTG, middle temporal gyrus; MoFG, middle orbitofrontal gyrus; PCR, posterior corona radiata; SCR, superior corona radiata.
Directional property: Effective connectivity of low-order FC (LOEC)
Same as the LOCV, the GM-WM pairs that showed significant or almost significant group differences in LOFC were chosen for the directional property calculation. We performed the Granger causality analysis using the REST-GCA toolbox to generate the bivariate first-order coefficient-based EC (http://www.restfmri.net). For a pair of GM and WM regions, two ECs were calculated based on their BOLD signals: the causal effect from Region X to Region Y, as well as the causal effect from Region Y to Region X. A positive EC from X to Y indicates that Region X’s activity exerts an enhancing effect on Region Y’s activity. Meanwhile, a negative EC from X to Y suggests that Region X’s activity exerts an inhibitory effect on Region Y’s activity. The two LOECs for each GM-WM pair were referred to as LOEC-GW for the EC from GM to WM, and vice versa for LOEC-WG (see Fig. 1-III for the procedure).

Static HOFC between two WM regions. The static high-order functional connectivity (HOFC) between any two WM regions based on their correlation patterns with the GM region of DMN were calculated and compared between AD patients and NC. Maps I and II showed the average HOFC matrices in AD group and NC group, respectively. Map III showed the T-value matrix derived from the comparison between Maps I and II, adjusted for age, gender, mean frame-wise displacement for head motion. The significance threshold was set at p < 0.05 (FDR-corrected). Map IV showed the spatial locations for the WM regions whose HOFC was significantly different between the two groups (red line: AD > NC). Map V showed the mean and standard deviation of HOFC for this WM-WM pair in each group.
High-order FC metrics between WM and WM
Static property: High order FC based on LOFC (HOFC)
We employed a high-order FC method, to estimate the similarity of two WM regions on their correlation patterns with multiple GM regions [50]. In the procedure of calculating the LOFC of the DMN network, each column of the matrix represented the correlation pattern of one WM region with 58 GM regions of the DMN network. Next, the Pearson’s correlation was obtained between any two columns and then Fisher z-transformed to generate a 48*48 correlation matrix for each individual. The generated value was referred to as high-order FC between two WM regions (HOFC), signifying the coherence of FC profiles between any two WM regions on their synchronization with the DMN’s GM regions. The same procedure was also applied to the HOFC of 48 WM regions with 28 GM regions of the limbic network (see the calculation pipelines of Fig. 1-IV).
Dynamic property: Coefficient of variation of HOFC (HOCV)
For the WM-WM pair whose HOFC showed significant differences between AD and control group (p < 0.05, FDR-corrected), we examined its temporal variation of HOFC across time windows. Similar to the method of calculating LOCV, we used the sliding-window approach (TWL = 30, 33, 36, .... , 60 s) and variable band-pass filter settings at 1/TWL–0.15 Hz to process the rs-fMRI data. For one WM-WM pair, the correlation pattern between each WM region and multiple GM regions was firstly acquired at each time window. Subsequently, the “correlation of the correlation patterns” of the two WMs was calculated, and its variation across all time windows for each TWL was calculated as CV = SD/mean. Finally, the arithmetic average of CVs across different TWLs was obtained and referred to as the HOCV in this study. This procedure (Fig. 1-IV) was applied separately for the calculation of HOCV with the DMN and limbic networks.
Directional property: High-order FC based LOEC (HOEC)

Differences of HOCV and HOEC between AD and NC. Based on the data-driven approach, we found one WM-WM pair whose static how-order FC (HOFC) was significantly different between AD and NC. Their dynamic (coefficient of variation of high-order FC, HOCV) and directional (effective connectivity of high-order FC, HOEC) properties were calculated and then compared between AD patients and NC, adjusted for age, gender, mean frame-wise displacement for head motion. The significance threshold was set at p < 0.05. Maps I, II, and III showed the spatial location of that WM-WM pair, the mean and standard deviation of HOCV, HOEC-GW, and HOEC-WG of that pair in each group, and the comparison results.
Same as the HOCV, the WM-WM pairs that showed significant group differences in HOFC were chosen for this step. As described above, the BOLD signals between two regions could establish two directions of causality. Each WM region would have two LOEC patterns with multiple GM regions, the LOEC-GW indicating the causal direction from multiple GM regions to one WM region and the LOEC-WG indicating the causal direction from one WM region to multiple GM regions. Therefore, two high-order EC metrics between two WM regions were generated: HOEC-GW (based on their profiles of LOEC-GW) and HOEC-WG (based on their profiles of LOEC-WG). This procedure (Fig. 1-IV) was applied separately for the GM regions in the DMN and limbic network.
Statistical analysis
We compared the differences between AD and NC on the four low-order FC metrics (LOFC, LOCV, LOEC-GW, and LOEC-WG) and four high-order FC metrics (HOFC, HOCV, HOEC-GW, and HOEC-WG), with the False Discovery Rate (FDR) method to correct for multiple comparisons. All analyses were controlled for age, gender, and mean FD of head motion. Regarding the multi-site issue on scanner, we used the image data scanned by 3.0T Philips scanner with the same acquisition parameters to ensure the reliability and consistency. Numerous studies that used ADNI dataset have not controlled the scanner as the covariates [36, 50–52].
Additionally, without the restriction of data-driven approach to specific GM-WM pairs, we compared the differences between AD and NC on the low-/high-order EC and CV metrics for all pairs. Accordingly, the results were corrected for multiple comparisons with the FDR method for all pairs, and were demonstrated in the supplementary materials. Although the analyses of all pairs could provide us with extra information, their assumptions required some caution. According to Friston, the EC should be based on a causal model that describes the dynamics between neural activities [53]. Yet, to estimate the LOEC-GWs of all GM-WM pairs, the assumption would be that all GM regions simultaneously exert influences on all WM regions, which might not fit the biological reality. Regarding the CV, it has been suggested that the time-varying connectivity could appear in randomized regional pairs that shared no temporal information [54], implying the difficulty in interpretation of the LOCVs for all GM-WM pairs. Another problem with the analysis for all pairs was that the results on FC, EC, and CV would be in parallel and may not be relevant to each other.
Correlation analysis with voxel-based gray matter volume and Mini-Mental State Examination (MMSE)
To examine the relationships of these novel FC metrics with the classic structural measure, we employed the voxel-based morphometry (VBM) approach to obtain the voxel-based GM volume using the Statistical Parametric Mapping software (SPM12, http://www.fil.ion.ucl.ac.uk/spm). After the visual inspection for structural abnormalities, the T1-weighted images were segmented using the hidden Markov random field. A series of customized templates and flow fields were then generated using the diffeomorphic anatomical registration through an exponentiated lie algebra (DARTEL) registration method. The images were then registered to the customized templates and normalized to the Montreal Neurological Institute (MNI) space. Finally, the images were smoothed with a 9 mm full-width at half-maximum (FWHM) Gaussian kernel. The correlation analysis between various FC metrics and voxel-based GM volumes was performed in SPM12, controlled for age, gender, mean FD, and total intracranial volume. The multiple correction method was based on Gaussian Random Field, with the significance threshold set at the voxel-level p < 0.005 (uncorrected) with a cluster-level p < 0.05 (FWE-corrected). Additionally, we used two smoothing kernels (FWHM = 12 mm and 6 mm) to pre-process T1 images, and then correlated the voxel-based GM volumes with the cross-tissue FC metrics, to examine the influence of different smoothing kernels on the results of VBM analysis; and the results were shown in the Supplementary Material.
We also performed the correlation analysis between each cross-tissue FC metric and the MMSE score in all participants, controlling for age, gender, and mean FD.
RESULTS
Differences between AD and NC on LOFC
Compared to NC, AD patients showed smaller LOFC between the right inferior temporal gyrus of the limbic network and the right fornix (T = –4.557, p = 0.034, FDR-corrected), as well as smaller LOFC between the left middle orbitofrontal gyrus of DMN and the left posterior corona radiata (T = –4.904, p = 0.020, FDR-corrected). Meanwhile, compared to NC, AD patients showed nearly significantly larger LOFCs for two GM-WM pairs, between the right middle temporal gyrus of DMN and the left superior/posterior corona radiata, respectively (superior corona radiata: T = 4.255, p = 0.068, FDR-corrected; posterior corona radiata: T = 4.341, p = 0.068, FDR-corrected).
Differences between AD and NC on LOCV and LOEC
Based on the group comparison results on LOFC, we calculated the dynamic and directional properties for four pairs of GM and WM regions. The LOCV between the right middle temporal gyrus of DMN and the left posterior corona radiata showed a larger temporal variability in AD than NC (T = 2.600, p = 0.035, FDR-corrected). The LOECs from the right middle temporal gyrus to the left superior and posterior corona radiata showed larger EC in AD patients than NC (to superior corona radiata: T = 4.995, p < 0.001, FDR-corrected; to posterior corona radiata: T = 3.950, p < 0.001, FDR-corrected).
Differences between AD and NC on HOFC, HOCV, and HOEC
We obtained the HOFCs between any two WM regions based on their LOFC profiles with the GM regions in the DMN, and the GM regions in the limbic network, respectively. By comparing these HOFC metrics between the two groups, AD patients showed larger HOFC between the left cingulate bundle and the left tapetum based on their correlations with the DMN’s GM regions (T = 5.122, p = 0.004, FDR-corrected). The HOCV and HOEC metrics for this pair (left cingulate bundle and left tapetum) with the DMN were also computed and then compared between AD and NC. No significant group difference was found on the HOCV metric (T = 0.885, p = 0.380), while the two HOEC metrics were both significantly larger in AD than NC (HOEC-GW: T = 3.626, p < 0.001; HOEC-WG: T = 2.762, p = 0.008).
Correlations analysis of cross-tissue FC metrics with voxel-based GM volume and MMSE
All cross-tissue FC metrics that showed significant difference between AD and NC were correlated with voxel-based GM volumes and MMSE score in all participants. The correlation results for LOFC, LOCV, and LOEC metrics were demonstrated in Fig. 7. Interestingly, the decreased LOFC in AD between the left middle orbitofrontal gyrus and the left posterior corona radiata was positively correlated with MMSE (r = 0.506, p < 0.001) and the GM volumes in the left hippocampus and middle temporal gyrus. The increased FC metrics in AD (including two LOFCs and two LOEC-GWs between the right MTG and the left superior/posterior corona radiata) were negatively correlated with MMSE (r = –0.298 ∼ –0.538, p = 0.052 ∼ < 0.001) and the GM volumes in the left hippocampus and middle temporal gyrus.
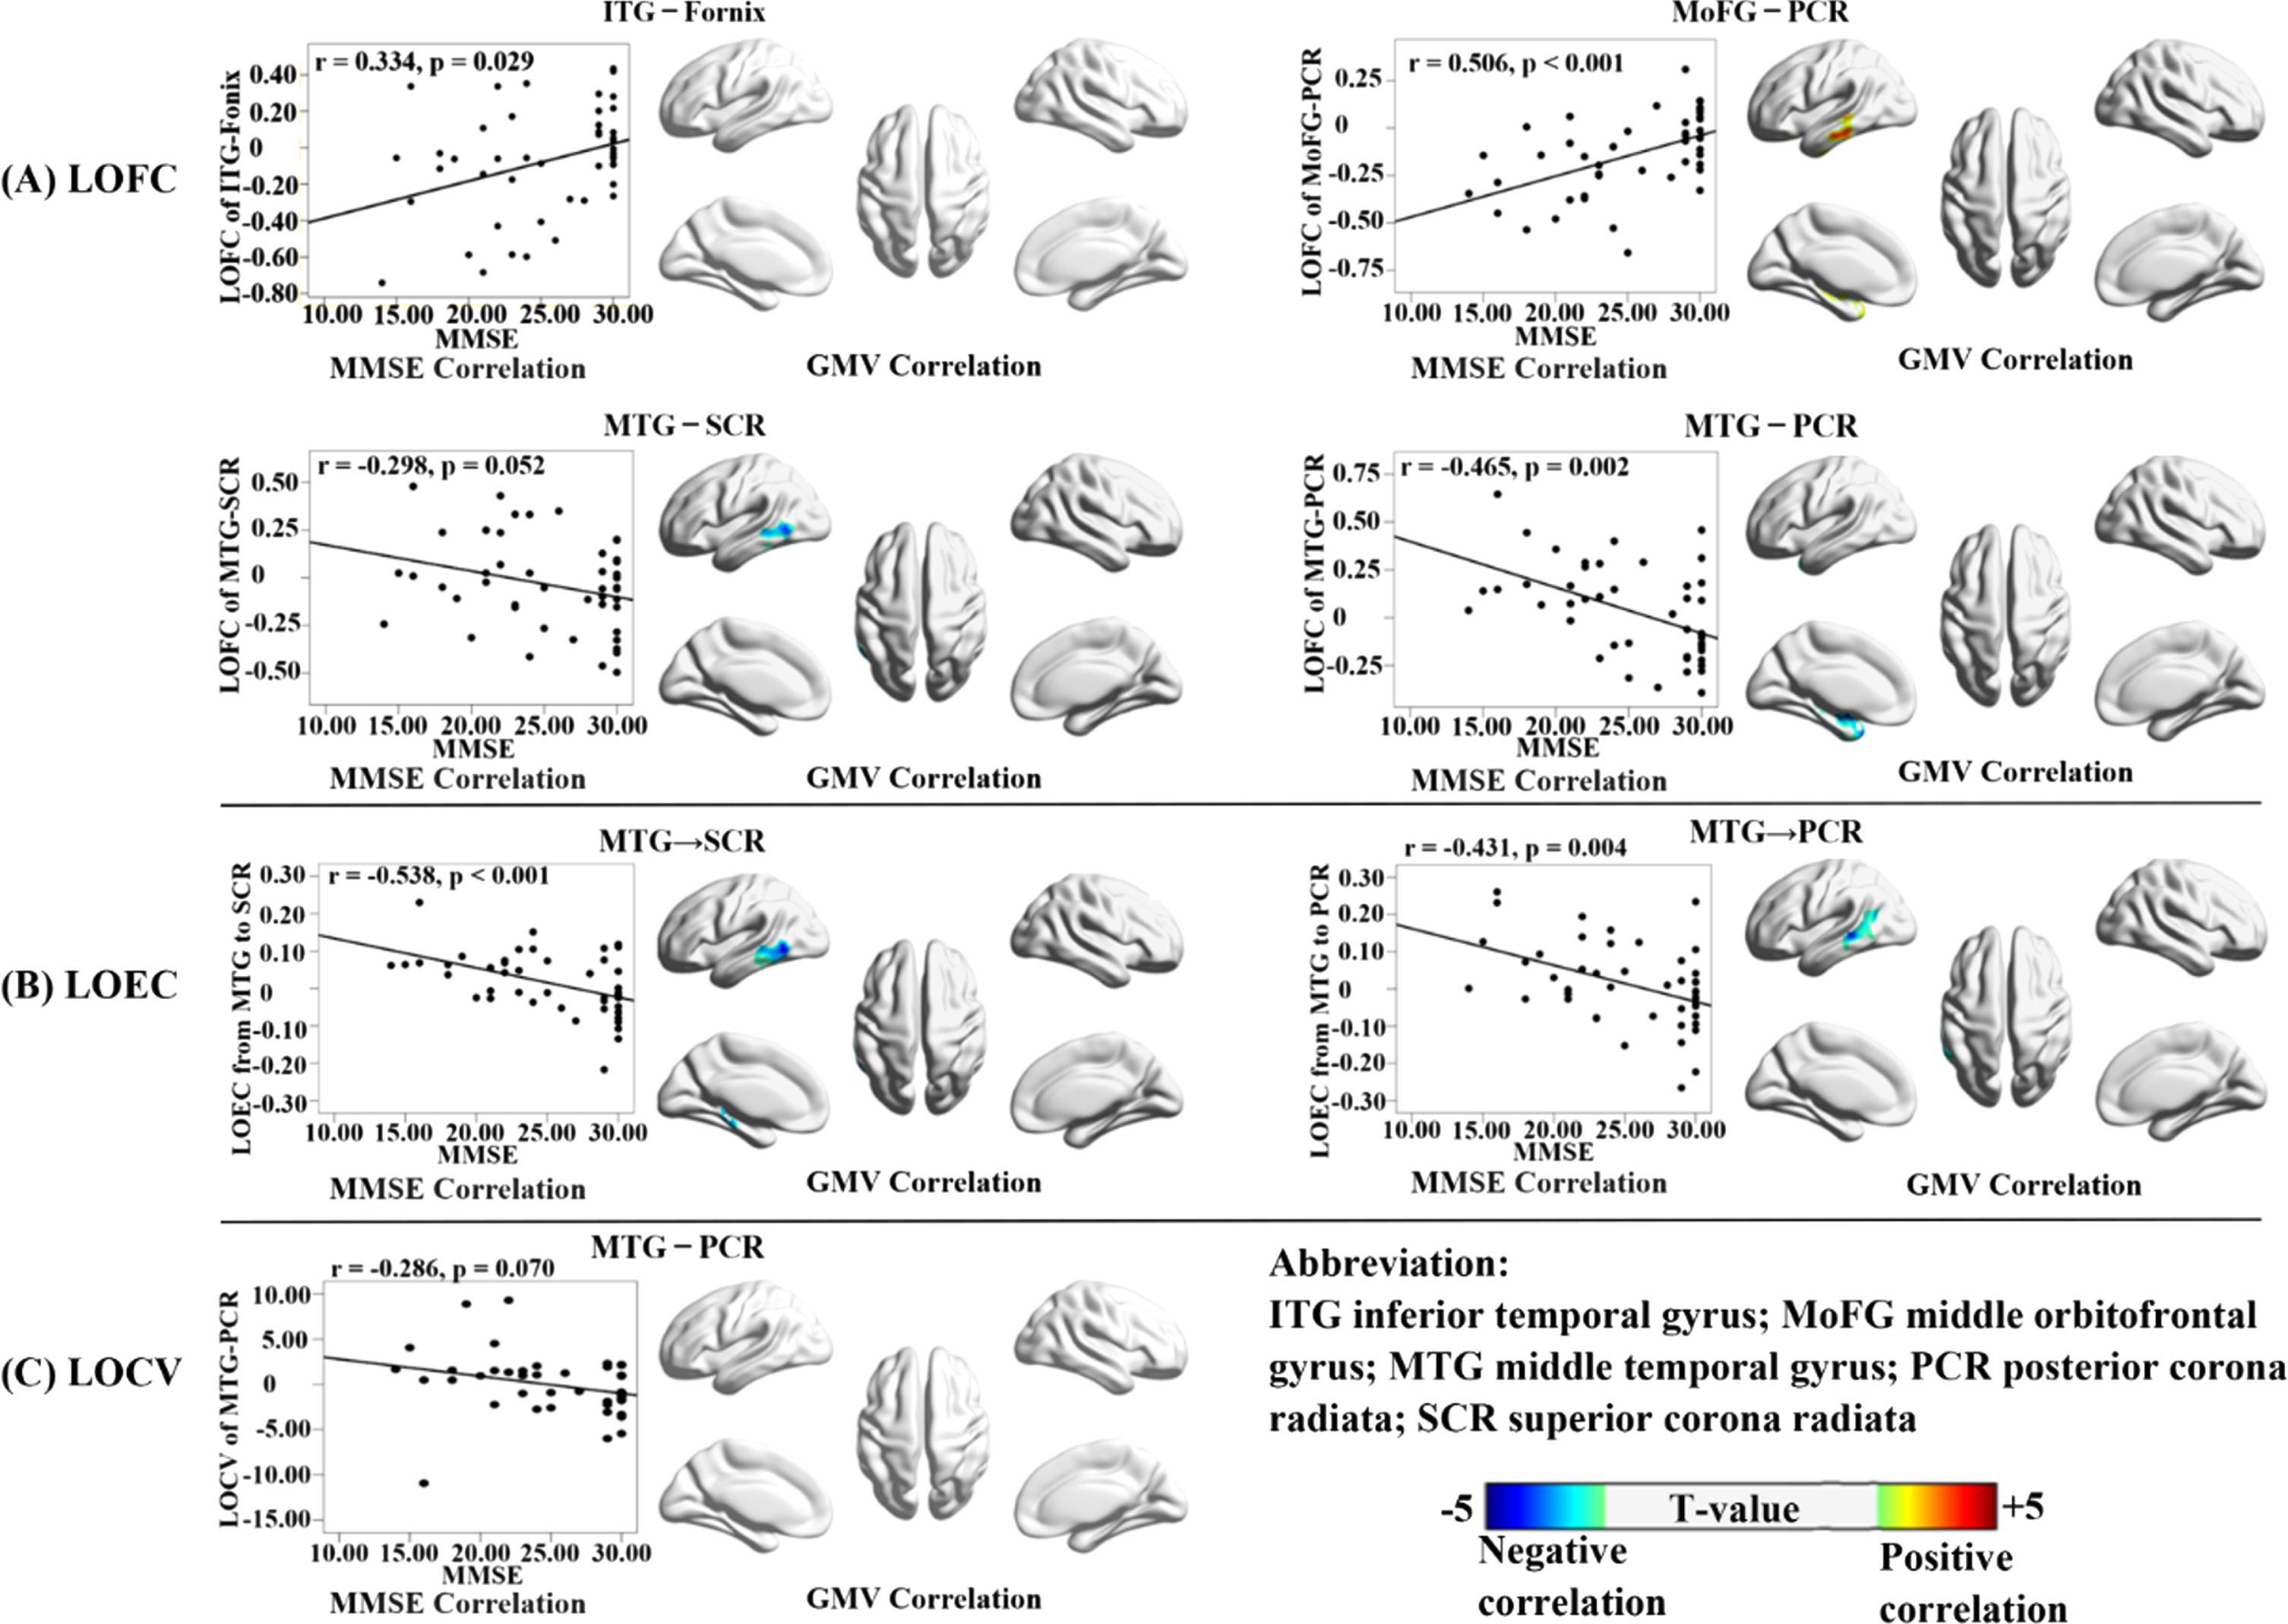
Correlations of LOFC, LOEC, and LOCV with voxel-based GM volumes and MMSE. Each low-order cross-tissue FC metric was correlated with the whole-brain voxel-based GM volumes and MMSE scores in all participants, adjusted for age, gender, mean frame-wise displacement of head motion, and total intracranial volume (only for the GM volumes). The results for three types of FC metrics (LOFC, LOEC, and LOCV) were organized as A, B, and C, respectively. For each metric, the correlation with MMSE was shown in the scatter plot; and the correlation with GM volumes were shown in the 3D brain template, with the color bar indicating the T-value of correlation coefficient (the warm and cold color indicating the positive and negative correlations, respectively). The multiple correction method was based on Gaussian Random Field, with the significance threshold set at the voxel-level p < 0.005 (uncorrected) with a cluster-level p < 0.05 (FWE-corrected).
The correlation results for HOFC, HOCV, and HOEC metrics were demonstrated in Fig. 8. The increased HOFC in AD was significantly negatively correlated with the GM volumes in the left middle temporal gyrus, and negatively correlated with MMSE with a tendency towards significance (r = –0.281, p = 0.068). For the correlation analysis results with voxel-based GM volumes, the location and peak voxels of supra-threshold clusters were provided in Supplementary Table 3.
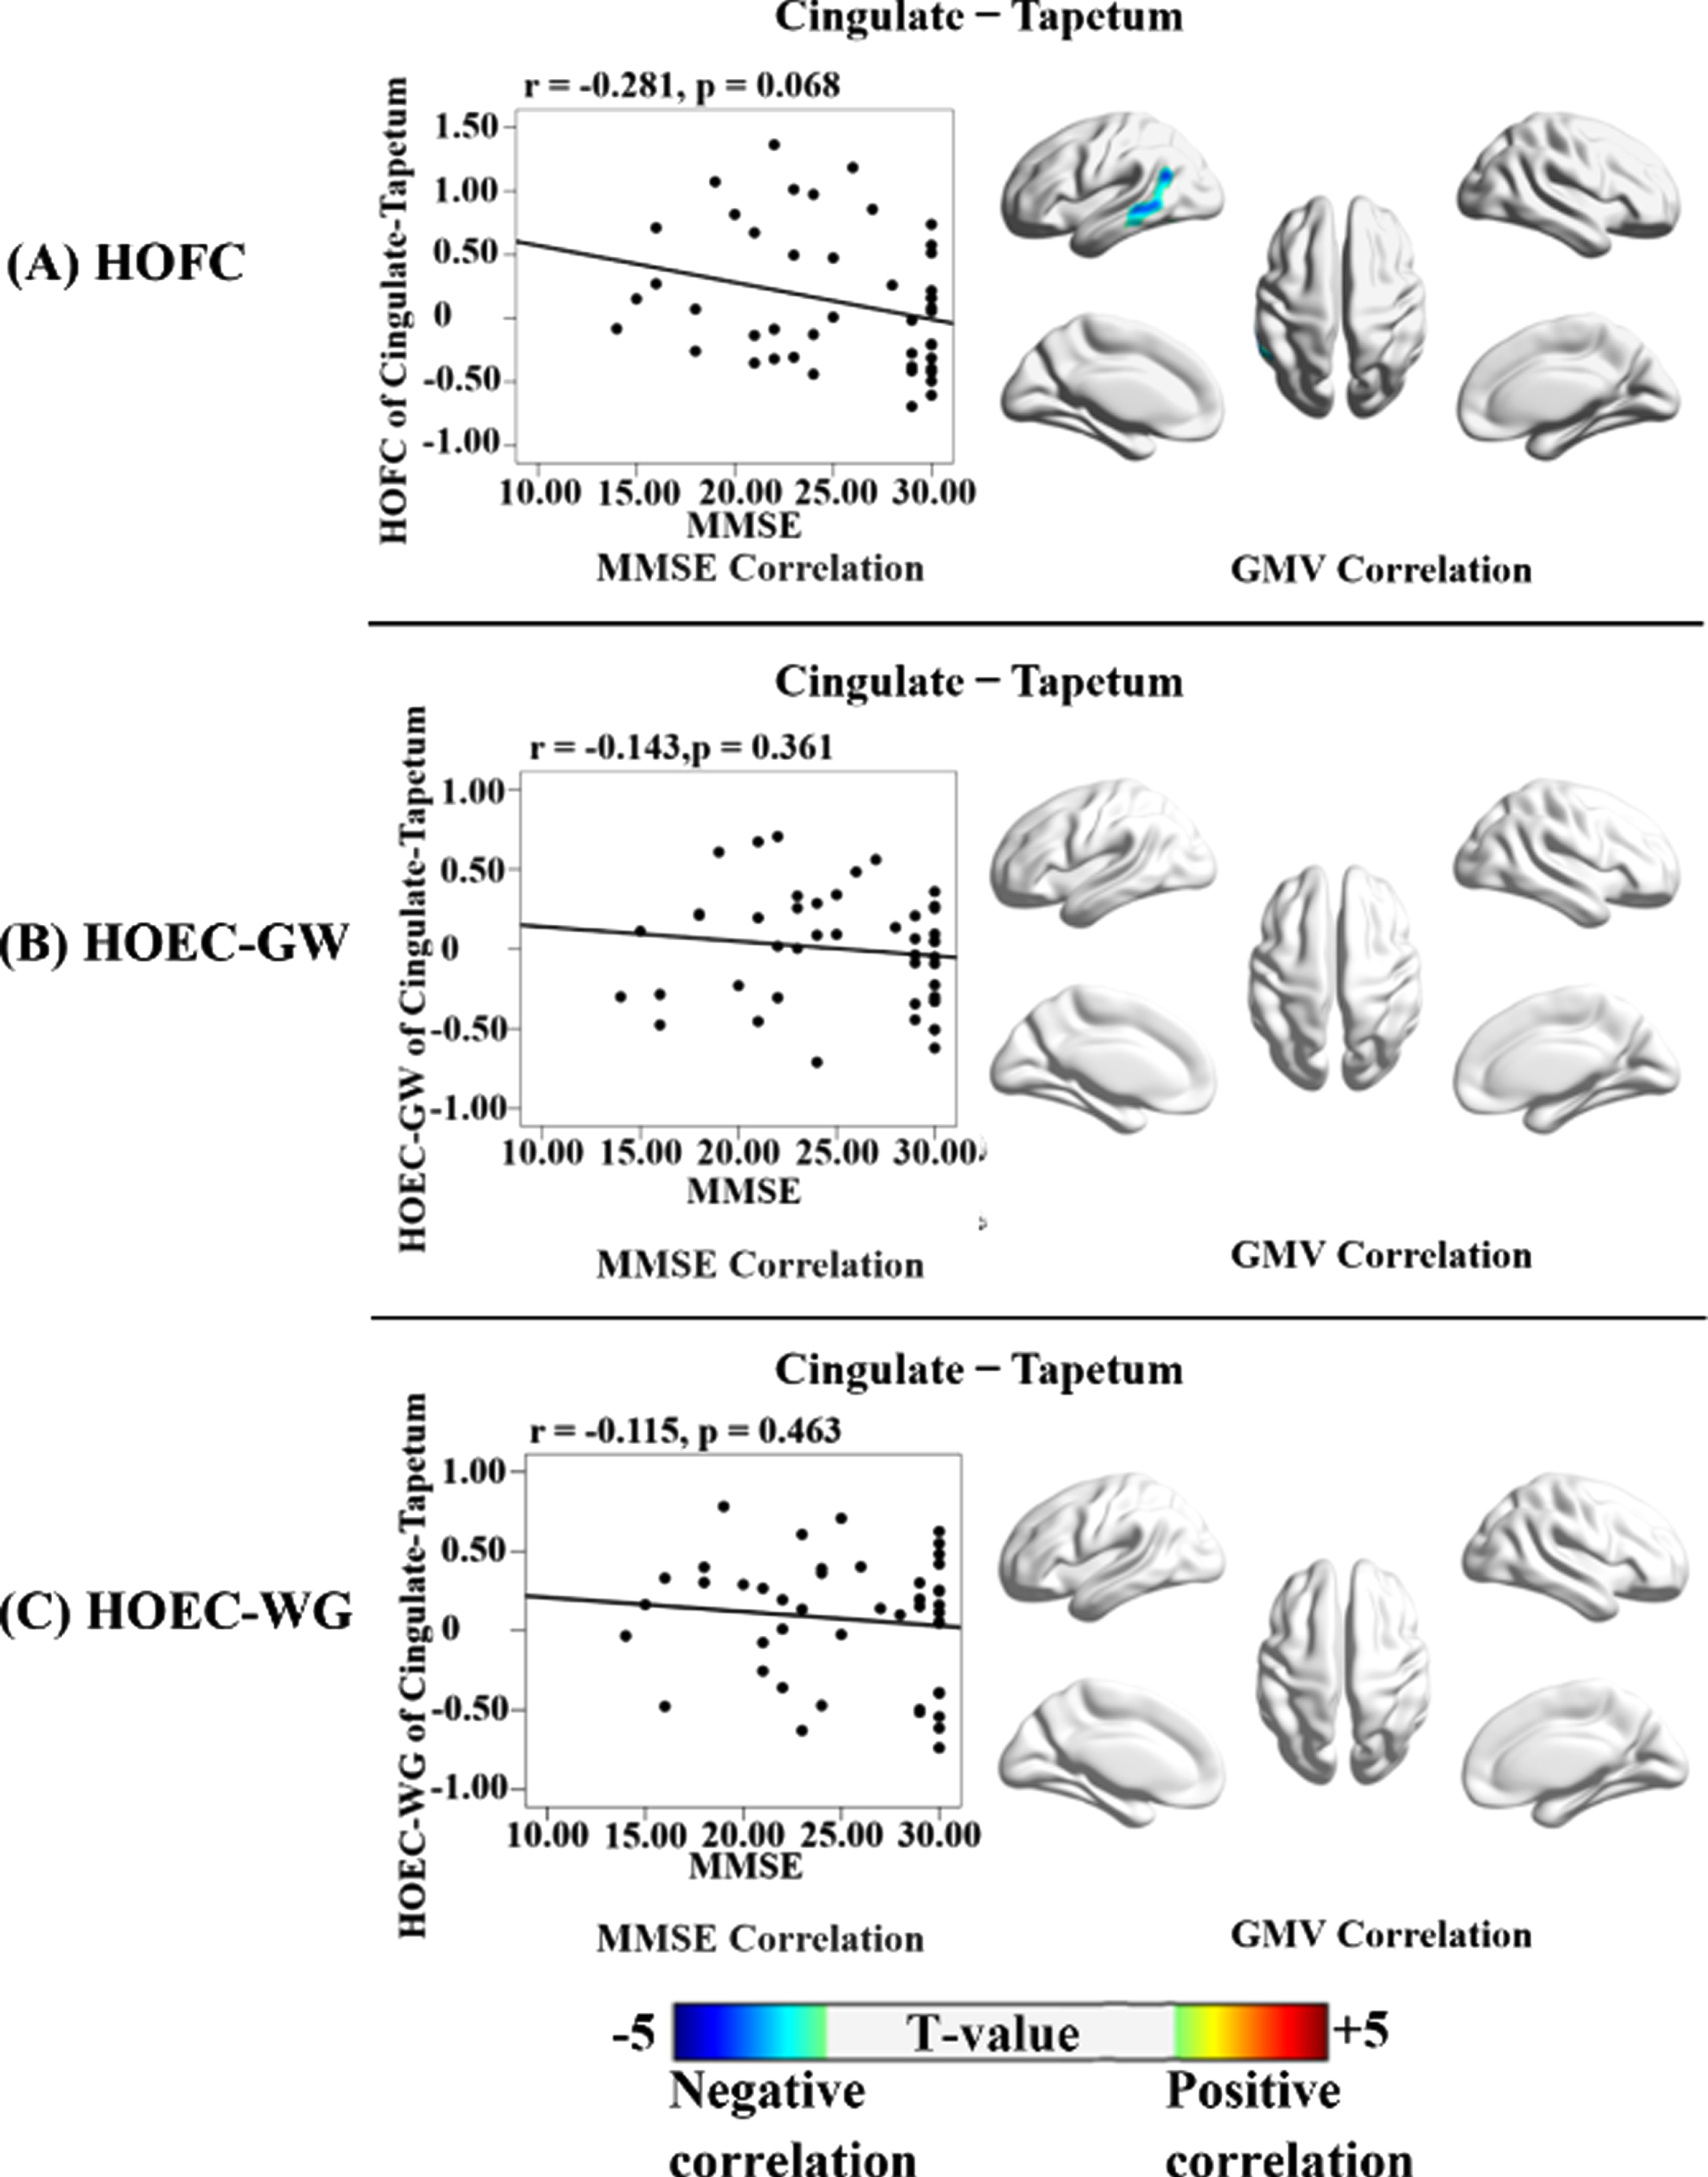
Correlations of HOFC, HOEC-GW, and HOEC-WG with voxel-based GM volumes and MMSE. Each high-order cross-tissue FC metric was correlated with the whole-brain voxel-based GM volumes and MMSE scores in all participants, adjusted for age, gender, mean frame-wise displacement of head motion, and total intracranial volume (only for the GM volumes). The results for three types of FC metrics (HOFC, HOEC-GW, and HOEC-WG) were organized as A, B, and C, respectively. For each metric, the correlation with MMSE was shown in the scatter plot; and the correlation with GM volumes was shown in the 3D brain template, with the color bar indicating the T-value of the correlation coefficient (the warm and cold color indicating the positive and negative correlations, respectively). The correlation analysis was not performed for HOCV, as it was not significantly different between AD and NC. The multiple correction method was based on Gaussian Random Field, with the significance threshold set at the voxel-level p < 0.005 (uncorrected) with a cluster-level p < 0.05 (FWE-corrected).
For the additional correlation analysis between cross-tissue FC metric and voxel-based GM volumes that were pre-processed with different smoothing kernels (FWHM = 12 mm and 6 mm), the results showed that the significant GMV correlates were located in similar brain regions as the results of a 9 mm smoothing kernel, as demonstrated in Supplementary Figure 4.
DISCUSSION
Decreased LOFC of the limbic network in AD
The present study showed that the LOFC between the right inferior temporal gyrus and the right fornix was smaller in AD patients than NC, and this LOFC was positively correlated with cognitive function (measured by the MMSE score). The fornix is a large axonal bundle that constitutes a core element of the limbic circuits as the inflow and output pathway between the hippocampus and the medial temporal lobe [55]. Its demyelination and axonal loss had been consistently identified in AD [56–58]. Meanwhile, the inferior temporal gyrus was involved in memory maintenance and retrieval [59]. The atrophy and synaptic loss in the inferior temporal gyrus were found in AD patients and were associated with memory impairment [60]. The decreased LOFC between the right inferior temporal gyrus and right fornix possibly reflected the disruption in the circuit of memory of AD patients.
Decreased LOFC of the DMN in AD
Our study also showed decreased LOFC between the left middle orbitofrontal gyrus and the left posterior corona radiata in AD patients, compared to NC; moreover, this LOFC was positively correlated with MMSE and the left hippocampal GM volumes. The orbitofrontal cortex has been involved in various cognitive functions, including memory, cognitive control, and decision making, via its massive fiber connections to the cortical and subcortical regions, such as the parahippocampal gyrus, entorhinal cortex, and cingulate cortex [61, 62]. Accumulative evidence supported the involvement of the left posterior corona radiata in cognitive control and memory [63–65]. A greater axonal volume and better myelination in this WM structure were correlated with better working memory performance in healthy adults [66]. The positive relationship between this LOFC and the left hippocampal GM volumes, observed in our study, further corroborated this LOFC’s disruption as a sign of AD pathological changes, given that the hippocampal atrophy was a pathological hallmark of AD patients [60, 67].
Increased LOFC, LOCV, and LOEC of the DMN in AD
Our results showed that two cross-tissue LOFCs were larger in AD patients than NC. They were between one GM region in the right hemisphere (middle temporal gyrus) and two WM regions in the left hemisphere (superior and posterior corona radiata); and the two LOFCs were both negatively correlated with MMSE and the GM volumes in the left hippocampus and left middle temporal gyrus. Moreover, the LOCV for the GM-WM pair (right middle temporal gyrus and left posterior corona radiata) was higher in AD than NC. Furthermore, the directionality from this GM region to both WM regions was stronger in AD, and the two LOEC-GWs were both negatively correlated with MMSE and the GM volumes in the left hippocampus and middle temporal gyrus.
Increased neural activity has been noted in AD and older adults with amyloid deposition, possibly reflecting neural plasticity to alleviate inefficient neural processes [68, 69]. Several studies reported higher neural activation in the right middle temporal gyrus in AD than NC during tasks and rest [70–72]. Evidence showed that the left medial temporal lobe structures showed more severe atrophy and neuropathological damage than their right-sided counterparts did [73, 74]. Hence, the increased neural activity in the right middle temporal gyrus might supplement the contralateral impairment. The superior and posterior corona radiata were both involved in memory via their afferent and efferent projections connecting the ipsilateral cortical and subcortical regions. As such, the increased LOFC metrics between the contralateral GM-WM pairs might serve as a remedy for the left neurodegenerative damages [64, 75–77]. The two GM-WM pairs also showed increased LOCV and LOEC-GWs in AD, implying that their interaction was more flexible and robust, and the direction was starting from the right GM region, proceeding to the left WM regions. Moreover, the negative correlations between the four cross-tissue metrics (two LOFCs and two LOEC-GWs) and the GM volumes in the left hippocampus and middle temporal gyrus further corroborated their compensatory function.
Dichotomy between the decreased and increased LOFCs changes in AD
For the GM regions that were particularly vulnerable in AD, their LOFCs with WM showed both decreased and increased changes. Interestingly, the two types of LOFC changes showed distinctive spatial distribution and structural correlations. The decreased cross-tissue LOFCs were between the intra-hemispheric GM and WM regions, while the increased ones were between the inter-hemispheric GM and WM regions. The decreased cross-tissue LOFCs were positively correlated with the GM volumes in the memory-related regions, while the increased ones were negatively correlated with those GM volumes.
Between the decreased and increased LOFCs in AD patients, we observed a clear dichotomy on the locations of GM-WM pairs, and on their opposite relationships with MMSE and GM volumes. As discussed in the above subsections, we considered that the increased LOFC changes in AD might reflect a complementary mechanism triggered by the neurodegenerative changes that prominently affected the intra-hemispheric structural and functional integrity. In AD patients, the ineffectiveness in the intra-hemispheric cross-tissue communication was possibly accompanied with the enhanced inter-hemispheric connections as compensation. Such consequence of events echoed the model of cascading network failure of AD, which suggested a load-shifting process served as a transient remedy attempting to maintain function [13, 79]. The intra- and the inter-hemispheric difference between the two types of LOFC changes also reminded us of the dedifferentiation theory of aging, which suggests a gradual loss of structural and functional specification [80, 81]. Although our finding could not resolve the debate of various theories and models regarding dementia, it offered new evidence with the cross-tissue FC to help clarify the pathological development of AD.
Increased HOFC and HOEC based on the DMN in AD
No significant difference was shown on the HOFC based on the limbic network’s GM regions. However, based on the correlation patterns with the DMN’s GM regions, we found an increased HOFC between the left cingulum and the left tapetum in AD patients. The cingulum had extensive connections with the bilateral DMN and limbic regions, including the precuneus/posterior cingulate cortex and hippocampus [82–85]. The tapetum contains the splenium and body fibers of the corpus callosum, connecting to the bilateral temporal lobes [77, 86]. Previous studies showed that the tapetum provided the fiber trajectories connecting with the bilateral hippocampi that were closely linked to the DMN [87]. As the cingulum and tapetum were functionally and structurally connected with the DMN, the neurodegenerative changes in the DMN could increase the similarity between the two WM regions [88]. Our finding on the negative correlation between this HOFC and MMSE and the GM volume in the left middle temporal gyrus supported this HOFC as an indicator of neurodegenerative change.
We also found that the directional properties for the WM pair increased in AD patients, with higher HOEC-GW and HOEC-WG. As the cingulum and tapetum interconnected the bilateral memory-related structures, the enhanced similarity in bi-directional cross-tissue FCs possibly implied that the two WM bundles had similar information exchange directions and their roles in the AD brain’s hierarchical organization were comparable.
Limitations
The present study was subject to a few limitations. Firstly, our study’s eligible participants were relatively small, including 30 AD patients and 37 NC drawn from the ADNI database. Secondly, our study restricted the cross-tissue pairs for the GM regions in two networks susceptible to AD damage; nevertheless, more GM regions affected by AD pathology warranted future studies. Thirdly, the ADNI dataset that we used had a relatively long TR (3 s), which might not be optimal to precisely estimate the EC for the GM-WM pairs with a short lag time in their hemodynamic response functions. Nevertheless, the lag time would increase with a longer distance, up to 3 s between the posterior cingulate cortex and the deep WM [89]. In our study, the LOEC-GWs that showed significant differences between AD and NC were located across the bilateral hemispheres. Finally, although the cross-tissue FC and the high-order FC metrics have shown promising applications in diverse research areas, their biological meanings still needed more studies to elaborate.
Conclusion
With the GMs susceptible to neurodegenerative damage of AD as our ROIs, we generated low- and high-order cross-tissue FCs, indexed by their static, dynamic and directional properties. Our findings showed both decreased and increased cross-tissue FCs in AD, which had differential spatial locations and in opposite correlations with the memory-related GM volumes and cognitive function. These decreased and increase cross-tissue FCs were consistent with the neurodegenerative and compensatory changes of AD, suggesting that they could be useful neuroimaging biomarkers.
Footnotes
ACKNOWLEDGMENTS
This study was supported by the National Natural Science Foundation of China (32071100), the Natural Science Foundation of Guangdong Province of China (2020A1515011394), the Shenzhen Fundamental Research General Project (JCYJ20190808121415365), the Shenzhen-Hong Kong Institute of Brain Science-Shenzhen Fundamental Research Institutions grant (2019SHIBS0003) and the Major Project of National Social Science Foundation (20&ZD153). The funders had no role in study design, data collection and analysis, decision to publish, or preparation of the manuscript.
The data used in this study was from the Alzheimer’s Disease Neuroimaging Initiative (ADNI) (National Institutes of Health Grant U01 AG024904) and DOD ADNI (Department of Defense award number W81XWH-12-2-0012). ADNI is funded by the National Institute on Aging, the National Institute of Biomedical Imaging and Bioengineering, and through generous contributions from the following: AbbVie, Alzheimer’s Association; Alzheimer’s Drug Discovery Foundation; Araclon Biotech; BioClinica, Inc.; Biogen; Bristol-Myers Squibb Company; CereSpir, Inc.; Cogstate; Eisai Inc.; Elan Pharmaceuticals, Inc.; Eli Lilly and Company; EuroImmun; F. Hoffmann-La Roche Ltd. and its affiliated company Genentech, Inc.; Fujirebio; GE Healthcare; IXICO Ltd.; Janssen Alzheimer Immunotherapy Research & Development, LLC.; Johnson & Johnson Pharmaceutical Research & Development LLC.; Lumosity; Lundbeck; Merck & Co., Inc.; Meso Scale Diagnostics, LLC.; NeuroRx Research; Neurotrack Technologies; Novartis Pharmaceuticals Corporation; Pfizer Inc.; Piramal Imaging; Servier; Takeda Pharmaceutical Company; and Transition Therapeutics. The Canadian Institutes of Health Research is providing funds to support ADNI clinical sites in Canada. Private sector contributions are facilitated by the Foundation for the National Institutes of Health (![]() ). The grantee organization is the Northern California Institute for Research and Education, and the study is coordinated by the Alzheimer’s Therapeutic Research Institute at the University of Southern California. ADNI data are disseminated by the Laboratory for Neuro Imaging at the University of Southern California.
). The grantee organization is the Northern California Institute for Research and Education, and the study is coordinated by the Alzheimer’s Therapeutic Research Institute at the University of Southern California. ADNI data are disseminated by the Laboratory for Neuro Imaging at the University of Southern California.