
Abstract
Background:
Amyloid-β (Aβ) and tau protein accumulation in the brain is thought to be one of the causes of Alzheimer’s disease (AD). Recent study found that the glymphatic system was waste drainage system in the brain and promoting the elimination of Aβ and tau protein.
Objective:
We evaluated the relationships between the glymphatic system activity and the Aβ and tau protein deposition.
Methods:
Subjects were 21 patients with AD and 36 healthy subjects who underwent diffusion tensor imaging (DTI) scan and the positron emission tomography (PET) using with the Aβ tracer: 11C-PiB and the tau/inflammatory tracer: 18F-THK5351. We computed diffusion tensor image analysis along the perivascular space (DTI-ALPS) index as the proxy of glymphatic system activity, and estimated the relationships between the DTI-ALPS index and Aβ and tau protein/inflammatory deposition.
Results:
We found significant negative correlations between DTI-ALPS index and the standard uptake value ratio (SUVR) of 11C-PiB in the bilateral temporal and left parietal cortices and left posterior cingulate gyrus in all subjects. Further, we detected significant negative correlations between DTI-ALPS index and the SUVR of 18F-THK5351 in the bilateral temporal cortices and right parietal cortex in all participants, too.
Conclusion:
Our data suggested that DTI-ALPS index was a good biomarker for the evaluation of Aβ and tau deposition and neuroinflammation, and this marker might be effective to estimate the glymphatic system activity.
Keywords
INTRODUCTION
Alzheimer’s disease (AD) is the most common neurodegenerative disorder in the world. Senile plaques, deposits of amyloid-β (Aβ), and neurofibrillary tangles, derived from hyperphosphorylated tau protein, are neuropathological hallmarks of AD [1]. In general, senile plaques were widely distributed throughout the cortex in temporal and occipital lobes > parietal lobe > limbic and frontal lobes> >hippocampus [2]. On the other hand, the neurofibrillary tangles occur in the transentorhinal area, followed by the involvement of the entorhinal cortex and hippocampus, progressing to the temporal cortex and the other cortical areas [3]. To estimate the deposition of Aβ, and tau protein in the brain with AD in vivo, several positron emission tomography (PET) studies using with radioligand 11C-PiB, 18F-forbetaben and 18F-Florbetapir, for the calculation of Aβ [4], and with 18F-THK-5117, 18F-THK-5351, and 18F-PMBBB3, for the tau deposit, were performed [4–7]. It is known that the patients with AD show increased amyloid-tracer uptake in the medial orbitofrontal, posterior cingulate gyrus/precuneus, striatum, lateral temporal, and parietal gray matter [4] and increased tau-tracer uptake in the temporal cortex [5–7].
Previous studies found that the brain-wide perivascular pathway, termed the glymphatic system, that facilitates the recirculation of cerebrospinal fluid through the brain parenchyma and supports the clearance of interstitial solutes including Aβ and tau [8–10]. Furthermore, a recent study showed the novel technique “diffusion tensor image analysis along the perivascular space (DTI-ALPS)” that evaluate the activity of the glymphatic system by using DTI scan [11]. One study showed the reproducibility of DTI-ALPS [12], and another study showed the relationship between the DTI-ALPS index and glymphatic clearance function calculated by comparing the signal intensity on MRI before and after intrathecal injection of gadolinium [13]. In the clinical studies, DTI-ALPS index showed the disease-related decrease in AD [11, 14], Parkinsonian syndrome [15, 16], and idiopathic normal pressure hydrocephalus [17, 18]. However, there was no study that evaluate the relation between the DTI-ALPS index and the accumulation of Aβ and tau protein.
In this study, we investigated the relationships between the glymphatic system activity estimated by the DTI-ALPS index and the deposition of Aβ and tau protein calculated by the PET analyses in the patients with AD. Our hypotheses were that the DTI-ALPS index was negatively correlated with the deposition of Aβ and tau protein and neuroinflammation in the temporal and parietal lobes where these causative agents were easy to deposit in the AD brain.
Methods
Participants
This prospective study was approved by the ethics committee of the National Center of Neurology and Psychiatry, Japan. Thirty-seven patients with neurocognitive disorder and 49 healthy subjects and underwent brain MRI scan and PET scans with 11C-PiB and 18F-THK5351. Diagnosis of probable AD was based on the clinical criteria outlined by the National Institute on Aging-Alzheimer’s Association (NIA-AA) [19]. All participants were rated with the Japanese version of the Mini-Mental State Examination (MMSE-J) [20], the Clinical Dementia Rating (CDR) scale [21], and the Japanese version of the Montreal cognitive assessment (MOCA-J) [22]. Participants were excluded if they had a prior medical history of central nervous system disease or severe head injury, or if they met the criteria for substance abuse or dependence. Thirteen out of 37 patients with neurocognitive disorder were diagnosed as mild cognitive impairment (MCI), 3 out of 37 showed medium ischemic changes in the white matter. As for healthy subjects, 5 subjects out of 49 healthy subjects were diagnosed as slight cognitive impairment (MOCA-J<25 or obvious decline of short-term memory), 6 out of 49 showed medium ischemic changes in the white matter, 1 subject was excluded due to motion artifacts, and 1 subject was omitted owing to the high SUVRs of 11C-PiB (over 1.5). Finally, 21 patients with AD and 36 cognitively normal healthy subjects were enrolled in the analyses. Demographic and clinical characteristics of the participants are presented in Table 1. After the study was explained to each participant, his or her written informed consent was obtained for participation in the study. This study was performed in accordance with the Declaration of Helsinki.
Demographic and clinical characteristics of subjects
AD, Alzheimer’s disease; MMSE, Mini-Mental State Examination; MOCA-J, Montreal cognitive assessment-Japanese version; SUVR, standard uptake volume ratio; DTI-ALPS, diffusion tensor image analysis along the perivascular space.
MRI study
The MR studies were performed on a 3-Tesla MR system (Verio, Siemens, Erlangen, Germany). High spatial resolution 3-dimensional (3D) T1-weighted images were acquired in the sagittal plane under the following conditions: repetition time [TR] / echo time [TE], 1900 / 2.52; flip angle, 9°; 256×256; field of view [FOV], 250×250 mm; effective section thickness, 0.98 mm; 192 contiguous slices through the brain, number of signals acquired, 1. For the diffusion imaging, DTI was performed in the axial plane (TE/ TR: 93/17,700 ms, field of view (FOV): 224×224 mm2; matrix: 114×114, 74 continuous transverse slices; slice thickness 2 mm with no interslice gap, number of signals acquired: 1). Diffusion was measured along 30 non-collinear directions with the use of a diffusion-weighted factor b in each direction for 1000 s/mm2, and one image was acquired without use of a diffusion gradient (b = 0).
PET data acquisition and processing
Subjects were examined using a PET/CT scanner, TruePoint Biograph 16 (Siemens Medical Solutions). 40 min after injection of 185 MBq of 18F-THK5351, PET emission data was acquired for 20 min. For 11C-PiB imaging, 11C-PiB at a dose of 555 MBq was injected 50 min before the scan. Emission data was acquired for 20 min. Images were acquired with axial field of view (FOV) of 342×342 mm yielding 81 contiguous slices, 168×168 matrix, 2 mm slice thickness, and reconstructed with ordered-subset expectation maximization (OSEM) method (iteration: 4, subsets: 21). The corrections for normalization, dead time, attenuation, scatter, and decay were performed [23–25]. The whole brain standardized uptake value ratio (SUVR) of 11C-PiB data were calculated by using Amyquant with the cerebellar cortex value as the reference [26]. The whole brain SUVR of 18F-THK5351data were calculated by using “GAAIN ctx VOI” with the cerebellar cortex value as the reference [26].
Details of the normalizing process are described elsewhere [23, 24]. In short, each PET image, which was corrected for partial volume effect by using PETPVE toolbox [27], was coregistrated to personal T1-weighted image, and individual T1-weighted images were normalized to the Montreal Neurological Institute (MNI) space with the Diffeomorphic Anatomical Registration Through Exponentiated Lie (DARTEL) method [28]. Then, the transformation matrix was applied to the coregistrated PET images. After normalization, SUVR of 18F-THK5351 and 11C-PiB were calculated with the cerebellar cortex value as the reference. Normalized SUVR images were smoothed by a 6-mm full-width at half maximum (FWHM) Gaussian kernel.
Calculation of diffusion tensor imaging along the perivascular space (DTI-ALPS)
Initially, the individual b = 0 map was coregistrated to the “EPI.nii” image, regarded as the anatomical standard image in the SPM12, for the correction of brain direction, and warped into the standard MNI space. Second, we corrected eddy current-induced distortions and coregistrated raw DTI files to coregistrated b = 0 image linearly by FMRIB’s Software Library (FSL) 6.0.3 software package [29]. Third, the b-vectors gradient matrix was then rotated to take into account the corrections made at the previous stage, by using the fdt_rotate_bvecs software included in the FSL. Forth, we corrected susceptibility distortion by FSL’s TOPUP algorithm using with two EPI images with reversed phase-encoding directions (anterior–posterior and posterior–anterior). Last, Diffusivity maps in the direction of the x-axis (right-left), y-axis (anterior-posterior), z-axis (inferior-superior), and color-coded 1st eigenvector maps were processed by FSL.
Calculation of the DTI-ALPS was performed according to previous studies [11, 15]. Essentially, ALPS index is a ratio of the diffusivity in the direction of the perivascular space and the diffusivity in the direction perpendicular to both major fiber tract and perivascular space. This concept is based on a spatial relationship in the fiber tracts and the perivascular space in the axial plane at the level of the lateral ventricle body. Then, we detected the projection and association fibers by using the color-coded 1st eigenvector maps using with FSLEyes (https://zenodo.org/record/3937147), and we marked two 5-mm-diameter spherical region of interests (ROIs) in the region of the projection and association fibers on a slice at the level of the lateral ventricle body for both hemispheres using with Mango software (https://rii.uthscsa.edu/mango/mango.html). Then, DTI-ALPS index was calculated as below.
It has been used as an index for glymphatic activity and was calculated for each participant in this study.
Statistical analysis
Two-sample T tests were performed to determine differences in age, education period, and the scores of MMSE, MOCA-J, CDR, SUVR of 11C-PiB, and 18F-THK5351, and bilateral and mean DTI-ALPS indices between the patients with AD and healthy subjects. Analysis of covariance (ANCOVA) was also performed to determine differences of bilateral and mean DTI-ALPS indices between two groups controlling for age and gender. Chi square test was performed to assess gender differences. The significance level of the statistical analysis was set at p value < 0.05. The correlation between mean DTI-ALPS index and MMSE, MOCA-J, and SUVR of 11C-PiB and 18F-THK5351 in healthy subjects and patients with AD were evaluated by partial correlation analyses controlling for age and gender. Statistical analyses were performed using SPSS Statistics for Windows 28.0 software (SPSS Japan, Tokyo).
Statistical analyses for the mean DTI-ALPS index and PET images in healthy subjects and patients with AD were performed using statistical parametric mapping 12 (SPM12) software working on Matlab R2017b (Math Works, Natick, MA, USA). Correlation analyses between mean DTI-ALPS index and regional SUVR of 11C-PiB and 18F-THK5351 were calculated using multiple regression model controlling for age, and gender. Only differences that met the following were deemed significant. In this case, a voxel-level height threshold of p < 0.001 (uncorrected) and the statistical threshold for the spatial extent test on the clusters of p < 0.05 (family wise error [FWE] corrected) were adopted.
RESULTS
The characteristics of the participants are summarized in Table 1. There were significant differences in age, the MMSE score, MOCA-J score, CDR score, the whole brain SUVR of 11C-PiB and 18F-THK5351, and all DTI-ALPS indices between the patients with AD and healthy subjects revealed by two sample t-test. In case we set a cut-off value of SUVR of 11C-PiB=1.5 [30], all healthy subjects were under the cut-off value (Fig. 1A). As for DTI-ALPS indices, we found the significant negative partial correlation between the mean DTI-ALPS index of all the participants and the MMSE score (correlation coefficient = 0.48, p < 0.001), and MOCA-J score (correlation coefficient = 0.49, p < 0.001). When we re-analyzed the differences of right, left, and mean DTI-ALPS indices by using the ANCOVA controlling for age and gender, there were significant difference of right DTI-ALPS index (f = 17.9, p < 0.001), left DTI-ALPS index (f = 10.3, p = 0.002), and mean DTI-ALPS index (f value = 17.2, p < 0.001) between the patients with AD and healthy subjects. Figure 1B also showed the bilateral and mean DTI-ALPS indices in all the participants without controlling for age and gender.

Disease-related changes of DTI-ALPS. (A) The dots showed the relationships between raw mean DTI-ALPS index without controlling for age and gender and the raw whole brain SUVR of 11C-PiB in all the healthy subjects and AD patients. Dash line shows the cut-off value = 1.5. (B) The bars showed the raw right, left, and mean DTI-ALPS indices. There were significant differences of the DTI-ALPS indices between the patients with AD and healthy subjects when we analyzed by ANCOVA controlling for age and gender. * shows p value < 0.001. (C) The dots showed the relationships between raw mean DTI-ALPS index without controlling for age and gender and the raw whole brain SUVR of 18F-THK5351 in all the healthy subjects and AD patients.
With respect to the PET data, we found the significant negative partial correlation between the mean DTI-ALPS index of all the participants and the whole brain SUVR of 11C-PiB (correlation coefficient=–0.56, p < 0.001). Figure 1A showed the relationship between raw mean DTI-ALPS index and gender and the raw whole brain SUVR of 11C-PiB in all the healthy subjects and AD patients without controlling for age. Further, we found the significant negative correlation between the mean DTI-ALPS index and the SUVR of 11C-PiB in bilateral temporal cortex, left parietal and posterior cingulate cortices in all the participants (Fig. 2). There was no significant positive correlation between them. When we re-analyzed the relationships between the mean DTI-ALPS index and the SUVR of 11C-PiB in each diagnostic group separately, there were no significant negative correlations between them.
Regional relationship of DTI-ALPS index with SUVR of 11C-PiB. We found the significant negative correlation between the DTI-ALPS and the SUVR of 11C-PiB in bilateral temporal, left parietal cortex and left posterior cingulate cortex in all the participants. The background images are “single_subj_T1” image regarded as one of the anatomically standard images in the SPM12.
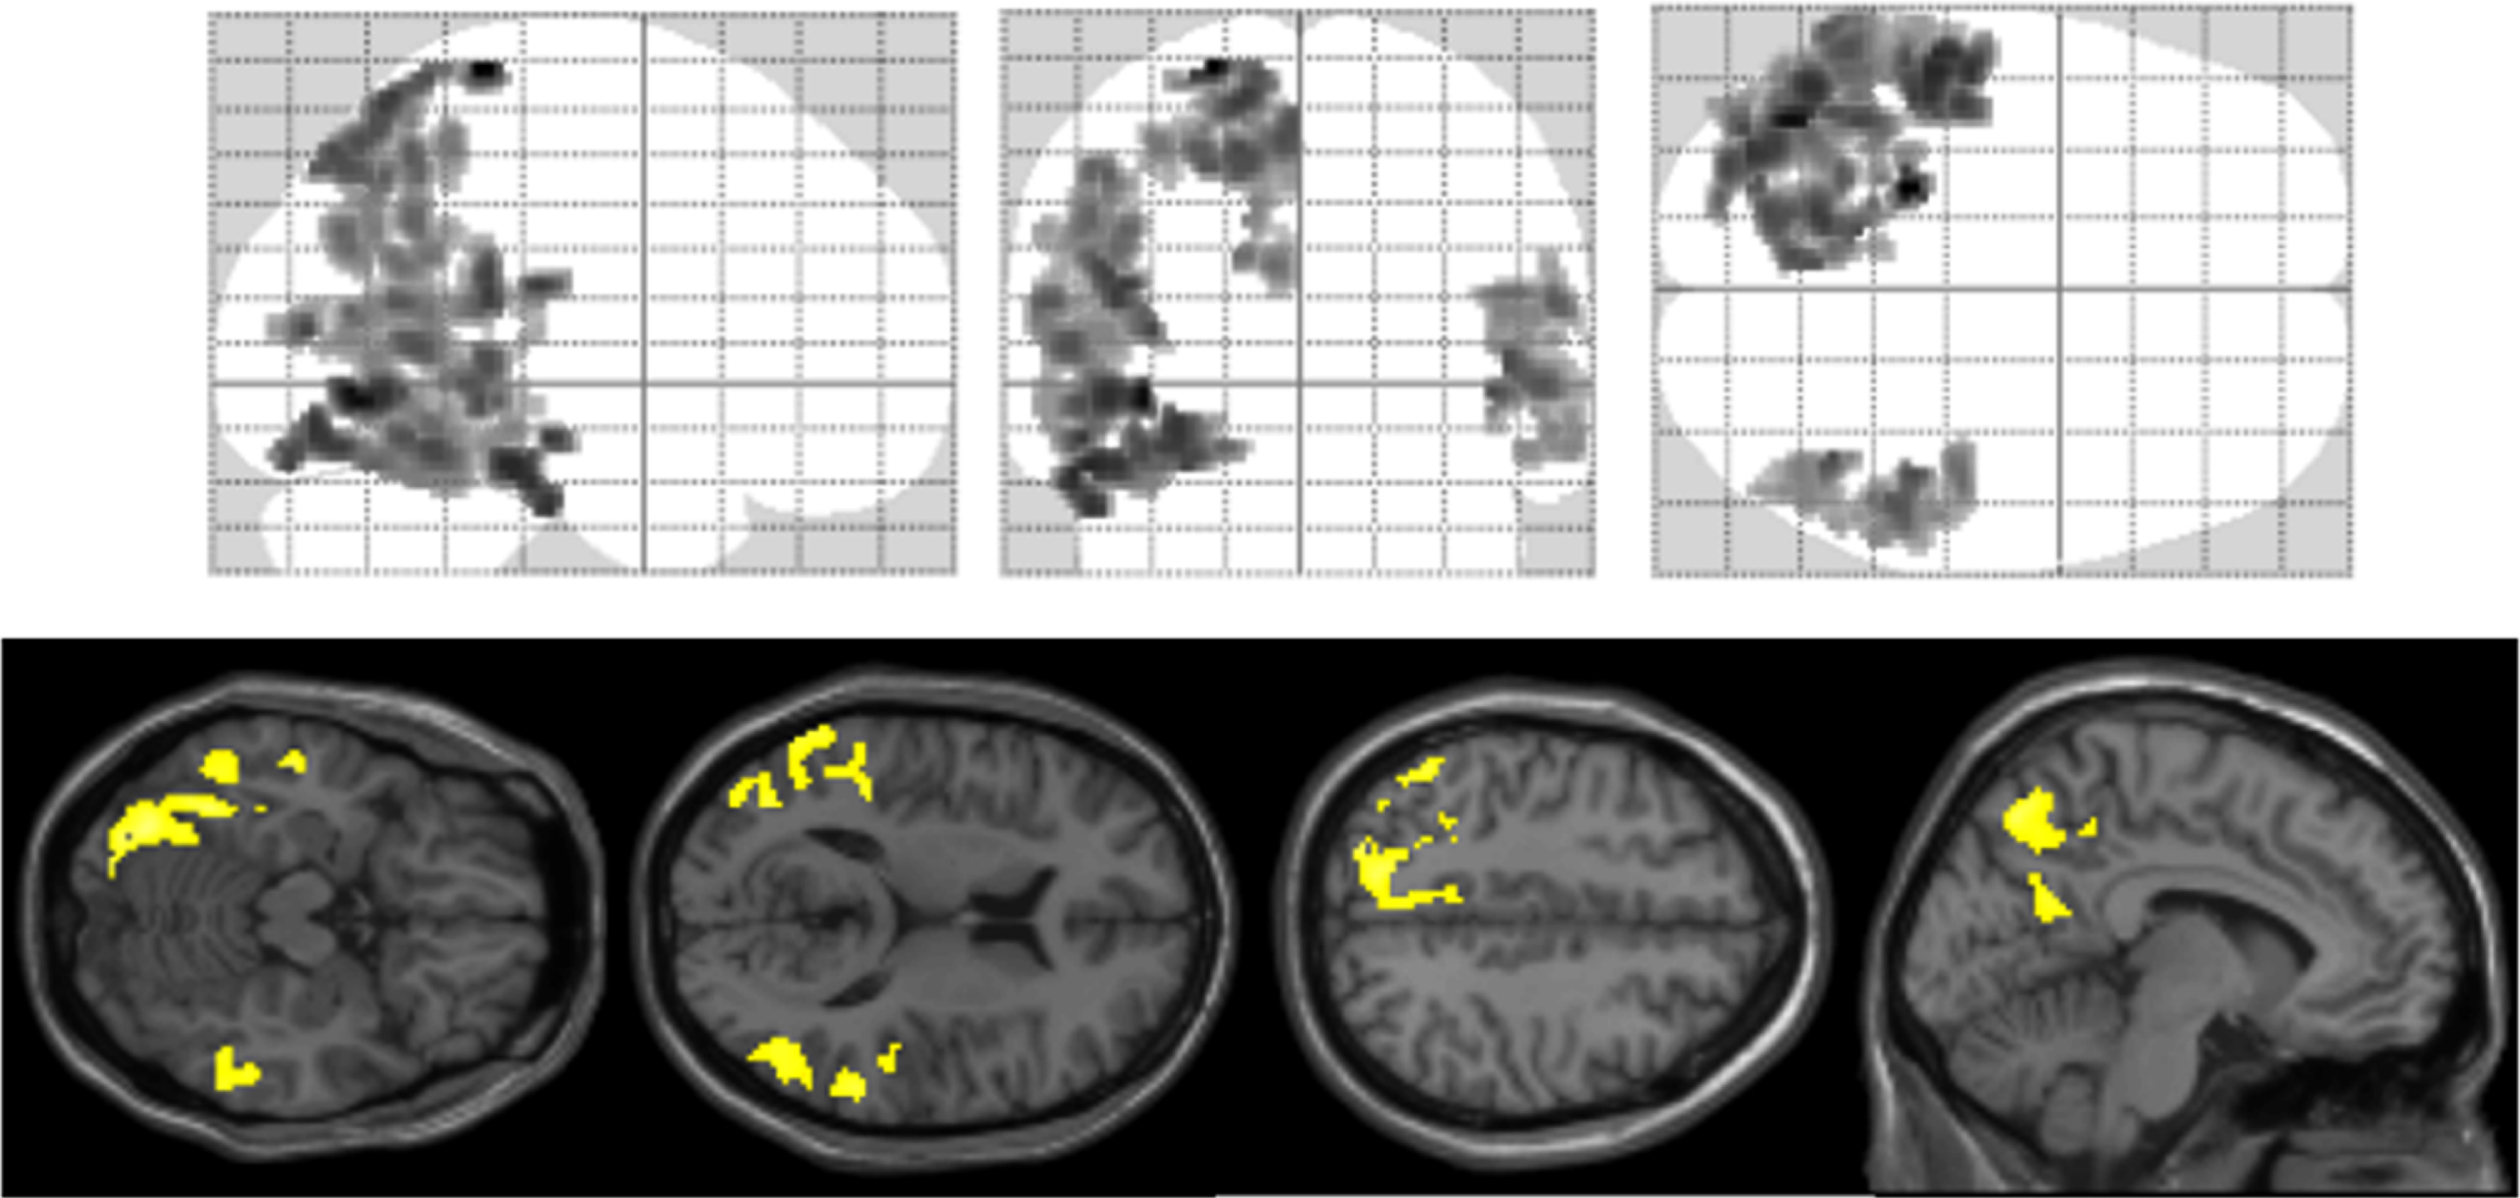
As for 18F-THK5351, we found the significant negative partial correlation between the mean DTI-ALPS index of all the participants and the whole brain SUVR of 18F-THK5351 (correlation coefficient=–0.32, p = 0.019). Figure 1C described the relationship between raw mean DTI-ALPS index and the raw whole brain SUVR of 18F-THK5351 in all the healthy subjects and AD patients without controlling for age and gender. Additionally, there were significant negative correlations between the DTI-ALPS index and the SUVR of 18F-THK5351 in bilateral temporal cortices and right parietal cortex in all the participants (Fig. 3). There were also significant positive correlations between the DTI-ALPS index and the SUVR of 18F-THK5351 in bilateral caudate nuclei and thalami (Supplementary Figure 1). When we re-analyzed the relationships between the mean DTI-ALPS index and the SUVR of 18F-THK5351 in each diagnostic group separately, there were no significant negative correlations between them.

Regional relationship of DTI-ALPS index with SUVR of 18F-THK5351. We found the significant negative correlations between the DTI-ALPS index and the SUVR of 18F-THK5351in bilateral temporal cortices and right parietal cortex in all the participants. The background images are “single_subj_T1” image regarded as one of the anatomically standard images in the SPM12.
DISCUSSION
We found significant decrease of DTI-ALPS index in the patients with AD, compared with healthy subject. Further, there were significant negative correlations between DTI-ALPS index and the SUVR of 11C-PiB and 18F-THK5351. To our knowledge, this is the first study that evaluated the relationships between the deposition of Aβ and tau protein and neuroinflammation and the glymphatic system activity estimated by DTI-ALPS technique.
We evaluated the difference of DTI-ALPS index between the patients with AD and healthy subjects and found that DTI-ALPS index of AD patients was lower than that of healthy subjects. Further, the cognitive functions rated with MMSE and MOCA-J were positively correlated with DTI-ALPS index. Previous studies showed that DTI-ALPS index showed the disease-related decrease in AD [11, 14], and these studies also showed the positive correlation between the MMSE and DTI-ALPS index. These points were congruent with our results. The glymphatic system is known to be a functional waste clearance mechanism for the central nervous system, and this system has the role in removing the Aβ and tau protein from the brain [8–10]. It is suggested that the Aβ and tau protein start to accumulate when this clearance system activity become low, and this impairment may cause the neurocognitive disorder, such as AD. These points were compatible with the lower DTI-ALPS index in the patients with AD, compared with healthy subject. Regarding to the cognitive function, the DTI-ALPS index which is calculated at only one point adjacent to the lateral ventricles correlated with MMSE scores, the simple overall cognitive test. This suggests that the DTI-ALPS index may function as a window to evaluate comprehensive cognitive function of the whole brain along with the progression of AD, even though it is an index of local water dynamics calculated from local brain data.
As for Aβ deposition, the DTI-ALPS index was significantly correlated with the whole brain SUVR of 11C-PiB. When we analyzed the relationships between the DTI-ALPS index and SUVR image of 11C-PiB by voxel-based analysis, there were significant negative correlations between them in the bilateral lateral temporal cortex, left parietal cortex and left posterior cingulate cortex. It is known that the patients with AD show increased amyloid-tracer uptake in the posterior cingulate gyrus, lateral temporal, and parietal gray matter, and not in medial temporal lobes [2, 4]. Our results conformed to these points.
Similarly, we detected that there were significant negative correlations between DTI-ALPS index and the SUVR of 18F-THK5351 in the bilateral temporal and right parietal cortices. Postmortem study showed that the deposition of tau protein occurs in the transentorhinal area, entorhinal cortex, hippocampus, then progressing to the temporal cortex and the other cortical areas [3], and tau-PET studies found that the patients with AD showed increased tau-tracer uptake in the temporal cortex [5–7]. 18F-THK5351, one of the first-generation tau tracers, is known to reflect tau pathology and astrogliosis-related neuroinflammation, and tau aggregation and neuroinflammatory processes of these regions might correlated with the DTI-ALPS index [24]. There was no significant correlation between the DTI-ALPS index and SUVR of 18F-THK5351 in the hippocampal region. It is well known that the patients with AD exhibit severe atrophy in hippocampal region. Thus, we might underestimate the SUVR of 18F-THK5351 in the hippocampus owing to partial volume effect. These points might obscure the relationships in the hippocampus.
In addition to information on amyloid and tau deposition on PET, an axis of evaluation can be added for glymphatic system abnormalities that are either a cause or a consequence of the deposition. The DTI-ALPS method may become an adjunctive biomarker for predicting the prognosis of AD as more data are collected on the prognostic relevance of the assay in many clinical cases in the future.
There were some limitations in this study. First, we did not find the significant correlations between the DTI-ALPS index and SUVRs of PET scans in the AD patient group and healthy subject group, respectively. For one thing, all the healthy subjects showed the low SUVR of 11C-PiB, which were under the cut-off value, in other words, they did not have pathology of AD. Further, the brain shrinks along with the progression of AD, and we might underestimate the SUVRs of PET scans due to partial volume effect. These points might influence our results. Last one, we did not include the patients with MCI in this study. MCI data that meant the early stage of AD pathology might bring more information about the progression of the change of glymphatic system activity in the AD. Further study with more participants and the MCI patient data that were intermediate from healthy subject to demented patients would bring the detailed results in this field. Second, we found the significant positive correlation between DTI-ALPS index and the SUVR of 18F-THK5351 in the bilateral thalami and caudate nuclei. Previous study showed that the lower the DTI-ALPS index was, the larger the lateral ventricle became [16], and this partial volume effect might influence our results. Third, we calculated the DTI-ALPS index as the mean of both hemispheres. We estimated the relationship between the left and right DTI-ALPS index, and we detected the significant positive correlation between them (correlation coefficient = 0.69, p < 0.001), however, there were no significant negative correlations between the left DTI-ALPS index and the regional SUVRs of 11C-PiB or 18F-THK5351. Some studies put the ROI on the left hemisphere [11, 15–18]. However, one study focusing on the AD put ROIs on the both hemispheres, and they found that there was significant correlation between the MMSE score and the right DTI-ALPS index [14]. Further, test-retest study of the DTI-ALPS index detected that the ALPS index with the averaging of bilateral index showed a higher reproducibility compared to the unilateral calculation [12]. Another study calculated the DTI-ALPS index as the mean of both hemispheres [31]. Further DTI-ALPS index studies would refine the methodology of DTI-ALPS index.
In conclusion, we found the significant correlation between the glymphatic system activity rated by using DTI-ALPS technique and the accumulation of Aβ and tau protein and neuroinflammation estimated by the PET analyses in the patients with AD and healthy subjects. This point might indicate the effectiveness of DTI-ALPS index derived from MRI scan to predict the prognosis of AD as more prognostic data is accumulated in the future. Further, these points might provide objective biological information for early diagnosis of AD.
Footnotes
ACKNOWLEDGMENTS
This study was supported by the following funding sources: the Brain Mapping by Integrated Neurotechnologies for Disease Studies (Brain/MINDS) project (Grant No. 16dm0207017h0003), funded by the Japan Agency for Medical Research and Development (AMED), and an Intramural Research (Grant No. 27-9 and 3-3) for Neurological and Psychiatric Disorders from the National Center of Neurology and Psychiatry (Japan).
CONFLICT OF INTEREST
The authors have no conflict of interest to report.