
Abstract
Background:
Cardiometabolic disorders (hypertension, diabetes) are key modifiable risk factors for Alzheimer’s disease and related disorders. They often co-occur; yet, the extent to which they independently affect brain structure and function is unclear.
Objective:
We hypothesized their combined effect is greater in associations with cognitive function and neuroimaging biomarkers of white matter (WM) health and cerebral perfusion in a diverse older adult cohort.
Methods:
Participants aged 50-85 years received: clinical evaluation, oral glucose tolerance testing, neuroimaging, cognitive testing, and adjudication. Neuroimaging included: T1 (gray [GM]/WM segmentation, regional volumes/thicknesses); FLAIR (WM hyperintensity volume [WMHv]; arterial spin labeling (cerebral blood flow); diffusion tensor imaging (fractional anisotropy [FA]); and neurite orientation dispersion and density imaging (Free Water). Hypertension (HTN) and impaired glucose tolerance (IGT) were staged and cardiometabolic status was categorized (HTN only, IGT only, IGT+HTN, neither). Multivariable linear regression modeled associations with cognitive and neuroimaging measures (covariates: age, gender, race).
Results:
MRI was available for 478 participants (35% mild cognitive impairment, 10% dementia) with mean age 70±8 years, 74% with HTN, 61% with IGT, and 15% self-identified as Black/African-American. IGT+HTN was significantly associated with cognitive impairment, higher WM Free Water and WMHv, lower FA, and lower GM perfusion compared to neither factor. HTN alone was associated with poorer cognition and lower GM perfusion. Cardiometabolic factors were not associated with GM macrostructure (volumes, temporal lobe cortical thickness) or cognitive status.
Conclusion:
HTN and its co-occurrence with IGT (HTN+IGT) were associated with lower global cognitive performance and reduced GM perfusion and impaired WM microstructure.
INTRODUCTION
Hypertension (HTN) and type 2 diabetes are proposed as key modifiable risk factors for Alzheimer’s disease (AD) and related dementias [1, 2]. These highly prevalent conditions represent complex phenotypes that often co-occur, possibly due to shared underlying subclinical pathophysiologic conditions such as insulin resistance or dyslipidemia; yet, they are often studied in isolation. There is extensive epidemiological evidence linking both HTN and diabetes with all-cause dementia [2–5] with similar magnitudes of effects imparting a 1.5 to 2 fold increased risk, which may be higher for AD and vascular dementia subtypes [6]. Observational studies suggest these relationships are strongest when these cardiometabolic disorders are present in midlife [4, 7].
Diabetes is associated with cognitive impairment and cognitive decline, brain structural abnormalities indicative of diffuse atrophy and cerebral small vessel disease, and impaired cerebrovascular function [8]. These associations appear to be independent of adjustment for glycemic control, microvascular complications, and comorbidity; however, intensive glycemic control did not improve cognitive performance and brain structure in longstanding diabetes in the ACCORD MIND study [9]. Notably, structural and functional abnormalities in the brain, amyloid deposition, and relative deficits in cognitive function are documented in phases of pre-diabetes [10–12], characterized by dysglycemia, insulin resistance, and hyperinsulinemia.
HTN, characterized by elevated systolic blood pressure (SBP), is associated with structural and functional aspects of dementia, especially when present in mid-life, including: cognitive decline; risk for incident cognitive impairment; and structural abnormalities in the brain, including diffuse brain atrophy, evidence of cerebral small vessel disease, microstructural integrity, and amyloid deposition [13]. HTN and associated arterial changes are thought to promote cerebrovascular remodeling, resulting in reduced cerebral perfusion and cerebral small vessel disease which impact the brain’s ability to clear proteins such as amyloid-β [13]. Results from the Systolic Blood Pressure Intervention Trial (SPRINT) confirm observations showing intensive treatment of SBP results in a reduced risk for incident cognitive impairment [14] and slows the progression of white matter hyperintensities (WMH) [15].
Cognitive dysfunction arising from HTN and diabetes is likely attributable to multiple etiologies, giving rise to mixed pathologies indicative of AD and vascular dementias with marked inter-individual variation. Further, overlapping cardiometabolic disorders (e.g., HTN and dysglycemia) may explain some of the excess risk and health disparities for AD and related dementias observed in patient subgroups. Black older adults have significantly higher rates of HTN and diabetes compared to White older adults; and they have lower rates of blood pressure and glycemic control, resulting in more disease complications [16, 17]. In a recent large meta-analysis, observed differences between Black and White individuals in global cognitive decline were no longer statistically significant after adjusting for cumulative mean SBP [18]. While there are many non-biologic contributing factors that may explain health disparities in HTN and diabetes with AD and related dementias, the lack of early and aggressive prevention and treatment of HTN and diabetes may be essential factors contributing to health disparities in these disorders. Yet, there is a lack of data available to examine the overlap and independence of cardiometabolic disorders (HTN and dysglycemia) as they relate to cognitive function, structural and functional brain abnormalities in diverse and well-characterized cohorts. Therefore, we leveraged a cohort with detailed characterization of blood pressure, glycemic function, neuroimaging data, and cognitive performance in Black and White older adults. We hypothesized that HTN alone and its overlap with dysglycemia are associated with poorer global cognitive performance and impaired white matter (WM) structure.
MATERIALS AND METHODS
Participants
All activities described were approved by the Wake Forest Institutional Review Board and conducted in accord with the Helsinki Declaration of 1975. Adults between the ages of 55 to 85 were recruited into the Clinical Core of the Wake Forest Alzheimer’s Disease Research Center (ADRC) from the surrounding community between 2016 and 2020 and underwent standard evaluation in accordance with the National Alzheimer’s Coordinating Center (NACC) protocol for clinical data collection, including: clinical exams, neurocognitive testing, and neuroimaging, and genotyping for apolipoprotein E (APOE) ɛ4. APOE genotype was obtained by Taqman using single nucleotide polymorphisms (rs429358 and rs7412) to determine haplotypes of ɛ2, ɛ3, and ɛ4. APOE ɛ4 was dichotomized to the presence or absence of one or more ɛ4 alleles. Race was self-reported as a social construct. Exclusion criteria for this cohort included: large vessel stroke (participants with lacunae or small vessel ischemic disease were eligible); other significant neurologic diseases that might affect cognition other than AD; evidence of organ failure, active cancer, uncontrolled clinical depression, psychiatric illness, current use of insulin, history of substance abuse or heavy alcohol consumption within previous 10 years. Written informed consent was obtained for all participants and/or their legally authorized representative.
Oral glucose tolerance test (OGTT) and impaired glucose tolerance (IGT)
At study entry, fasting participants without diabetes completed OGTT by undergoing serial blood draws. At time zero, glucose measurement was drawn prior to glucose ingestion. Participants then ingested 75 grams of glucose in solution. Blood was sampled at 15, 30, and 120 min post-ingestion. Blood glucose was determined using the Hemocue whole blood glucose analyzer. Participants with a diagnosis of diabetes, severe cognitive impairment, and those that refused OGTT did not complete OGTT. Instead, blood was drawn to measure hemoglobin A1c. IGT was defined by glucose≥140 mg/dL at 120 minutes of OGTT (OGTT120) or hemoglobin A1c≥5.7%.
Blood pressure and HTN
Brachial blood pressure was measured in a seated position after a 5-min rest in a quiet and dark room using a DINAMAP™ automated blood pressure device (GE Healthcare). If the initial blood pressure reading was greater than 160 mm Hg systolic or 90 mm Hg diastolic, a second blood pressure was measured after another 5-min rest. Blood pressure was categorized according to the Seventh Report of the Joint National Committee on Prevention, Detection, Evaluation, and Treatment of High Blood Pressure (JNC7) guidelines [16] and HTN status was defined as SBP≥130 mm Hg, DBP≥80 mm Hg, and/or the current used of antihypertensive medications.
Medications
Participants provided a list of all prescription and over-the-counter medications taken. Participants considered to be on anti-hypertension therapy took antiadrenergic agents, angiotensin converting enzyme inhibitors, beta-blockers, calcium channel blocking agents, diuretics, vasodilators, angiotension II inhibitors, or antihypertensive combination therapy agents. We permitted diabetic medication use except insulin, which was an exclusion criterion at enrollment.
Cognitive testing
Participants completed cognitive testing with the Uniform Data Set Version 3 (UDSv3) [19] test battery, including: Montreal Cognitive Assessment (MoCA), Craft Story, Benson Figure, Number Span, Verbal Fluency (letters CFL), Category Fluency, Trail Making Test, and the Multilingual Naming Test; as well as supplemental tests commonly used to estimate the participant’s current and past cognitive status [Mini-Mental State Exam (MMSE), American National Adult Reading Test, Digit Symbol Substitution Test (DSST), Free and Cued Selective Reminding Test (FCSRT), and the Rey Auditory Verbal Learning Test]. Subjective questionnaires assessing mood and perceived change in cognitive symptoms were administered at this visit including the 15-item Geriatric Depression Scale (GDS); the Clinical Dementia Rating scale; and the Functional Assessment Questionnaire, which was used to estimate capacity to manage activities of daily living.
UDSv3 cognitive tests scores were normalized to create z-scores based on age, race, gender, and education [20]. Z-scores were combined to create domain specific cognitive performance for: executive function, memory, language, attention, visuospatial, phonemic fluency [19]. A modified Preclinical Alzheimer’s Cognitive Composite (PACC5) [21] was created from five cognitive tests: the MMSE, FCSRT, Craft Story verbatim recall of the Craft Story, DSST, and category fluency.
Adjudication
Adjudication of cognitive diagnosis by expert panel consensus occurred following review of all available clinical, brain imaging, and cognitive data in accordance with current National Institute of Aging-Alzheimer’s Association guidelines for the diagnosis of mild cognitive impairment (MCI) [22] and dementia due to AD [23] and related disorders. Diagnoses of MCI and dementia at ADRCs are predicated on the National Alzheimer’s Coordinating Center (NACC) coding guide (https://files.alz.washington.edu/documentation/uds3-ivp-guidebook.pdf), with each of the specific dementia syndromes defined based on embedded diagnostic criteria referenced in the NACC coding guide. The panel consisted of investigators with extensive experience assessing cognitive status and identifying cognitive impairment in older adults.
Magnetic resonance imaging (MRI)
Detailed MRI acquisition parameters have been described previously [24] and are also available in the supporting information. MRI were acquired on a 3T Siemens Skyra with a 32-channel head coil (Erlangen, Germany) using the following sequences: High-resolution T1-weighted images obtained with a magnetization prepared rapid gradient echo (MP-RAGE) sequence; T2 FLAIR obtained with a 3D inversion recovery GE sequence; Diffusion tensor imaging (DTI) and Neurite orientation dispersion and density imaging (NODDI) [25] acquired in a single run of diffusion scans; Arterial Spin Labeling (ASL) scans to acquire whole-brain cerebral blood flow (CBF) performed with a whole brain MP-PCASL sequence [26].
Imaging data processing and analysis
Detailed descriptions of image processing procedures have been described previously [24]. Briefly, T1 processing included normalization and tissue segmentation using SPM12 (www.fil.ion.ucl.ac.uk/spm) CAT12. Cortical thickness was calculated on T1 using FreeSurfer v5.3 for a temporal lobe region of interest (shown to be a useful measure of neurodegeneration in regions characteristically affected in AD and related dementias), by averaging surface area-weighted cortical thickness of bilateral entorhinal, inferior/middle temporal, and fusiform regions [27]. WMH were segmented by lesion growth algorithm (LGA) in LST [28] toolbox v2.0.15, running in SPM12 using FLAIR and T1. WMH masks were manually edited by trained observers as needed; total WMH volume (WMHv) was divided by FreeSurfer total intracranial volume (to correct for head size). DTI eddy current correction was conducted using FSL dti_eddy, with the diffusion tensor computed using Camino (www.camino.org.uk). DTI fractional anisotropy (FA) of WM was computed using DTI-TK (http://dti-tk.sourceforge.net). Distortion correction was performed by normalizing the B0 image to T1 and applying this transformation to FA maps, which were then normalized to Montreal Neurological Institute (MNI) space using parameters computed from structural normalization. AMICO [29] was used to estimate isotropic volume fraction (WM Free Water) from NODDI data. Free Water maps were also registered to T1 and normalized to MNI space. The Johns Hopkins University (JHU) DTI atlas [30] was overlaid on FA and Free Water images to extract mean signal from all supratentorial WM tracts. PCASL image processing included head motion correction (using spm_realign function from SPM12), inconsistent volume filtering, partial volume (PV) correction, normalization, and segmentation. PV correction [31] was used to generate gray matter (GM) and WM CBF maps. ASL volumes that have large motion and are inconsistent in the ASL time series were rejected before averaging [32]. ASL images were quantified with a kinetic model [33] and quantified CBF was converted to absolute units (ml/100 g/min) using CSF as reference [34], resulting in a calibrated perfusion value for each voxel. PV-corrected pcASL images were registered onto T1 and normalized to MNI space [31]. A set of all supratentorial AAL GM ROIs were overlaid on GM CBF images to calculate mean global GM CBF for each participant; a set of all supratentorial JHU WM tracts were overlaid on WM CBF images to calculate mean global WM CBF for each participant.
Statistical analysis
For this analysis, individuals with contraindication for MRI were excluded. Participant demographics were compared across cognitive status groups using chi-square tests and one-way analysis of variance. The sample was restricted to participants with at least one of the 5 MRI measures and covariate data. General linear models were used to compare mean cognitive performance z-scores across cardiometabolic status groups. Cardiometabolic status groups were defined by the combination of dichotomous variables IGT and HTN to define four groups: IGT+HTN, IGT only, HTN only, and neither disorder. Tukey’s test for multiple comparisons was used to compare pairs of categories when the overall test was significant, with having neither cardiometabolic condition as the reference group. Models of cognitive performance and cardiometabolic status were bivariate since cognitive performance scores were already normed for age, gender, and race. Multivariable general linear models examined the relationship between brain imaging parameters and cardiometabolic status, adjusting for age, gender, and race. A log transformation was applied to WMHv adjusted for total intracranial volume to account for skewed distribution. Formal interactions between IGT and HTN were assessed for each outcome. Linear regression was performed in order to model the relationship between brain imaging parameters and SBP and OGTT120. Scatterplots and unadjusted correlations are presented along with multivariable models adjusted for age, gender, and race. Sensitivity analyses assessed potential interactions by gender, race, cognitive status, HTN and type 2 diabetes status and treatment. All statistical tests use a significance level of 0.05.
RESULTS
Cardiometabolic disorders in the sample
A total of 482 participants of the Wake Forest ADRC’s Clinical Core completed brain MRI, cognitive testing, cognitive adjudication, standardized blood pressure measurement, and metabolic characterization (91% completed OGTT). Participants in this sample had a mean age of 70±8 years, 16% were Black, 45% were adjudicated to have cognitive impairment (35% MCI and 10% dementia), 74% had HTN, 61% had IGT, and 4% had non-insulin treated diabetes. As anticipated, cognitively impaired individuals were older, had lower education, and slightly higher geriatric depression scores (Table 1). Those with dementia were more likely to be APOE ɛ4 positive. Approximately half (48.6%) of all participants had overlapping cardiometabolic conditions of IGT+HTN. This profile significantly differed by cognitive status (p = 0.042) with impaired participants having higher proportions of HTN alone and overlapping IGT+HTN.
Demographics and neurocognitive assessments for Wake Forest ADRC clinical core by cognitive status
Hypertension (HTN) defined as being on antihypertensive medications or Stage 1 or Stage 2 HTN according to blood pressure. Impaired glucose tolerance (IGT) defined by glucose levels at 120 minutes during oral glucose tolerance test (OGTT). PACC5, Preclinical Alzheimer’s Cognitive Composite; MoCA, Montreal Cognitive Assessment. APOE genotype information unavailable on n = 17 participants (Normal = 7, MCI = 8, Dementia = 2).
Cardiometabolic disorders and cognitive performance
Table 2 presents the associations between cardiometabolic status, global, and domain specific cognitive function based on z-scores normed for age, gender, race, and education. Having the combination of IGT+HTN as well as HTN alone was associated with significantly poorer performance on MoCA and PACC5 compared to having neither cardiometabolic condition. Neither having IGT and HTN alone nor together was associated with domain-specific performance. Similar results were observed when adjusting for APOE ɛ4 carrier status (Supplementary Table 1).
Mean global and domain-specific cognitive performance by cardiometabolic group status
Unadjusted models of tests and domains standardized for age, gender, race, and education. Pairwise comparisons relative to “Neither”, p: *<0.05, **<0.001.
Cardiometabolic disorders, brain structure, and cerebral blood flow
Table 3 presents the multivariable adjusted models for the primary MRI metrics of interest in the WM (NODDI Free Water, FA, WMHv, and CBF) and CBF in the GM. The combination of IGT+HTN was significantly associated with greater WM disruption (lower FA, higher NODDI Free Water, and higher WMHv) and lower GM CBF. Similar results were observed when adjusting for APOE ɛ4 carrier status (Supplementary Table 2). Formal interactions between IGT and HTN were detected only for WM FA (Supplementary Figure 1), suggesting synergistic effects of the combination on FA. HTN alone was significantly associated with lower GM CBF and was the only disorder associated with lower WM CBF. In contrast, cardiometabolic disorders were not associated with total GM volume or cortical thickness of the temporal lobe (data not shown). Additional models examining interactions by cognitive status, gender, race, and treatment with medications for HTN and diabetes did not show any significant interactions.
Cardiometabolic group status and neuroimaging measures of white matter structure and perfusion
Models adjusted for age, gender, and race. WM, white matter; GM, gray matter; WMH, white matter hyperintensities scaled to headsize and log transformed; CBF, cerebral blood flow; NC, normal cognition; MCI, mild cognitive impairment; HTN, hypertension defined by elevated blood pressure or medications; IGT, impaired glucose tolerance defined by oral glucose tolerance test (OGTT) glucose levels at 120 minutes and hemoglobin A1c levels.
Finally, we investigated the primary components used to define cardiometabolic abnormalities relative to brain structure and CBF. Higher levels of SBP and OGTT120 broadly correlated with WM microstructure (higher NODDI Free Water and lower FA), higher WMHv, and lower GM CBF (Fig. 1). In adjusted models, higher SBP remained significantly associated with higher NODDI Free Water and WMHv, and lower CBF in GM and WM. Relationships between higher OGTT120 and higher WMHv remained significant in adjusted models.
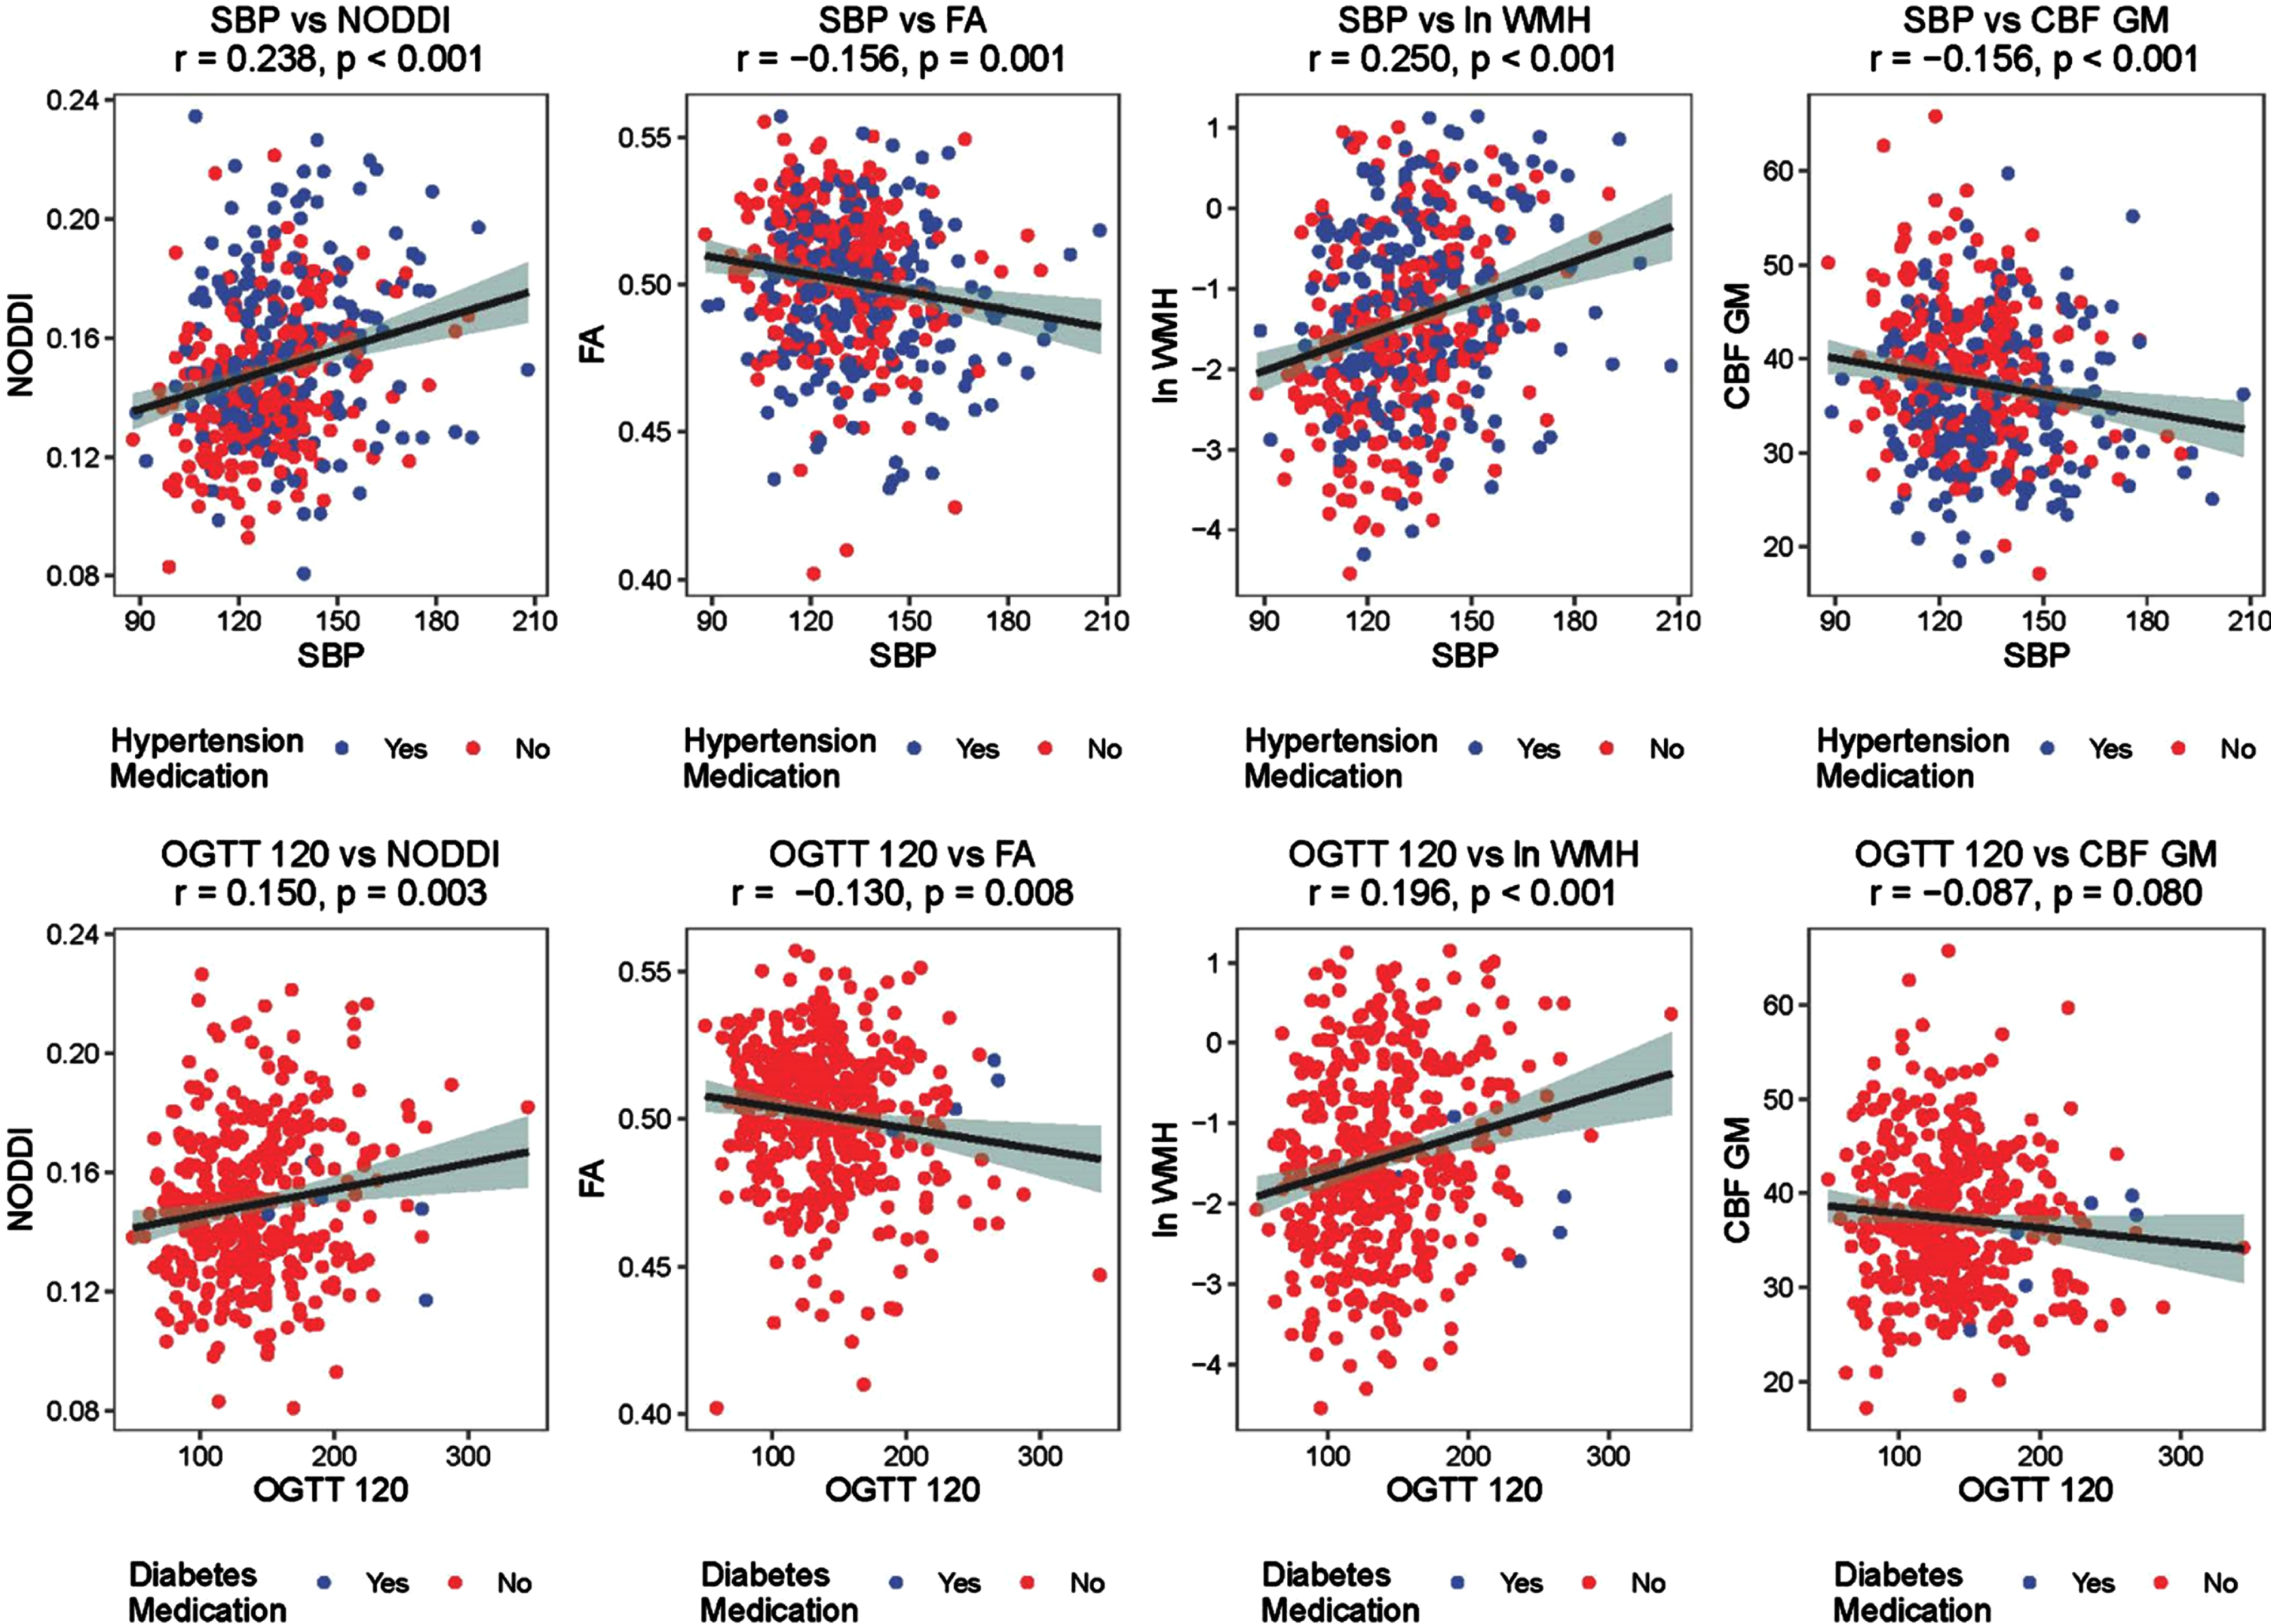
Scatterplots of cardiometabolic factors with white matter microstructure and gray matter perfusion.
DISCUSSION
Among Wake Forest ADRC Clinical Core participants who received MRI, we observed that the overlap of cardiometabolic disorders (IGT+HTN) was commonly seen in half of the participants and did not significantly differ across cognitively normal, MCI, and dementia groups. Only the presence of overlapping cardiometabolic disorders was significantly associated with: poorer global cognitive performance and preclinical composite representing measures of episodic memory, executive function, and global cognition; microstructural and macrostructural abnormalities in the WM; as well as lower perfusion of the GM. HTN alone appeared to be a primary driver of the observed relationships for MoCA, PACC5, and WM CBF; whereas the combination of HTN+IGT was associated with greater WM disruption, namely: lower FA, higher NODDI Free Water and higher burden of WMHv. Neither cardiometabolic disorder alone, nor their combination, was associated with total GM volume or cortical thickness in areas prone to Alzheimer’s disease and related dementias (ADRD) in this sample. These results linking the co-occurrence of cardiometabolic disorders with impaired WM structure, GM perfusion, and poorer cognitive performance were consistent across groups based on cognitive status, gender, and treatment for cardiometabolic disorders.
This work is not the first study to examine relationships between cardiometabolic disorders and biomarkers of cognitive and brain health; yet, it may be the first to examine the interrelationships between glycemic and hypertensive disorders as they relate to cognitive performance, cerebral perfusion, and cerebral macrostructural and microstructural measures in individuals with and without HTN and diabetes. Prior studies have examined imaging biomarkers and HTN [35] and diabetes [8] alone or as a composite within metabolic syndrome, and few have included biomarkers of CBF and microstructural measures of cerebral small vessel disease [36, 37]. When studied alone, HTN, diabetes, and their preclinical stages are associated with various aspects of cerebral small vessel disease, including: decreased WM volume [38], increased WMHs [11, 38], and lacunar infarction [39, 40]. HTN is consistently associated with smaller GM volumes, cortical thickness, and microbleeds, but inconsistently associated with amyloid pathology [41, 42]. Diabetes is associated with infarction and smaller GM volumes and microbleeds but is inconsistently associated with cortical thickness and is not associated with AD pathology [11, 43].
There are limitations to this work that should be considered when interpreting these novel findings. This study focused on cerebral perfusion and WM integrity and did not include AD biomarkers or other measures of cerebral small vessel disease which limits its ability to address initial research showing somewhat inconsistent relationships for cardiometabolic disorders of HTN (e.g., elevated systolic blood pressure or arterial stiffness) [41, 44–47] and pre-diabetes (e.g., insulin resistance) [11, 49] with evidence of cerebral small vessel disease and the extent of amyloid deposition in the brain. This work focused on dysglycemia and did not consider highly confounded metabolic measures of insulin resistance, adiposity, weight, and dyslipidemia as a specific exposures. These measures are highly confounded; therefore, it is difficult separate out their contributions to our results. Our reported associations were cross-sectional, limiting potential inference about temporal and causal relationships between cardiometabolic disorders and brain health. Therefore, it is unclear whether HTN or impaired glucose regulation are themselves initiating factors or work through shared risk factors to promote the development of “mixed” dementias. Finally, this sample was designed to represent subclinical metabolic disorders and did not include patients with long-standing diabetes or those treated with insulin. Treated HTN is common in the community and was not an exclusion criterion. Sensitivity analyses excluding individuals with treated HTN did not change these results.
These findings support prior observations that (pre)diabetes and HTN are closely intertwined because of shared vascular risk factors, such as: endothelial dysfunction, vascular inflammation, arterial remodeling, atherosclerosis, dyslipidemia, and obesity. These risk factors likely contribute to substantial overlap in the cardiovascular complications of diabetes and HTN related primarily to microvascular and macrovascular disease. Common mechanisms may link cardiometabolic disorders at the molecular level, such as: insulin resistance, upregulation of the renin-angiotensin-aldosterone system, oxidative stress, and inflammation [50].
Targeting the overlap of HTN and diabetes within an individual for the prevention of neurologic complications of cardiometabolic disorders and ADRD may be a potent prevention strategy. In the US population, HTN occurs in the vast majority (up to 80%) of patients with type 2 diabetes. Prospective cohorts report that individuals with HTN are 2.5 times as likely to develop diabetes when compared to individuals with normal blood pressure [51]. Further, the overlap between subclinical disorders of dysglycemia and elevated blood pressure is even more substantial than that between diabetes and HTN [51]. Common blood pressure medications (e.g., angiotensin converting enzyme inhibitors and angiotensin II receptor blockers) are known to improve insulin resistance [52]. In this observational study, we did not observe interactions with blood pressure treatment on the observed relationships between SBP, OGTT, and brain structure.
It is important to note that this work contributes to a growing literature suggesting that the risk for ADRD from cardiometabolic disorders may be evident in the preclinical phase of the disorder prior to a clinical diagnosis and mediated by neuropathological biomarkers even in the absence of cognitive symptoms. This work focused on individuals with largely undiagnosed and untreated metabolic disorders and excluded individuals treated with insulin.
In conclusion, we observe that elevated blood pressure and IGT are associated with reduced blood flow and evidence of microstructural and macrostructural abnormalities in the WM of the brain. Further, the overlap of HTN and IGT, rather than each factor alone, was associated with microvascular biomarkers and impaired cognitive function. The overlap of these disorders is common and not easily dissociable, yet amenable to early intervention. HTN and diabetes control in longstanding cardiometabolic disorders may be too late to impact brain health [53]. Early and intensive treatment of elevated blood pressure can slow progression of WM disease [15] and prevent incident cognitive impairment [14].
Footnotes
ACKNOWLEDGMENTS
This work was partially supported by the Wake Forest University Alzheimer’s Disease Research Center (P30AG072947), which is funded by the National Institute on Aging. It would not be possible without the commitment and support of our valued ADRC staff and participants.