
Abstract
Background:
Abnormalities in white matter (WM) may be a crucial physiologic feature of Alzheimer’s disease (AD). However, neuroimaging’s ability to visualize the underlying functional degradation of the WM region in AD is unclear.
Objective:
This study aimed to explore the differences in amplitude of low-frequency fluctuation (ALFF) and fractional ALFF (fALFF) in the WM region of patients with AD and healthy controls (HC) and to investigate further whether these values can provide supplementary information for diagnosing AD.
Methods:
Forty-eight patients with AD and 46 age-matched HC were enrolled and underwent resting-state functional magnetic resonance imaging and a neuropsychological battery assessment. We analyzed the differences in WM activity between the two groups and further explored the correlation between WM activity in the different regions and cognitive function in the AD group. Finally, a machine learning algorithm was adopted to construct a classifier in detecting the clinical classification ability of the values of ALFF/ALFF in the WM.
Results:
Compared with HCs, patients with AD had lower WM activity in the right anterior thalamic radiation, left frontal aslant tract, and left forceps minor, which are all positively related to global cognitive function, memory, and attention function (all p < 0.05). Based on the combined WM ALFF and fALFF characteristics in the different regions, individuals not previously assessed were classified with moderate accuracy (75%), sensitivity (71%), specificity (79%), and area under the receiver operating characteristic curve (85%).
Conclusion:
Our results suggest that WM activity is reduced in AD and can be used for disease classification.
Keywords
INTRODUCTION
Alzheimer’s disease (AD) is the most common type of dementia, accounting for an estimated 60% –80% of all dementia types. Single- or multi-domain cognitive impairment is the main clinical manifestation of AD. It is expected that by 2050, the incidence of AD will triple, causing a great social burden [1, 2]. Currently, the diagnosis of AD requires time-consuming neuropsychological assessments, expensive imaging procedures such as positron emission tomography, and invasive examinations, such as a lumbar puncture. Diagnostic imaging criteria are mainly based on magnetic resonance imaging (MRI) of structural brain changes in the whole brain, medial temporal lobe, or hippocampus, and atrophy in these brain regions is not specific to AD [3, 4]. Some studies have found that functional MRI (fMRI) may reflect the functional state of the brain by detecting changes in blood oxygen levels to identify functional abnormalities before structural changes, indicating the risk of cognitive decline [5].
Resting-state fMRI (rs-fMRI) is a non-invasive and efficient imaging technique that uses blood oxygen level-dependent (BOLD) signals to display the functional state of the central nervous system [6]. The amplitude of low-frequency fluctuation (ALFF) was introduced as a measure for the magnitude of low-frequency oscillations of rs-fMRI; it is defined as the total power within the frequency range between 0.01 and 0.1 Hz [7]. Studies found that the ALFF calculated based on rs-fMRI can reflect spontaneous neural activity in the brain and represent the intensity of brain activity with high sensitivity and specificity [8]. Fractional ALFF (fALFF) is obtained by applying an improved algorithm to calculate ALFF that reduces the sensitivity of ALFF to physiological noise and improves its sensitivity and specificity in detecting spontaneous brain activity. ALFF and fALFF are usually reported together to maximize their reliability in describing the patient’s characteristics [6].
Furthermore, studies have found abnormal patterns of spontaneous brain activity in patients with some neurodegenerative diseases. For example, patients with Parkinson’s disease show higher ALFFs in the left inferior temporal gyrus and left middle temporal gyrus and lower ALFFs in the right middle frontal gyrus, and the ALFF value is correlated with frozen gait in Parkinson’s disease [9]. ALFF values in the right parahippocampal gyrus can be used as a potential marker for monitoring disease progression in amyotrophic lateral sclerosis [10]. In addition, studies have shown that the sharp decline of ALFFs in the precuneus cortex may be related to the severity of cognitive impairment [11]. ALFFs and fALFFs can also help to characterize the physiological characteristics of AD brain spontaneous activity, reveal the inherent network damage, and are sensitive indicators for detecting AD-related neurodegeneration [12].
However, most functional imaging studies are based on grey matter, and relatively few studies have focused on the brain’s white matter (WM). Recent studies have shown that microstructural and macrostructural abnormalities of WM are associated with the risk and progression of AD, which may play an important role in the pathogenesis of AD and become a potential diagnostic and therapeutic target [13]. In an animal model of AD, WM destruction and altered expression of myelin markers were among the earliest pathological changes found [14, 15]. In people with a gene mutation associated with AD, radiological markers of WM damage appeared 22 years before symptoms appeared [16]. These WM changes are thought to reflect demyelination and axon injury [17]. Some neuroimaging studies on AD WM dysfunction have found that the WM hypersignal burden in patients with AD is greater than that in healthy controls (HCs) and is associated with the pathology of AD [18, 19]. Nevertheless, there is no study on the changes in ALFFs and fALFFs in WM regions of patients with AD. Therefore, we hypothesize that ALFFs and fALFFs in WM may also be important imaging indicators for the early diagnosis of AD.
Specifically, the purpose of this study is to explore the changes in ALFF and fALFF values calculated based on rs-fMRI signals in the WM region of patients with AD. Further, we will use a machine learning algorithm to build a classifier to detect the classifying effect of ALFF and fALFF in WM, calculated based on rs-MRI, as well as their combined clinical classification effect, and explore whether changes in WM activity can provide additional information for diagnosing AD.
MATERIALS AND METHODS
Participants
A total of 94 participants were recruited from the Memory Disorders Clinic of the First Affiliated Hospital of Anhui Medical University and the surrounding community. Participants were divided into two groups: patients with AD (n = 48) and HCs (n = 46). Participants in the AD group (male/female = 19/29) had a mean age of 65.65±10.354 years (range 50 to 80 years) and a mean number of 8.11±4.264 years of education. Participants in the HCs group (male/female = 19/27) had a mean age of 63.52±9.323 years (range 50 to 80 years) and a mean number of 9.72±4.773 years of education. All participants underwent MRI (3D-T1 and rs-fMRI) and neuropsychological evaluation. Patients with AD were eligible for inclusion if they: 1) met the National Institute of Neurological and Communication Disorders and Stroke-Alzheimer’s Disease and Related Disorders Association core criteria for probable mild AD [4]; 2) were aged between 50 and 80 years; and 3) were right-handed. The inclusion criteria of the control group were healthy elderly adults matched with the AD group regarding age, sex, and number of years of education. Exclusion criteria were as follows: 1) other secondary dementia; 2) history of organic brain defects on T1 or T2 images and other neurological diseases; 3) clinical signs or history of other serious mental illness such as major depressive disorder; and 4) history of drug or alcohol abuse. All participants had normal or corrected-to-normal hearing and vision. All experiments were performed with the consent of patients and their families, and written informed consent was obtained. This study was conducted according to the principles of the Declaration of Helsinki, and approved by the Anhui Provincial Medical Ethics Committee.
Neuropsychological assessments
Cognitive function and clinical symptoms were assessed in all participants using a neuropsychological background test suite, which included the Mini-Mental State Examination (MMSE), Montreal Cognitive Assessment (MoCA), Lawton-Brody Activities of Daily Living scale, Clinical Dementia Rating, Hamilton anxiety scale, Hamilton Depression Scale, Chinese version of the Auditory Verbal Learning Test (Immediate, Delay, and Recall [CAVLT-I/D/R]), Digital Span Test (forward/backward), Clock-Drawing Test, and Verbal Fluency Test (Letter and Semantic, [VFT-L/S]). All scales were assessed by senior neurology graduate students with a background in neuropsychology.
MRI acquisition
Functional and structural MRI data sets were obtained at the First Affiliated Hospital of Anhui Medical University with a 3-T scanner (Discovery 750; GE Healthcare, Milwaukee, WI, USA). All participants rested for approximately 15 min before the scan, and contraindicated objects, such as metals, were removed from the body. Patients were instructed to close their eyes but stay awake during rs-fMRI scanning. During the scanning process, all participants used earplugs to reduce noise from the scanner, and foam pads filled the space around the coil to reduce the patient’s head movement. rs-fMRI images were obtained by a standard echo planar imaging sequence (repetition time/echo time = 2000 ms/22.5 ms, flip angle = 30°, field of view = 220 mm×220 mm, matrix size = 64×64, slice thickness = 4.0 mm, with 33 continuous slices, one voxel = 3.4 mm×3.4 mm×4.6 mm, scanning time ≈7 min). Subsequently, high-resolution T1-weighted anatomical images were obtained by three-dimensional brain volume sequences in the sagittal direction (repetition time/echo time = 8.676 ms/3.184 ms, flip angle = 8°, field of view = 256 mm×256 mm, matrix size = 256×256, slice thickness = 1 mm, voxel size = 1 mm×1 mm×1 mm, scanning time ≈4 min, a total of 188 sections).
Functional data processing
We used the rs-fMRI Data Processing Assistant for Resting-State fMRI (http://rfmri.org/DPARSF) [20], TMStarget [21], and SPM12 (http://www.fil.ion.ucl.ac.uk/spm/software/spm12) for image preprocessing. Five initial volumes were excluded to avoid unstable states. Slice timing correction and rearrangement were performed next, and then individual functional images were co-registered with their respective structural images. The images were segmented into grey matter, WM, and cerebrospinal fluid using Diffeomorphic Anatomical Registration by Exponential Lie Algebra (DARTEL) [22]. The cerebrospinal fluid mask (70% threshold on the SPM12 prior probability map) in the Montreal Neurological Institute (MNI) space was converted to the individual functional space based on the transformation matrix generated by DARTEL. The mean cerebrospinal fluid mask and 24 head-motion parameter signals were regressed from each participant’s spatially functional images [23]. To correctly classify the deep brain structures identified by DARTEL as WM, the Harvard-Oxford Atlas was converted into individual functional spaces (the inverse matrix was used in a structure segmentation process) [24]. Subcortical nuclei (i.e., bilateral caudate, pallor, putamen, accumbens, thalamus, and brainstem) were removed from WM masks. Secondly, based on these two masks, the functional image was spatially divided into WM and grey matter images. Then, the WM image was segmented and normalized to MNI space. The image was smoothed by 6 mm full-width half-maximum, filtered (0.01∼0.1 Hz), made isotropic, and ALFF and fALFF values were calculated. The details of the processing were presented in a previous study [25].
The ALFF value first converts the time series of each voxel into the frequency domain to obtain the power spectrum, calculates the square root at each frequency of the power spectrum, and obtains the mean square root of 0.01–0.1 Hz for each voxel. The mean square root of ALFF is obtained. fALFF is the ratio of the low frequency (0.01–0.1 Hz) power spectrum to the whole frequency range [8, 20].
Statistical analysis
The between-group comparison of ALFF and fALFF values of WM used the SnPM permutation test in the SPM12 toolbox (http://www.nisox.org/Software/SnPM13/). Simply put, it randomizes each participant’s classification (“patient” or “control” group) 5000 times. In each trial, a two-sample t-test is used to produce a t-plot. According to the distribution of these 5000 t maps, we can infer whether the t value under the actual labelling condition is significant [26]. To control the family error in multiple comparisons, we first set a cluster-defined threshold t value of 3.18 (corresponding to p = 0.001 at the voxel level). Then, only clusters larger than a given volume would be reported as having survived the cluster-level correction (pcorr < 0.05).
Differences in demographic and neuropsychological assessment between groups and correlation analysis were performed using SPSS20.0 (IBM Corp., Armonk, NY, USA). The independent sample t-test and the Mann– Whitney U test were used in between-group comparisons of normally and non-normally distributed datasets, respectively. The χ2 test was used to analyze differences in sex ratio between the groups. Pearson correlation analysis was used to analyze the correlation between ALFF and fALFF values and neuropsychological test scores in WM of each group (without multiple comparison corrections). p < 0.05 was considered statistically significant (two-tailed).
ALFF/fALFF classification analysis based on support vector machine
To test whether neural markers identified by rs-MRI can be used as biomarkers to distinguish patients with AD from HCs, we used the linear support vector machines (SVM) method in the SVM toolkit library running on MATLAB (MathWorks.Ins, R2018b) for classification. The goal of SVM is to find an optimal separation hyperplane to maximize the edge, that is, the distance between the hyperplane and the closest point of the two classes. A linear kernel setup was performed [27, 28]. The distance to the hyperplane can be interpreted in terms of classification confidence: the larger the distance from a point to the hyperplane, the higher the classification confidence [29]. Pearson correlation analysis was used to analyze the correlation between the hyperplane distance calculated based on ALFF/fALFF and neuropsychological tests in each group, to further explore the correlation between neuroimaging indicators and cognitive function. p < 0.05 was considered statistically significant (two-tailed). Then, we used a leave-one-out cross-validation (LOOCV) strategy, with the ALFF/fALFF of six clumps significantly different between the two groups as the classification features. In short, in a fold of the leave-one-out cross-validation, one participant is ignored and used as a testing set, while the remaining participants are used as a training set. Thus, each participant is omitted only once, and the number of folds equals the total number of omitted participants. Each individual has a label (AD or HC) in the training and testing sets. Using the SVM method, a predicted label was obtained each time. The classification accuracy, specificity, sensitivity, and area under the receiver operating characteristic curve (AUC) were procured by comparing the true and predicted labels. The performance of the classifier was evaluated based on cross-validation. The significance of accuracy was determined using a permutation test (5000 permutations). In the permutation test, the label of the individuals was shuffled randomly at first; then, the LOOCV strategy was employed based on the new label. Thus, a new accuracy of classification was obtained in one permutation. According to the distribution of these 5000 accuracy values, it was inferred whether the accuracy under actual labelling conditions was significant. A p-value <0.05 was considered significant.
RESULTS
Demographic characteristics
There was no significant difference in sex (χ2 = 0.029, p = 0.865), age (t = 1.044, p = 0.299) or years of education (t = –1.717, p = 0.089) between patients with AD and HC groups. The cognitive function and clinical symptoms of the AD group were worse than those of the control group (all p < 0.05) (Table 1).
Neuropsychological tests of AD and HCs (
bIndependent sample t test; c Mann– Whitney U test. AD, Alzheimer’s disease; HCs, healthy controls; ADL, Lawton-Brody Activities of Daily Living scale; CAVLT, Chinese version of the Auditory Verbal Learning Test.
Changes of WM ALFF and fALFF in AD
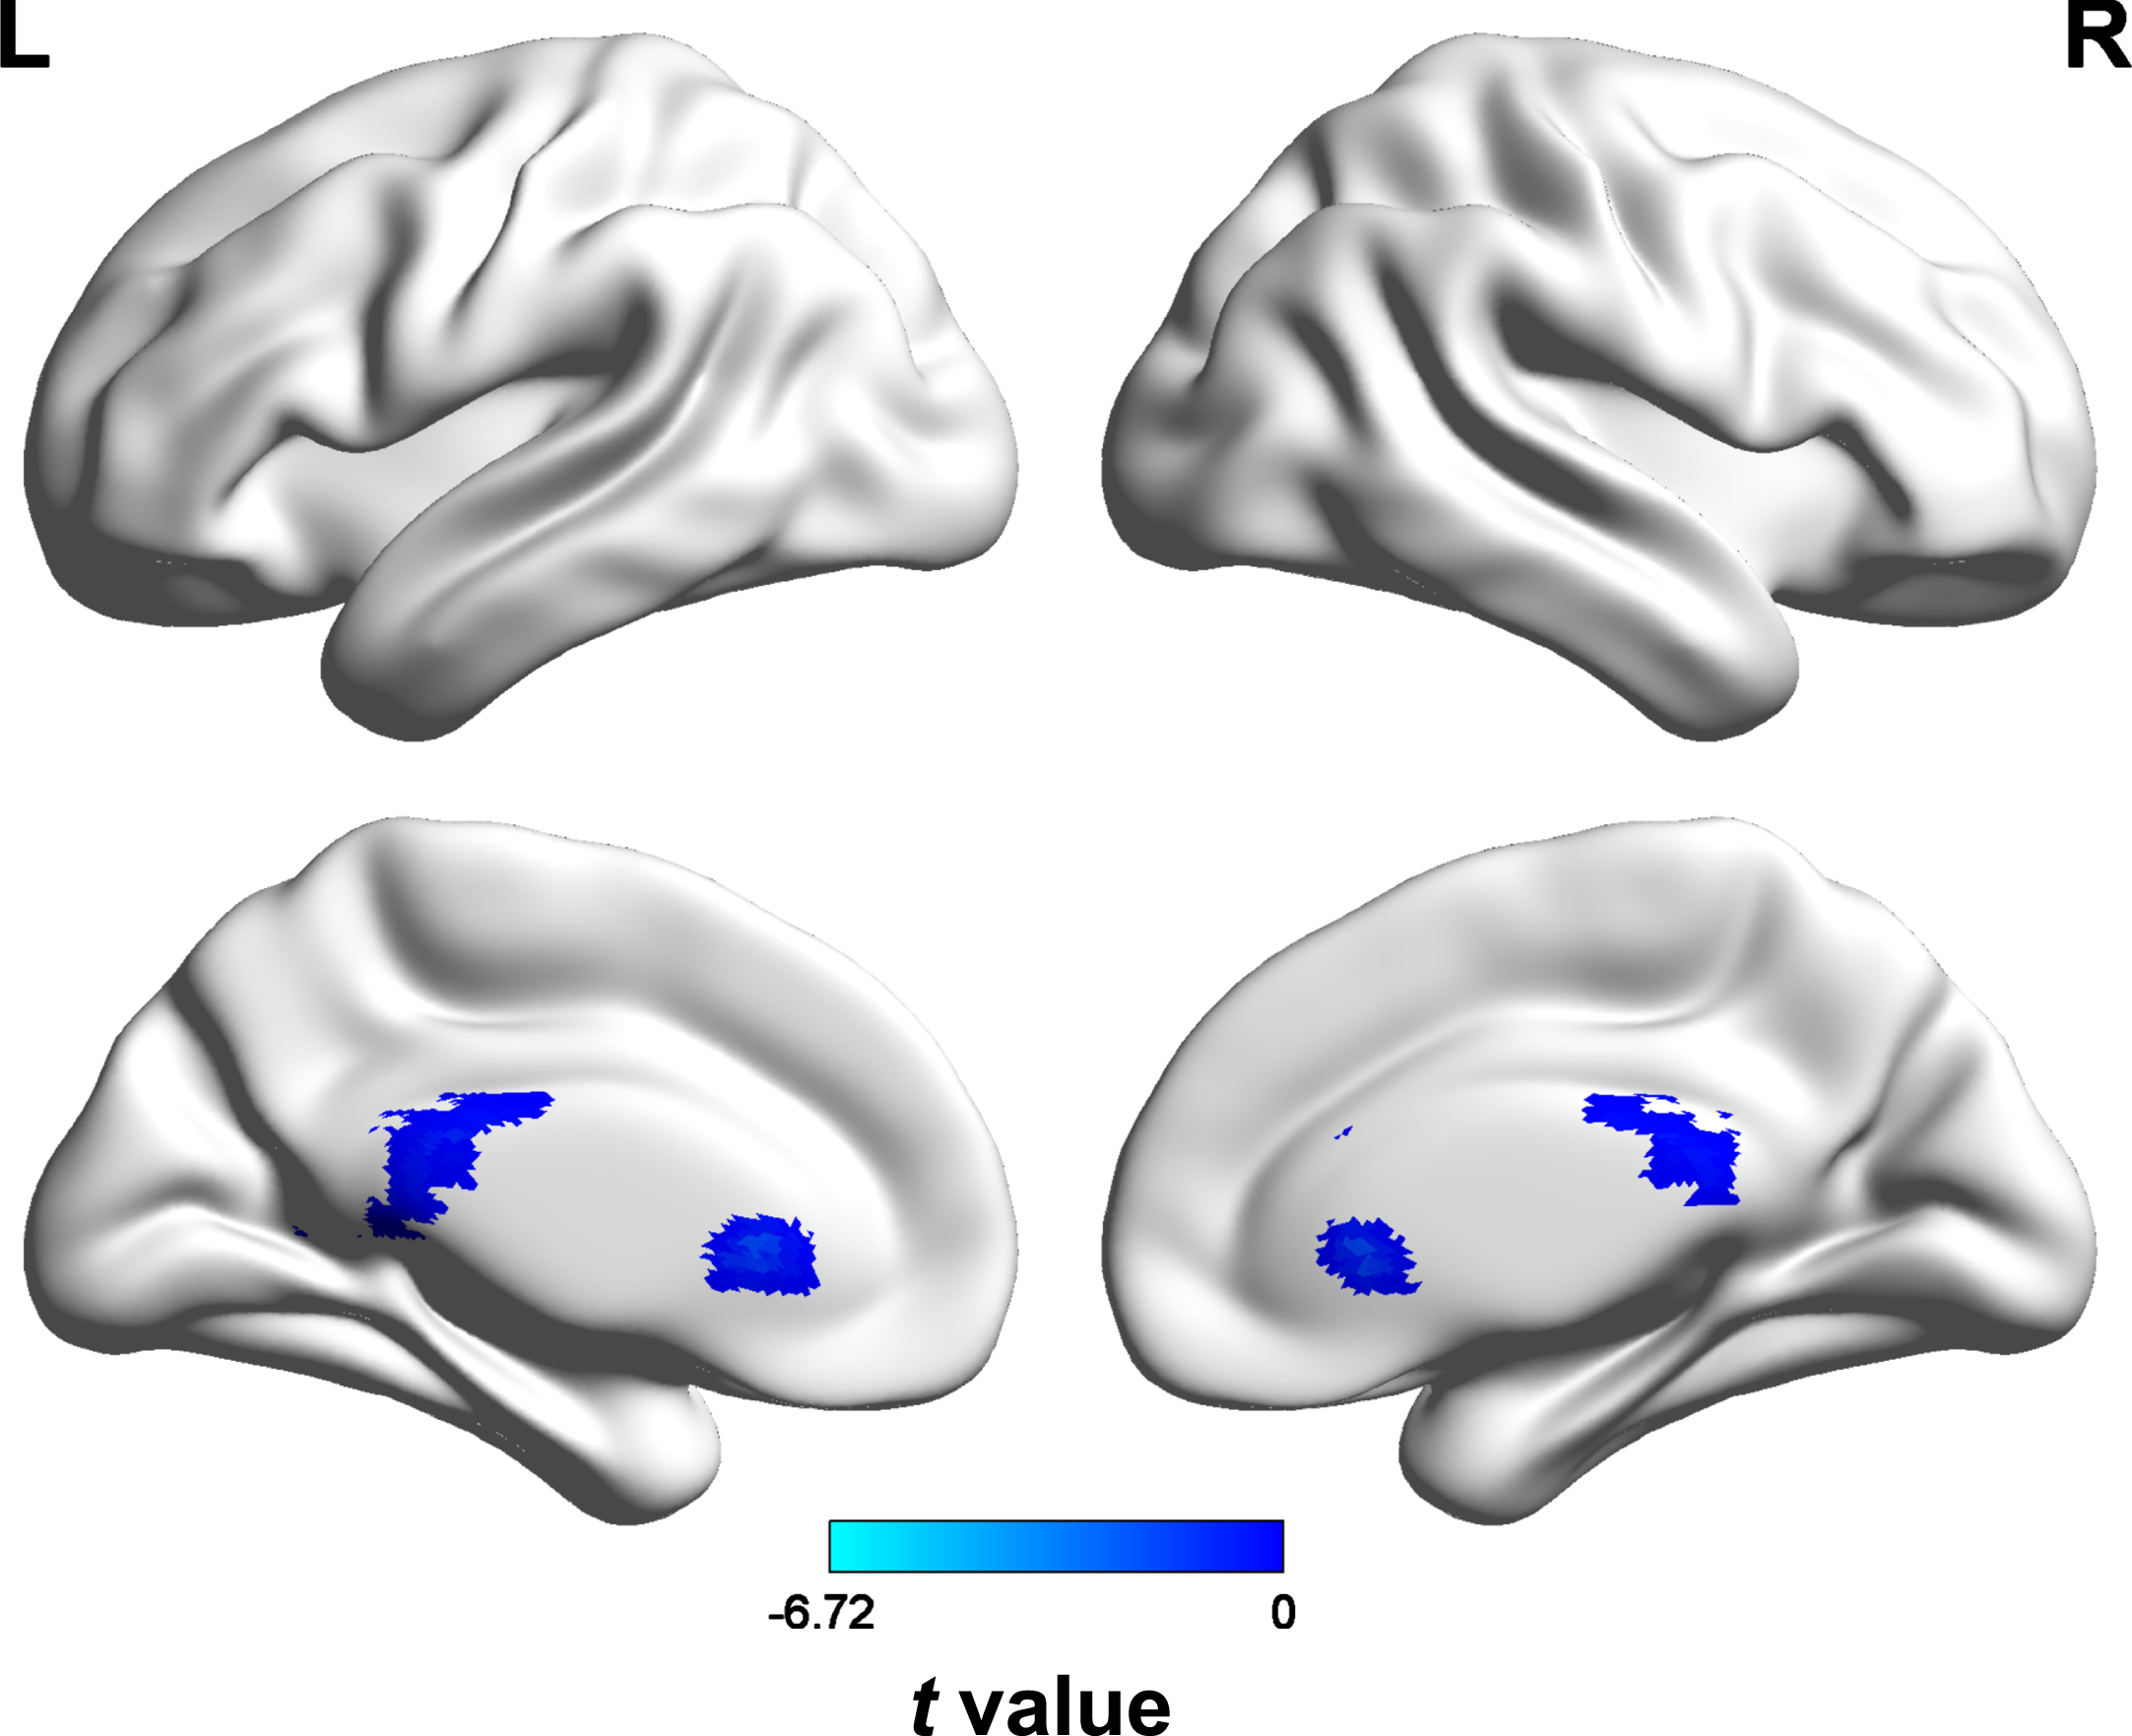
The ALFF values of the right anterior thalamic radiations (peak t-value = 6.72, MNI coordinates = [15, –27, 27], cluster size = 213 voxels), left frontal aslant tract (peak t-value = 5.91, MNI coordinates = [–18, 12, 24], cluster size = 80 voxels), and left middle longitudinal fasciculus (peak t-value = 5,84, MNI coordinates = [–27, –42, 21], cluster size = 155 voxels) in patients with AD were lower than those in HCs (all p < 0.05). Similarly, the fALFF values of the right anterior thalamic radiations (peak t-value = 7.17, MNI coordinates = [15, –27, 27], cluster size = 361 voxels), right anterior thalamic radiations (peak t-value = 5.51, MNI coordinates = [21, 30, 9], cluster size = 54 voxels), and left forceps minor (peak t-value = 5.15, MNI coordinates = [–12, 30, 3], cluster size = 20 voxels) were lower than those in the HC group (all p < 0.05) (Figs. 1 and 2, Table 2). Brain regions corresponding to significant clusters were identified using the white matter fiber template proposed by Warrington et al. [30].
Difference of ALFF and fALFF values between AD and HCs
Voxel = 2×2×2 mm3; MNI coordinate, MNI coordinates corresponding to the voxel where the t-value peak in the cluster is located. AD, Alzheimer’s disease; HCs, healthy controls; MNI, Montreal Neurological Institute; ALFF, Amplitude of low-frequency fluctuation; fALFF, fractional ALFF; L, left; R, right.
Between-group differences in ALFF values. The blue area (including the right anterior thalamic radiations, left frontal aslant tract, and left middle longitudinal fasciculus) of the color bar represents brain areas with decreased ALFF values in the AD group.

Between-group differences in fALFF values. The blue area (including the right anterior thalamic radiations and left forceps minor) of the color bar represents brain areas with decreased fALFF values in the AD group.
Correlation analyses
We analyzed the correlations between WM function and neuropsychological test scores using Pearson’s correlation coefficients. The ALFF of the right anterior thalamic radiations was correlated with MoCA (r = 0.264, p = 0.024) and VFT-Letter (r = 0.417, p = 0.003) scores in the AD group, and the ALFF of the left middle longitudinal fasciculus was correlated with MMSE (r = 0.396, p = 0.005), MoCA (r = 0.359, p = 0.013), CAVLT-I (r = 0.379, p = 0.008), CAVLT-R (r = 0.246, p = 0.092), and VFT-Letter (r = 0.510, p < 0.001) scores in the AD group. The fALFF of the right anterior thalamic radiations was correlated with MMSE (r = 0.327, p = 0.024), MoCA (r = 0.305, p = 0.037), CAVLT-I (r = 0.342, p = 0.017), and VFT-Letter (r = 0.483, p = 0.001), and the fALFF of the left forceps minor was correlated with MoCA (r = 0.340, p = 0.020) in the AD group (Table 3). There was no correlation between white matter function and neuropsychological test scores in the HC group (Supplementary Table 1).
Pearson correlation of cognitive function and ALFF/fALFF in the AD group
*p value significant at <0.05; **p value significant at <0.01; C1, Anterior thalamic radiations_R; C2, Frontal aslant_L; C3, Middle longitudinal fasciculus_L; C4, Anterior thalamic radiations_R; C5, Anterior thalamic radiations_R; C6, Forceps minor_L; C1, C4, and C5 correspond to the same white matter cellulose, but their clumps are different in size and position coordinates, so they are distinguished. MMSE, Mini-Mental State Examination; MoCA, Montreal Cognitive Assessment; CAVLT, Chinese version of the Auditory Verbal Learning Test; DST, Digital Span Test; SCWT, Stroop Color Word Test; VFT, Verbal Fluency Test; CDT, Clock-Drawing Test; ALFF, Amplitude of low-frequency fluctuation; fALFF, fractional ALFF; L, left; R, right.
Classification results
Selection of six clumps of white matter fibre bundles was based on differences in the previous ALFF/fALFF values. Using the ALFF/fALFF values of the six clumps of WM fiber bundles (ALFF values of the right anterior thalamic radiation, left frontal aslant tract, and left middle longitudinal fasciculus, as well as the fALFF values of two clumps of the right anterior thalamic radiation and left forceps minor), the accuracy of the linear SVM classifier, specificity, sensitivity, and AUC were 75%, 79%, 71%, and 85%, respectively. After conducting the permutation test, SVM accuracy was significant (p < 0.001). Further analysis of the correlation between hyperplane distance and cognitive function in the AD group showed that hyperplane distance was correlated with MMSE (r = –0.311, p = 0.031), MoCA (r = –0.318, p = 0.029), CAVLT-I (r = –0.283, p = 0.051), and VFT-Letter (r = –0.474, p = 0.001) scores (Fig. 3, Table 4). No correlation was observed between hyperplane distance and cognitive function in the HC group (Supplementary Table 2).
SVM hyperplane distance was correlated with cognitive function in the AD group
*p value significant at <0.05; **p value significant at <0.01. SVM, support vector machine; ALFF, amplitude of low-frequency fluctuation; fALFF, fractional ALFF; MMSE, Mini-Mental State Examination; MoCA, Montreal Cognitive Assessment; CAVLT, Chinese version of the Auditory Verbal Learning Test; DST, Digital Span Test; VFT, Verbal Fluency Test; CDT, Clock-Drawing Test.
Finally, we calculated the classification effect based on ALLF or fALFF and found that the accuracy, sensitivity, specificity, and AUC of the linear SVM classifier based on ALFF value alone were 74%, 71%, 77%, and 84%, while the accuracy, sensitivity, specificity, and AUC of the linear SVM classifier based on fALFF value alone were 73%, 71%, 75%, and 84%, respectively. Further analysis of the correlation between hyperplane distance and cognitive function in the AD group based solely on the ALFF values of the three differential clumps or the fALFF values of the three differential clumps showed that hyperplane distance was correlated with VFT-Letter (all p < 0.05) scores (Fig. 3, Table 4). No correlation was observed between hyperplane distance and cognitive function in the HC group (Supplementary Table 2).

Classification results based on the ALFF/fALFF. Based on ALFF and fALFF values, the linear SVM classifier achieved an accuracy of 75%, sensitivity of 71%, specificity of 79%, and AUC of 85%; Based on ALFF values alone, the linear SVM classifier has an accuracy of 74%, sensitivity of 71%, specificity of 77%, and AUC of 84%; Based on ALFF values alone, the linear SVM classifier has an accuracy of 73%, sensitivity of 71%, specificity of 75%, and AUC of 84%.
DISCUSSION
This cross-sectional study investigated WM function in patients with AD and further confirmed that ALFF and fALFF values in WM can be used as predictors of disease classification in AD. Our results showed that ALFF values of the right anterior thalamic radiation, left frontal aslant tract, and left middle longitudinal fasciculus, as well as the fALFF values of two clumps of the right anterior thalamic radiation and left forceps minor, were decreased in patients with AD and positively correlated with neuropsychological scores. In addition, a classification framework integrating ALFF and fALFF values in WM performed well in distinguishing patients with AD from controls (75% accuracy and 85% AUC). Our findings describe impaired WM cellulose function in patients with AD and provide important information for understanding the pathophysiology of AD.
Our results indicate that abnormalities in WM function may be associated with the risk and progression of AD, suggesting that in addition to the neuronal pathological features of AD, WM degeneration and demyelination may also be important pathophysiological features. In patients with AD, ALFF/fALFF values were reduced in the anterior thalamic radiation, middle longitudinal fasciculus, frontal aslant tract, and forceps minor. ALFF/fALFF values reflect low-frequency bold fluctuations in WM, and increasing evidence shows that low-frequency bold fluctuations have neurobiological significance in WM [31, 32]. Fractional anisotropy based on diffusion tensor imaging reflects the degree of myelination and axon density; its correlation with the low-frequency power of WM indicates that the low-frequency bold fluctuation in WM is related to the microstructure properties [33]. Previous evidence indicates that the low-frequency BOLD fluctuation in WM can be used to estimate the dynamic function of the fiber bundle [33]. Our findings suggest that WM function and structure are impaired in the anterior thalamic radiation, middle longitudinal fasciculus, frontal aslant tract, and forceps minor in patients with AD. Previous studies have shown that WM changes in mouse models of AD are associated with neuronal degeneration in the cortex [34], oligodendrocyte and myelin pathology are affected before the appearance of amyloid and cortical pathology, and WM destruction and altered expression of myelin markers are the earliest pathological changes [13, 15]. Moreover, microstructures such as fornix and anterior and posterior radiation of the thalamus in patients with AD are affected by AD pathology, resulting in injury [35].
The anterior thalamic radiation is the main outflow tract of the thalamus, connecting the mediodorsal thalamic nuclei to the frontal cortex and the anterior thalamic nuclei to the anterior cingulate cortices [35]. The frontal aslant tract is a short path in the frontal lobe between the inferior frontal gyrus and the posterior superior frontal gyrus. The middle longitudinal fasciculus is located in the lateral posterior cortex and is inserted in the anterior part of the superior frontal gyrus. The forceps minor forms the connection between the corpus callosum and the frontal lobe [30]. The prefrontal cortex is associated with executive function and planning complex behaviors, abnormalities in the dorsal thalamic nucleus are considered to be associated with dysfunctions of executive processes related to declarative memory, and the corpus callosum promotes higher-order cortical functions such as attention and executive tasks [35, 36]. WM fiber tracts have increasingly been shown to play a role in brain communication and improving brain connectivity [37]. Another study found that the brain’s normal functioning requires precise linking of specific grey matter regions through WM fiber channels, and the damage and loss of WM fibers lead to brain dysfunction [38]. Therefore, when these WM fibers (anterior thalamic radiation, middle longitudinal fasciculus, frontal aslant tract, and forceps minor) are damaged, they lead to a decline in the overall cognitive function, memory, attention, and executive function. Some studies have shown that global cognitive function is correlated with periventricular WM hyperintensity (WMH), and the correlation between parietal, temporal, and occipital WMH and AD is stronger than that of frontal WMH [39–41]. The correlation between WMH and cognition is stronger in patients with AD than in patients with mild cognitive impairment; that is, the downstream correlation of WMH with cognition seems to emerge at the stage of dementia [16, 42]. It has been confirmed that WMH in patients with AD may affect the WM signal in rs-fMRI [31, 43]. Therefore, we can further speculate that ALFF/fALFF values calculated based on rs-MRI in patients with AD are correlated with cognitive function, which is just confirmed by our study.
However, a relatively loose statistical threshold was adopted to explore the correlation between changes in white matter function and changes in cognitive function. We used multiple correlation analyses, but did not adjust for multiple comparisons, which may increase the risk of false positives. However, this study was based on a clear research hypothesis, and we obtained results relatively consistent with the research hypothesis. In addition, the rs-MRI-based WM ALFF/fALFF analysis was rigorously adjusted for multiple comparisons, which confirmed changes in white matter activity related to cognitive function in the AD group. These factors may reduce the risk of false positives in this experiment, to some extent. Therefore, our study results also confirmed that the ALFF/fALFF value of WM in patients with AD is correlated with cognitive function.
Recent studies have found that low-frequency bold fluctuations in the WM of the brain are not just noise but also have important physiological implications for understanding the functional role of fibre bundles in the pathology of AD neural circuits [33]. Currently, fALFF and ALFF analysis of fMRI are only based on grey matter. Studies have found that patients with AD are characterized by decreased fALFF measurements in larger grey matter areas of the brain, including the temporal cortex [44]. As the disease progresses, ALFF/fALFF values decrease in several grey matter regions of the brain, including the paracingulate gyrus, right middle cingulate gyrus, bilateral inferior cerebellar lobe, bilateral anterior lobe, and right anterior cingulate gyrus. It has been confirmed that ALFF/fALFF based on grey matter can help discover the AD continuum’s underlying pathological mechanism [45]. However, a study found that WM showed blood-oxygen-dependent signal fluctuations similar to those of the grey matter, and the signals in the white matter network were related to the signals in the functional grey matter network [46]. Therefore, we speculate that ALFF and fALFF, which can reflect WM function, are also important imaging indicators for the diagnosis of AD and can be used as predictors for the diagnosis and classification of the disease.
Based on this, we further used machine learning algorithms to construct a classifier and found that the WM activity features of the damaged brain regions could classify the unevaluated individuals with moderate accuracy. Analyzing the findings of the correlation between SVM hyperplane distance and cognitive function in the AD group, hyperplane distance was associated with cognitive function. In the AD group, the hyperplane distance was negatively correlated with cognitive function. The greater the hyperplane distance, the higher the confidence in diagnosing AD and the worse the cognitive function. The high recognition accuracy indicates that both ALFF and fALFF can describe spontaneous functional changes in brain regions of patients on the AD spectrum [45]. This association was not found in the HC group, possibly due to the “ceiling” effect in the cognitive assessment of healthy subjects or the absence of significant abnormalities in white matter function in healthy subjects. These two different parameters show similarities in the main outcome and differences in specific brain regions, which may indicate inherent differences in specificity and sensitivity between the two measures [47]. We found that in the AD phase, the classification framework that integrates ALFF and fALFF achieves the best performance compared with a classification framework that selects only one of them or simply combines them [48]. This procedure is efficient and reliable, allowing us to distinguish patients with AD with moderate accuracy and AUC values, indicating that the ALFF/fALFF values obtained from the WM may be a potential indicator for monitoring disease progression, which is confirmed in our study.
There were some limitations to our study. In this cross-sectional study, the patients we recruited according to the National Institute of Neurological and Communication Disorders and Stroke-Alzheimer’s Disease and Related Disorders Association criteria were all clinically likely to have AD. The lack of biomarkers may have led to classification bias, and AD patients were not classified early in our study. Next, unlike grey matter, the physiological basis of BOLD signals in WM remains undefined, and the parameters used for fMRI preconditioning in the grey matter may not be the best for WM [49, 50]. Some studies have found that BOLD fMRI signals are indeed present in the WM region, and the underlying biological mechanism may be related to the presence of blood vessels and the detectability of cerebral blood flow and cerebral blood volume [51, 52]. Although BOLD signals in WM are weaker than those in grey matter (lower Signal to Noise Ratio), they can be robustly detected in response to stimuli and a resting state with appropriate detection and analysis methods [52, 53]. Notably, we show for the first time that WM fiber ALFF/fALFF value based on rs-fMRI BOLD signals also carries meaningful functional information in patients with AD. Future studies into the neurophysiology of WM BOLD signals may further explain the findings of patients with AD.
In conclusion, our results demonstrate decreased ALFF and fALFF values in patients with AD in the anterior thalamic radiation, middle longitudinal fasciculus, frontal aslant tract, and forceps minor, regions which are associated with global cognitive function, memory, and attention function. SVM hyperplane distance was found to be correlated with cognitive function, and ALFF and fALFF values in WM could be used as a predictor for AD disease classification.
Footnotes
ACKNOWLEDGMENTS
We thank the participants for their cooperation during this study.
FUNDING
This work was supported by the National Natural Science Foundation of China (no.821001498 to X. W., 82171917 to P. H., 82090034 and 31970 to K.W., and 32071054 to Y.T), the 2021 Youth Foundation training program of the First Affiliated Hospital of Anhui Medical University (no. 2021kj19 to X.W.), and the Scientific Research Project of Anhui Provincial Education Department (YJS20210273 to AHMU).
CONFLICT OF INTEREST
The authors declare that the research was conducted in the absence of any commercial or financial relationships that could be construed as a potential conflict of interest.
DATA AVAILABILITY
All datasets generated for this study are included in the manuscript and/or the supplementary files. The data that support the findings of this study are available from the corresponding authors upon request.