
Abstract
Background:
Alzheimer’s disease (AD) is the most common dementia syndrome in the elderly characterized by synaptic failure and unique brain pathology. De novo protein synthesis is required for the maintenance of memory and synaptic plasticity. Mounting evidence links impaired neuronal protein synthesis capacity and overall protein synthesis deficits to AD pathogenesis. Meanwhile, identities of AD-associated dysregulation of “newly synthesized proteome” remain elusive.
Objective:
To investigate de novo proteome alterations in the hippocampus of aged Tg19959 AD model mice.
Methods:
In this study, we combined the bioorthogonal noncanonical amino acid tagging (BONCAT) method with the unbiased large-scale proteomic analysis in acute living brain slices (we name it “BONSPEC”) to investigate de novo proteome alterations in the hippocampus of Tg19959 AD model mice. We further applied multiple bioinformatics methods to analyze in-depth the proteomics data.
Results:
In total, 1,742 proteins were detected across the 10 samples with the BONSPEC method. After exclusion of those only detected in less than half of the samples in both groups, 1,362 proteins were kept for further analysis. 37 proteins were differentially expressed (based on statistical analysis) between the WT and Tg19959 groups. Among them, 19 proteins were significantly decreased while 18 proteins were significantly increased in the hippocampi of Tg19959 mice compared to WT mice. The results suggest that proteins involved in synaptic function were enriched in de novo proteome of AD mice.
Conclusion:
Our study could provide insights into the future investigation into the molecular signaling mechanisms underlying AD and related dementias (ADRDs).
INTRODUCTION
Alzheimer’s disease (AD) is the most common form of dementia in the elderly and becomes a global threat to public health with significant population aging worldwide. It’s estimated that worldwide there are about 416 million persons with AD continuum, including AD dementia, prodromal AD, and preclinical AD, and constitutes 22% of all persons aged 50 and above [1]. While the formation of brain amyloid-β (Aβ) plaques and neurofibrillary tangles are the two diagnostic hall markers of AD, the underlying causes of the disease remain elusive [2, 3]. Mounting evidence indicates that synaptic failure is an early and key pathological feature in the development of AD [4–7]. Decades of research in the field of neuroscience has demonstrated that integral de novo protein synthesis is indispensable for the maintenance of synaptic plasticity and memory. Interestingly, multiple lines of study suggest that impairments of overall de novo protein synthesis could contribute to synaptic impairment and cognitive deficit in AD [3, 8–13]. De novo protein synthesis is regulated by hundreds of translation factors, which link protein translation with all kinds of cellular events [14]. Previous studies revealed AD-related dysregulations of multiple translation factors that are involved in initiation and elongation, indicating impaired translational machinery [11, 15–19]. Meanwhile, very few studies focus on AD-related alterations of de novo proteome, i.e., identities of newly synthesized proteins, which may help uncover novel signaling pathways associated with AD pathogenesis [20].
Since all proteins are made from the same pool of amino acids and are chemically indistinguishable, it would be challenging to identify selectively the newly synthesized proteome with traditional proteomics approaches such as mass spectrometry (MS). One technique to label the overall newly synthesized proteins is Bioorthogonal noncanonical amino acid tagging (BONCAT) [21, 22]. In BONCAT, an amino acid analogue such as L-Azidohomoalanine (L-AHA) can be incorporated into the nascent peptides. This is followed by “click reaction” chemistry in which biotin conjugated to azide or alkyne is added and the AHA moieties are tagged with the biotin additive.
In this study, we combined the BONCAT method with an unbiased large-scale proteomic analysis in acute living brain slices (we name it “BONSPEC”) to investigate de novo proteome alterations in hippocampus of aged Tg19959 AD model mice and wild-type (WT) control mice. The results could provide insights into previously unrecognized mechanisms underlying the AD pathophysiology.
MATERIALS AND METHODS
Animals
All mice were housed at the Wake Forest University School of Medicine barrier facility under the supervision of Animal Research Program. Mice adhered to a 12-h light/12-h dark cycle with regular feeding, cage cleaning, and 24-h food and water access. Breeders for Tg19959 AD model mice were provided by George Carlson of McLaughlin Research Institute (Great Falls, MT, USA) [23]. The mice encode a double mutant form of amyloid precursor protein (APP) 695 (KM670/671NL+V717F) under the control of the PrP gene promoter. Genotypes were verified by PCR. The age of the mice used in this study was 8–10 months. Both male and female mice were included in this study. No randomization or sample calculation was performed to allocate mice in this study. No blinding was performed. All animal experiments were performed in accordance with the approval of the Institutional Animal Care and Use Committee at Wake Forest University (protocol number A17-116).
Hippocampal slice preparation
Mice were sacrificed by cervical dislocation and whole brains were taken out. Acute 400-μm transverse hippocampal slices were prepared using a Leica VT1200S vibratome as described before [24]. Slices were then maintained at room temperature before experimentation for 2 h in artificial cerebrospinal fluid (ACSF) containing the following: 118 mM NaCl, 3.5 mM KCl, 2.5 mM CaCl2, 1.3 mM MgSO4, 1.25 mM NaH2PO4, 5 mM NaHCO3, and 15 mM glucose, bubbled with 95% O2/5% CO2.
L-AHA labeling and click chemistry reaction
Slices were incubated at 32°C in bubbling ACSF containing 1 mM L-AHA (Click-IT, Invitrogen) for 3 h and were flash frozen. Samples were then lysed in lysis buffer (T-PER, Thermo Fisher Scientific) with protease inhibitor by sonication and protein concentrations were determined by BCA assay. 200μg proteins from each samples were mixed with 100μL reagent buffer containing alkyne-biotin and other reagents according the guidance of click chemistry kit (Click-IT, Invitrogen). The mixtures were rotated end-over-end in a rotator at 4°C overnight.
Protein enrichment and on-beads tryptic digestion
Biotin-labeled lysate was precipitated by an overnight incubation at –20°C with four times the sample volume of cold acetone. Tube was centrifuged at 14,000× g for 10 min and supernatant was discarded. Protein pellet was air-dried for 10 min and then re-constituted in 100μL PBS containing 1% sodium dodecyl sulfate (SDS). Protein suspension was diluted ten folds with 50 mM ammonium bicarbonate prior to enrichment procedure. Approximately 250μL of streptavidin agarose beads suspension (Cat.# 20361, Thermo Scientific, Waltham, MA, USA) was taken and equilibrated in four bed volumes of PBS containing 0.1% SDS for 10 min. The equilibration was repeated twice. Biotinylated protein sample was added to the beads and incubated on an end-over-end rotator overnight at 4°C. Non-specifically bound proteins were removed by washing the beads sequentially with 2 M urea, 1 M NaCl, 0.1% SDS, 10 mM DTT, and 50 mM ammonium bicarbonate. Washed beads were transferred to a Pierce Centrifuge Column (Cat.# 89868, Thermo Scientific) and trypsin solution (2.5μg of sequencing grade modified trypsin in 250μL of 50 mM ammonium bicarbonate) was added to the column. The column was incubated overnight at 37°C on a shaker. 10μL of 10% formic acid was added to the column to quench enzymatic reaction. Peptides were collected by centrifugation at 2,000× g for 5 min which were then desalted using a C18 spin column. Purified peptides were dried under vacuum and constituted in 5% (v/v) acetonitrile containing 1% (v/v) formic acid for LC-MS/MS analysis.
LC-MS/MS analysis
Samples were analyzed on a LC-MS/MS system consisted of an Orbitrap Velos Pro Mass Spectrometer (Thermo Scientific) and a Dionex Ultimate-3000 nano-UPLC system (Thermo Scientific). An Acclaim PepMap 100 (C18, 5μm, 100 Å, 100μm×2 cm; Thermo Scientific) trap column and an Acclaim PepMap RSLC (C18, 2μm, 100 Å, 75μm×50 cm; Thermo Scientific) analytical column were employed for peptide separation. MS spectra were acquired by data dependent scans consisting of MS/MS scans of the ten most intense ions from the full MS scan with dynamic exclusion option which was 30 seconds. To identify proteins, spectra were searched using Sequest HT algorithm within the Proteome Discoverer v2.2 (Thermo Scientific) in combination with the UniProt mouse protein FASTA database (16,747 annotated entries, Dec 2015). Search parameters were as follows; FT-trap instrument, parent mass error tolerance of 10 ppm, fragment mass error tolerance of 0.6 Da (monoisotopic), maximum missed cleavage# of 2; variable modifications of +15.995 Da (oxidation) on methionine.
Statistics and bioinformatic analysis
Hierarchical clustering was used to detect outliers by hclust function in R and no outliers were detected. Differentially expressed proteins between two groups were identified using 2-tailed t test and presented in heat map and volcano plot generated with ggplot2 package (version 3.3.5) in R (version 4.1.2). Proteins in Tg19959 mice with levels increased or decreased by at least 20% (120% or 80% of WT) with p values <0.05 were considered significantly changed. Gene ontology (GO) analysis and gene set enrichment analysis (GSEA) were done with clusterProfiler package (4.2.2) in R. Significantly enriched protein sets identified by GSEA were then mapped to Kyoto Encyclopedia of Genes and Genomes (KEGG) pathway maps. Weighted gene co-expression network analysis (WGCNA) was done with WGCNA package (version 1.70.3) in R with following settings: soft threshold power = 6, deepSplit = 2, minimum module size = 20, merge cut height = 0.25. Association analysis between modules and genotypes was done by the “cor” function in R.
RESULTS
We carried out studies in mice using the BONSPEC method (as illustrated in Fig. 1A) to identify AD-related alterations of new protein synthesis profiling in the brain. In brief, acute living hippocampal slices from aged (8–10 months) Tg19959 AD model mice and WT littermates (5 mice for each group) were included with 1 mM L-AHA in ACSF at 32°C for 3 h to label the newly synthesized proteins. Samples were then lysed and mixed with alkyne-biotin overnight to form the biotin-labeled proteins, which were then pulled down by chromatography. LC-MS/MS experiments were performed to identify and quantify these separated proteins.
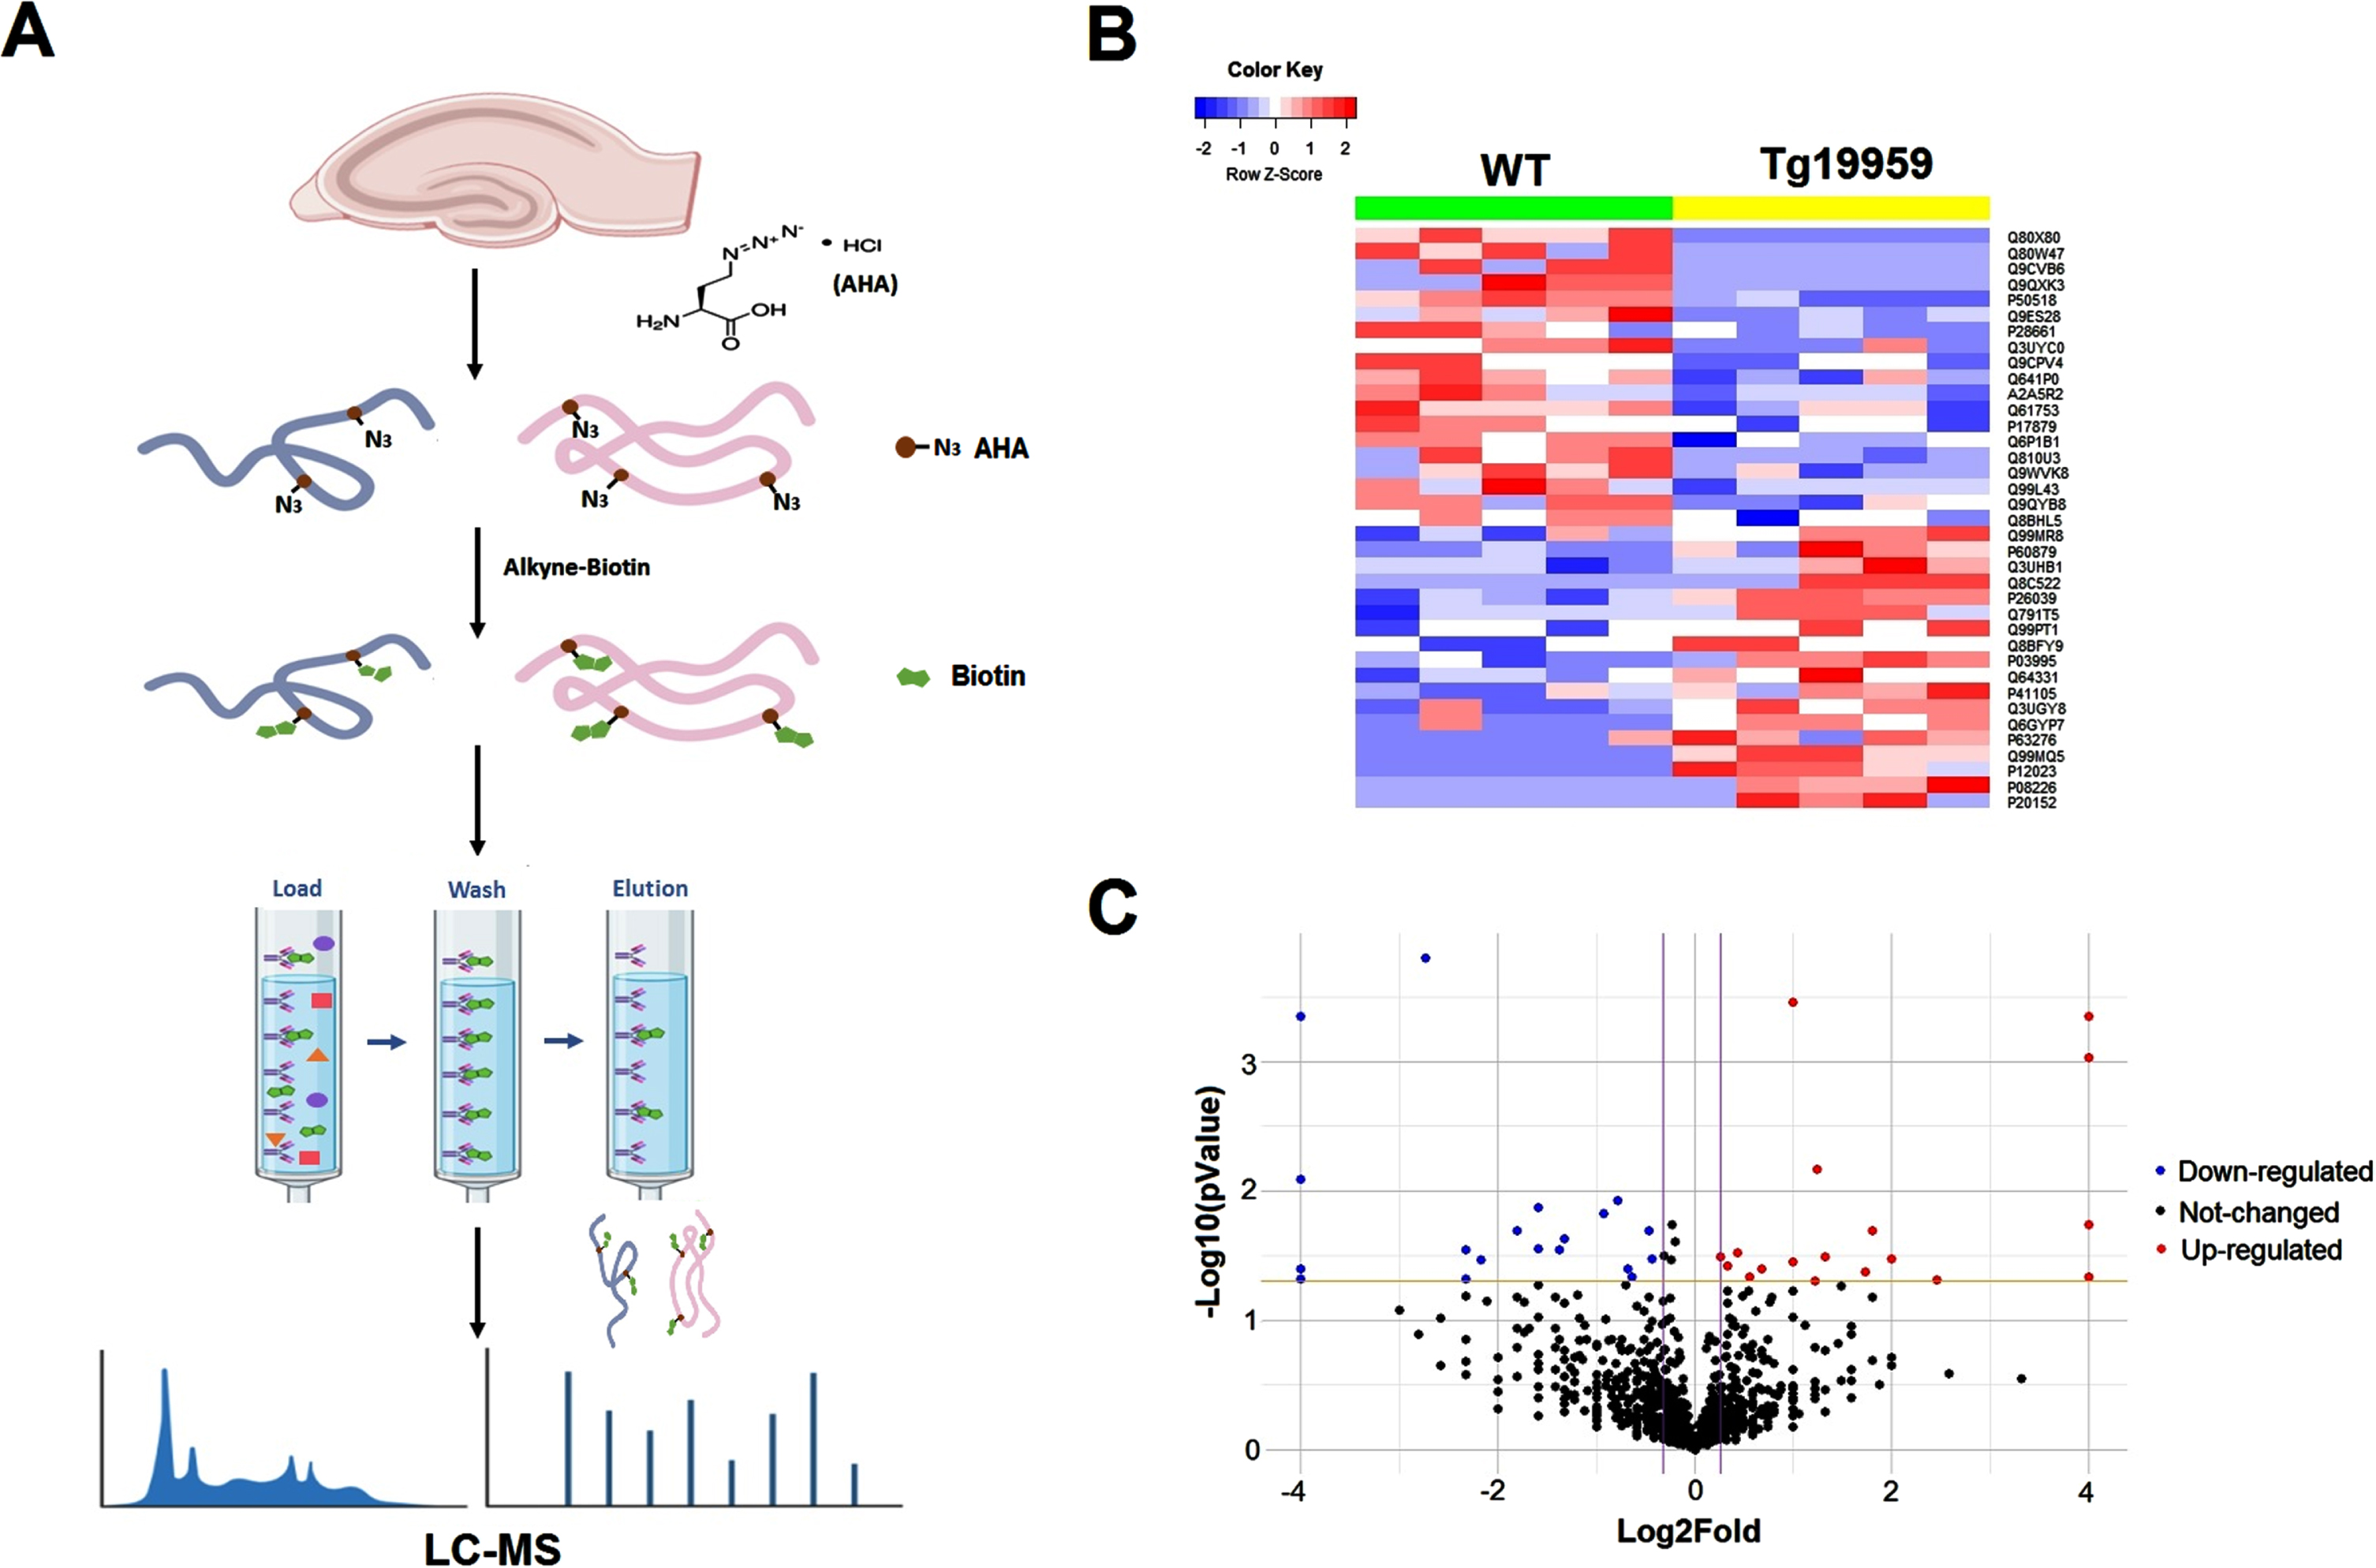
Differentially expressed proteins in the de novo proteome between WT and Tg19959 mice. A) A schematic flowchart of the BONSPEC method in hippocampal slices. B) A heat map shows differentially expressed proteins in the de novo proteome between WT and Tg19959 mice. Characters on the right of heat map are UNIPROT ID of those proteins. C) Volcano plot of all the proteins in the de novo proteome. X axis is log2 of fold changes in Tg19959 mice compared to WT mice, Y axis is – log10 of p values of t-test between the two groups. Red dots represent upregulated proteins, blue dots represent downregulated proteins, and black dots represent unchanged proteins.
A total of 1,742 proteins were detected across the 10 samples with the BONSPEC method. After exclusion of those only detected in less than half of the samples in both groups, 1,362 proteins were kept for further analysis. 37 proteins were differentially expressed (based on statistical analysis) between the two groups, and the pattern was shown in a heat map (Fig. 1B). Among them, 19 proteins were significantly decreased while 18 proteins were significantly increased in the hippocampi of Tg19959 mice compared to WT mice, as shown in the Tables 1 and 2 and the volcano plot in Fig. 1C.
List of upregulated proteins in hippocampus of Tg19959 AD model mice
List of downregulated proteins in hippocampus of Tg19959 AD model mice
To obtain insights into the functions of the dysregulated proteins in AD mice, we then conducted the GO enrichment analysis. As shown in Fig. 2A, most enriched proteins are involved in regulation of synaptic transmission, synaptic plasticity, and long-term synaptic potentiation. We also noticed some of the dysregulated proteins were enriched in regulation of tau protein kinase activity, amyloid fibril formation, astrocyte and glia development, etc. We further conducted GSEA analysis between the two groups. As shown in Fig. 2B, four signaling pathways were significantly enriched in the de novo proteome in Tg19959 mice compared to WT mice, including the SNARE interactions in vesicle transport, fat digestion and absorption, hedgehog signaling pathway, and the citrate cycle (TCA cycle). All these enriched proteins were suppressed in AD mice except for the one involved in the TCA cycle, which was activated in Tg19959 mice compared to the WT mice. SNARE proteins function as the components of the eukaryotic fusion machinery for fusion of synaptic vesicles with the membrane [25]. We performed further analysis on SNARE interaction in vesicle transport, since it is the most significantly enriched signaling pathway in the de novo proteome. Figure 3A showed the GSEA plot of the SNARE interaction in vesicle transport, which highlighted the positions of the proteins enriched in this signaling pathway in the ranked list of genes. Proteins found to be enriched in SNARE interaction in vesicle transport included synaptobrevin homolog YKT6, vesicle-trafficking protein SEC22b, and vesicle-associated membrane protein 1. We then mapped these proteins to a KEGG pathway diagram which showed the network involved in SNARE interaction in vesicle transport, as shown in Fig. 3B. Taken together, GO analysis and GSEA analysis revealed that synapse-related activities and signaling pathways were suppressed in de novo proteome in AD model mice, which was consistent with previous studies indicating that synaptic dysfunction was a distinct characteristic in AD.
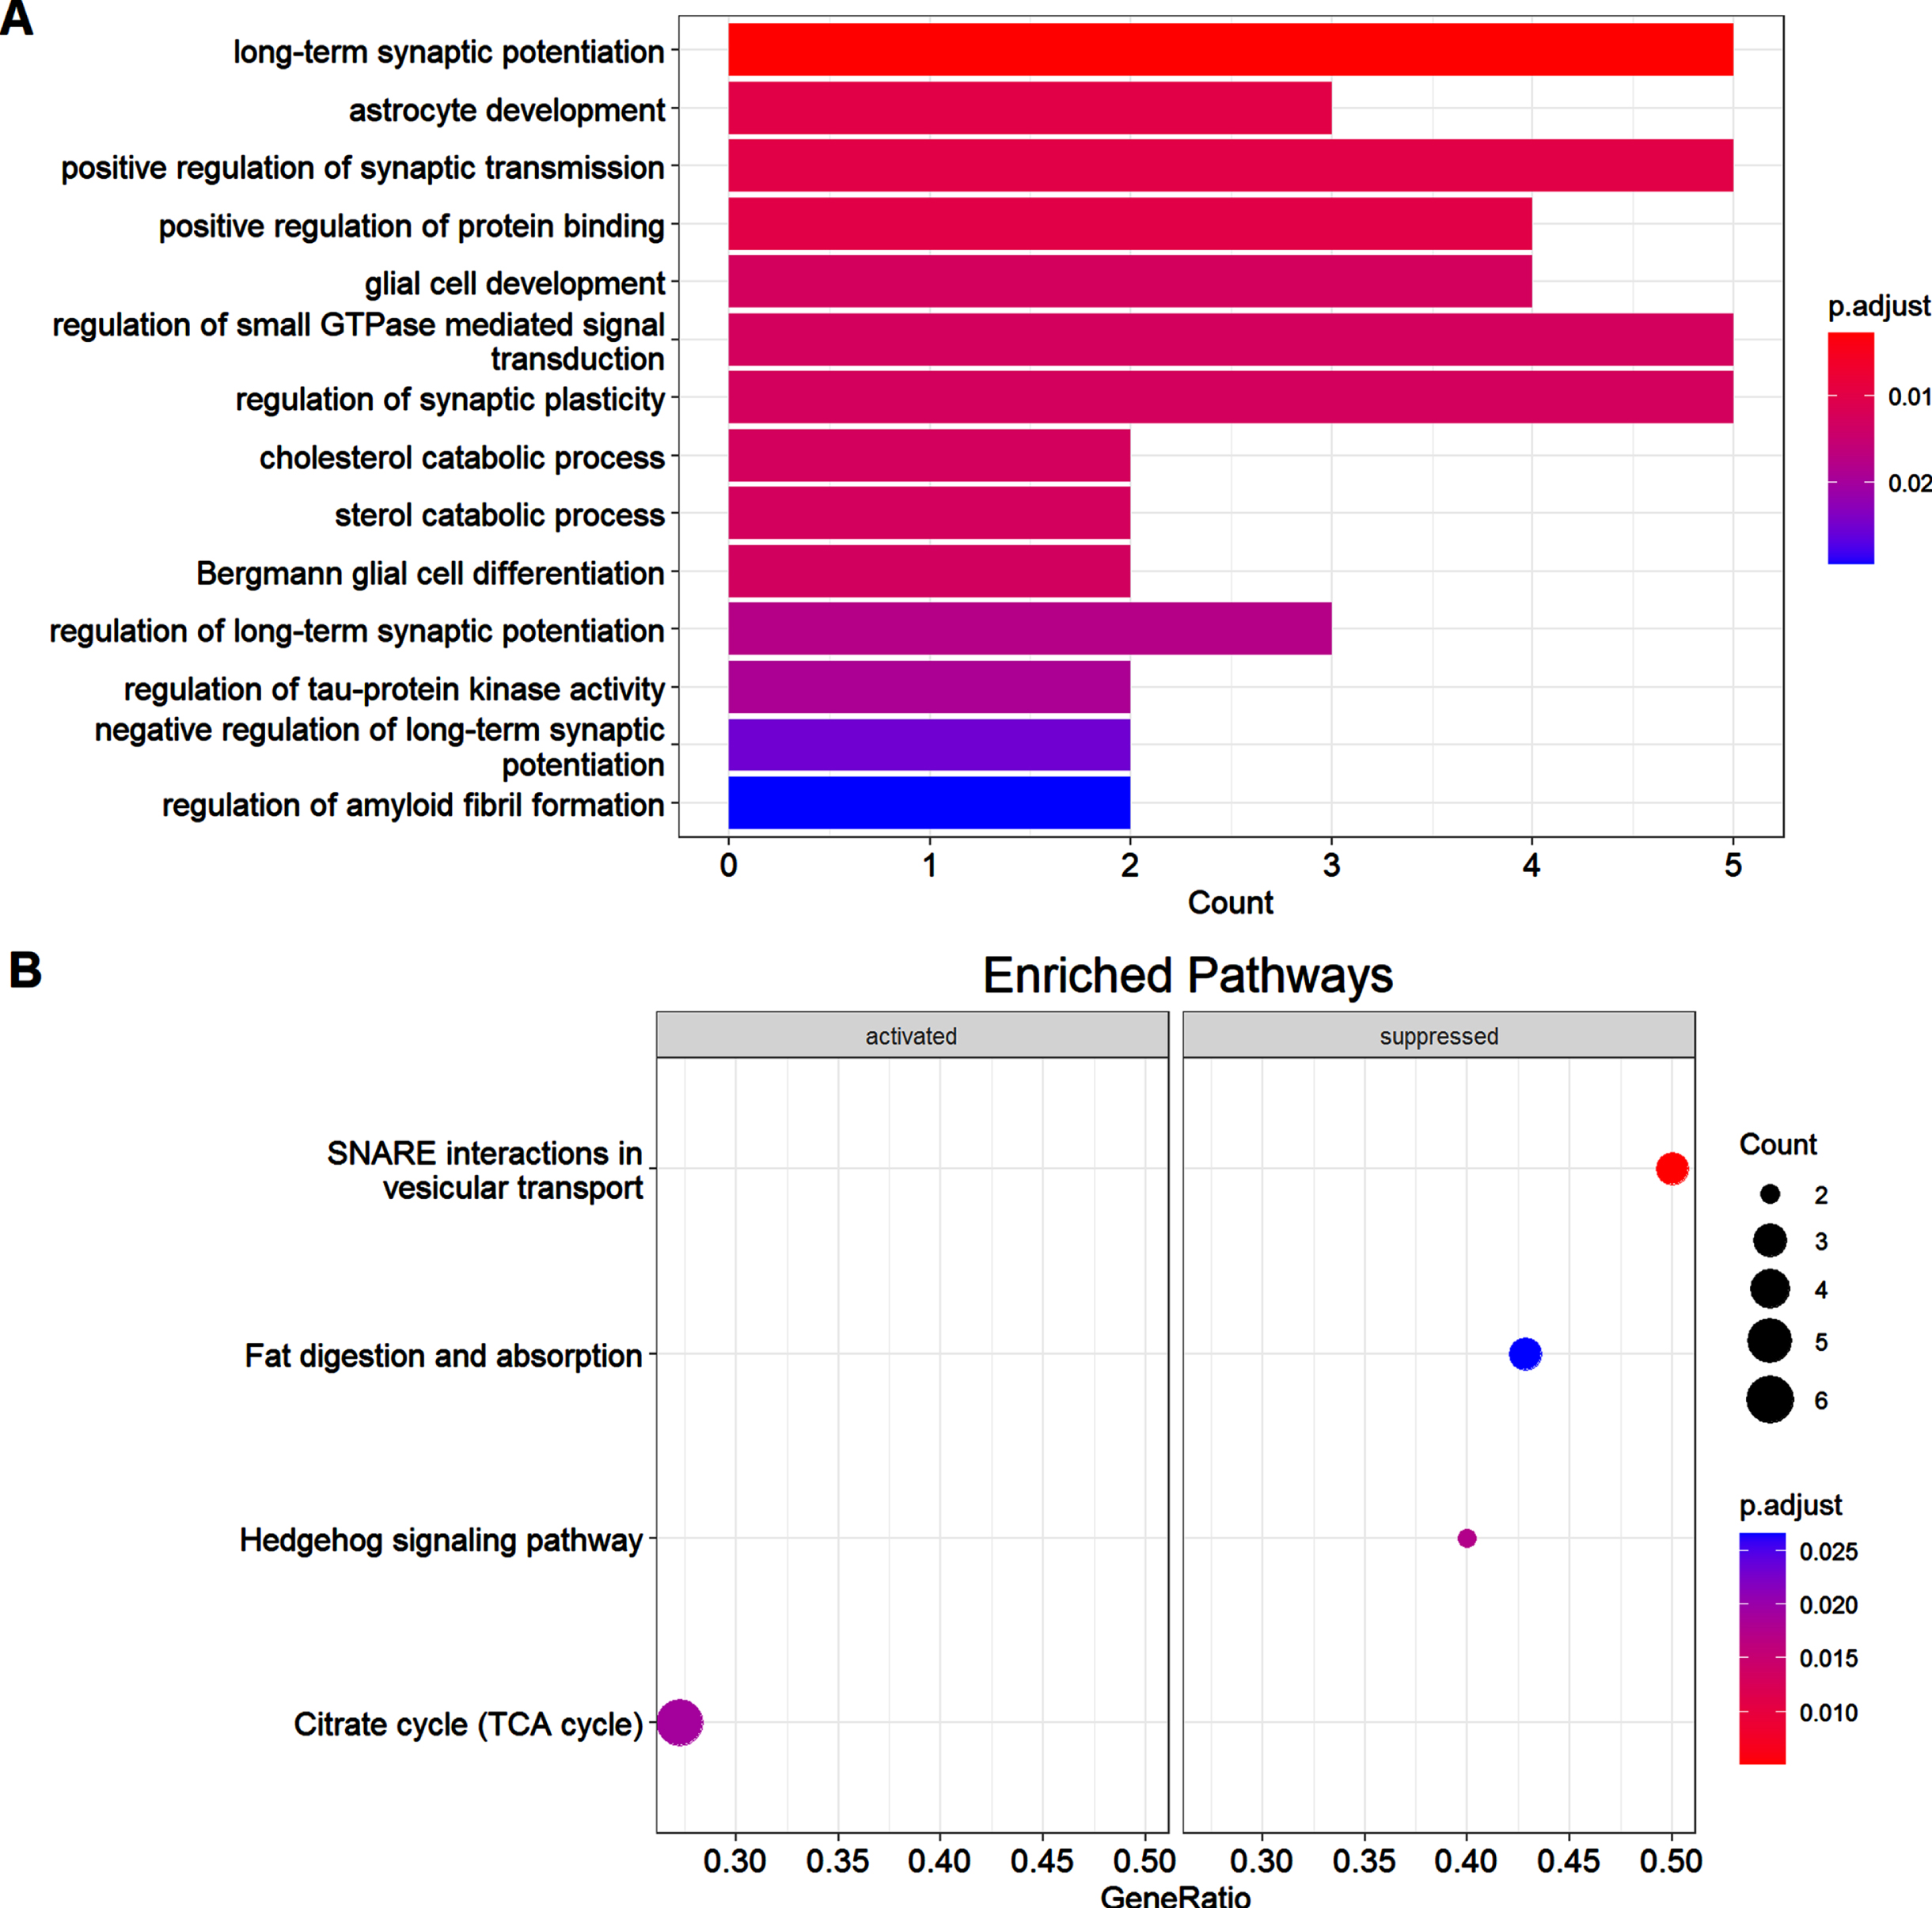
GO analysis of differentially expressed proteins and GSEA analysis of the de novo proteome between the two groups. A) Bar plot of GO analysis of differentially expressed proteins between the two groups. Colors of the bars represent adjusted p values of that terms as indicated by the scale bar next to the bar plot. B) Dot plot of GSEA analysis of de novo proteome between the two groups. Colors of the dots represent adjusted p values as indicated by the scale bar next to the dot plot. Sizes of the dots represent counts of proteins in that terms as indicated by the scale dots next to the dot plot.
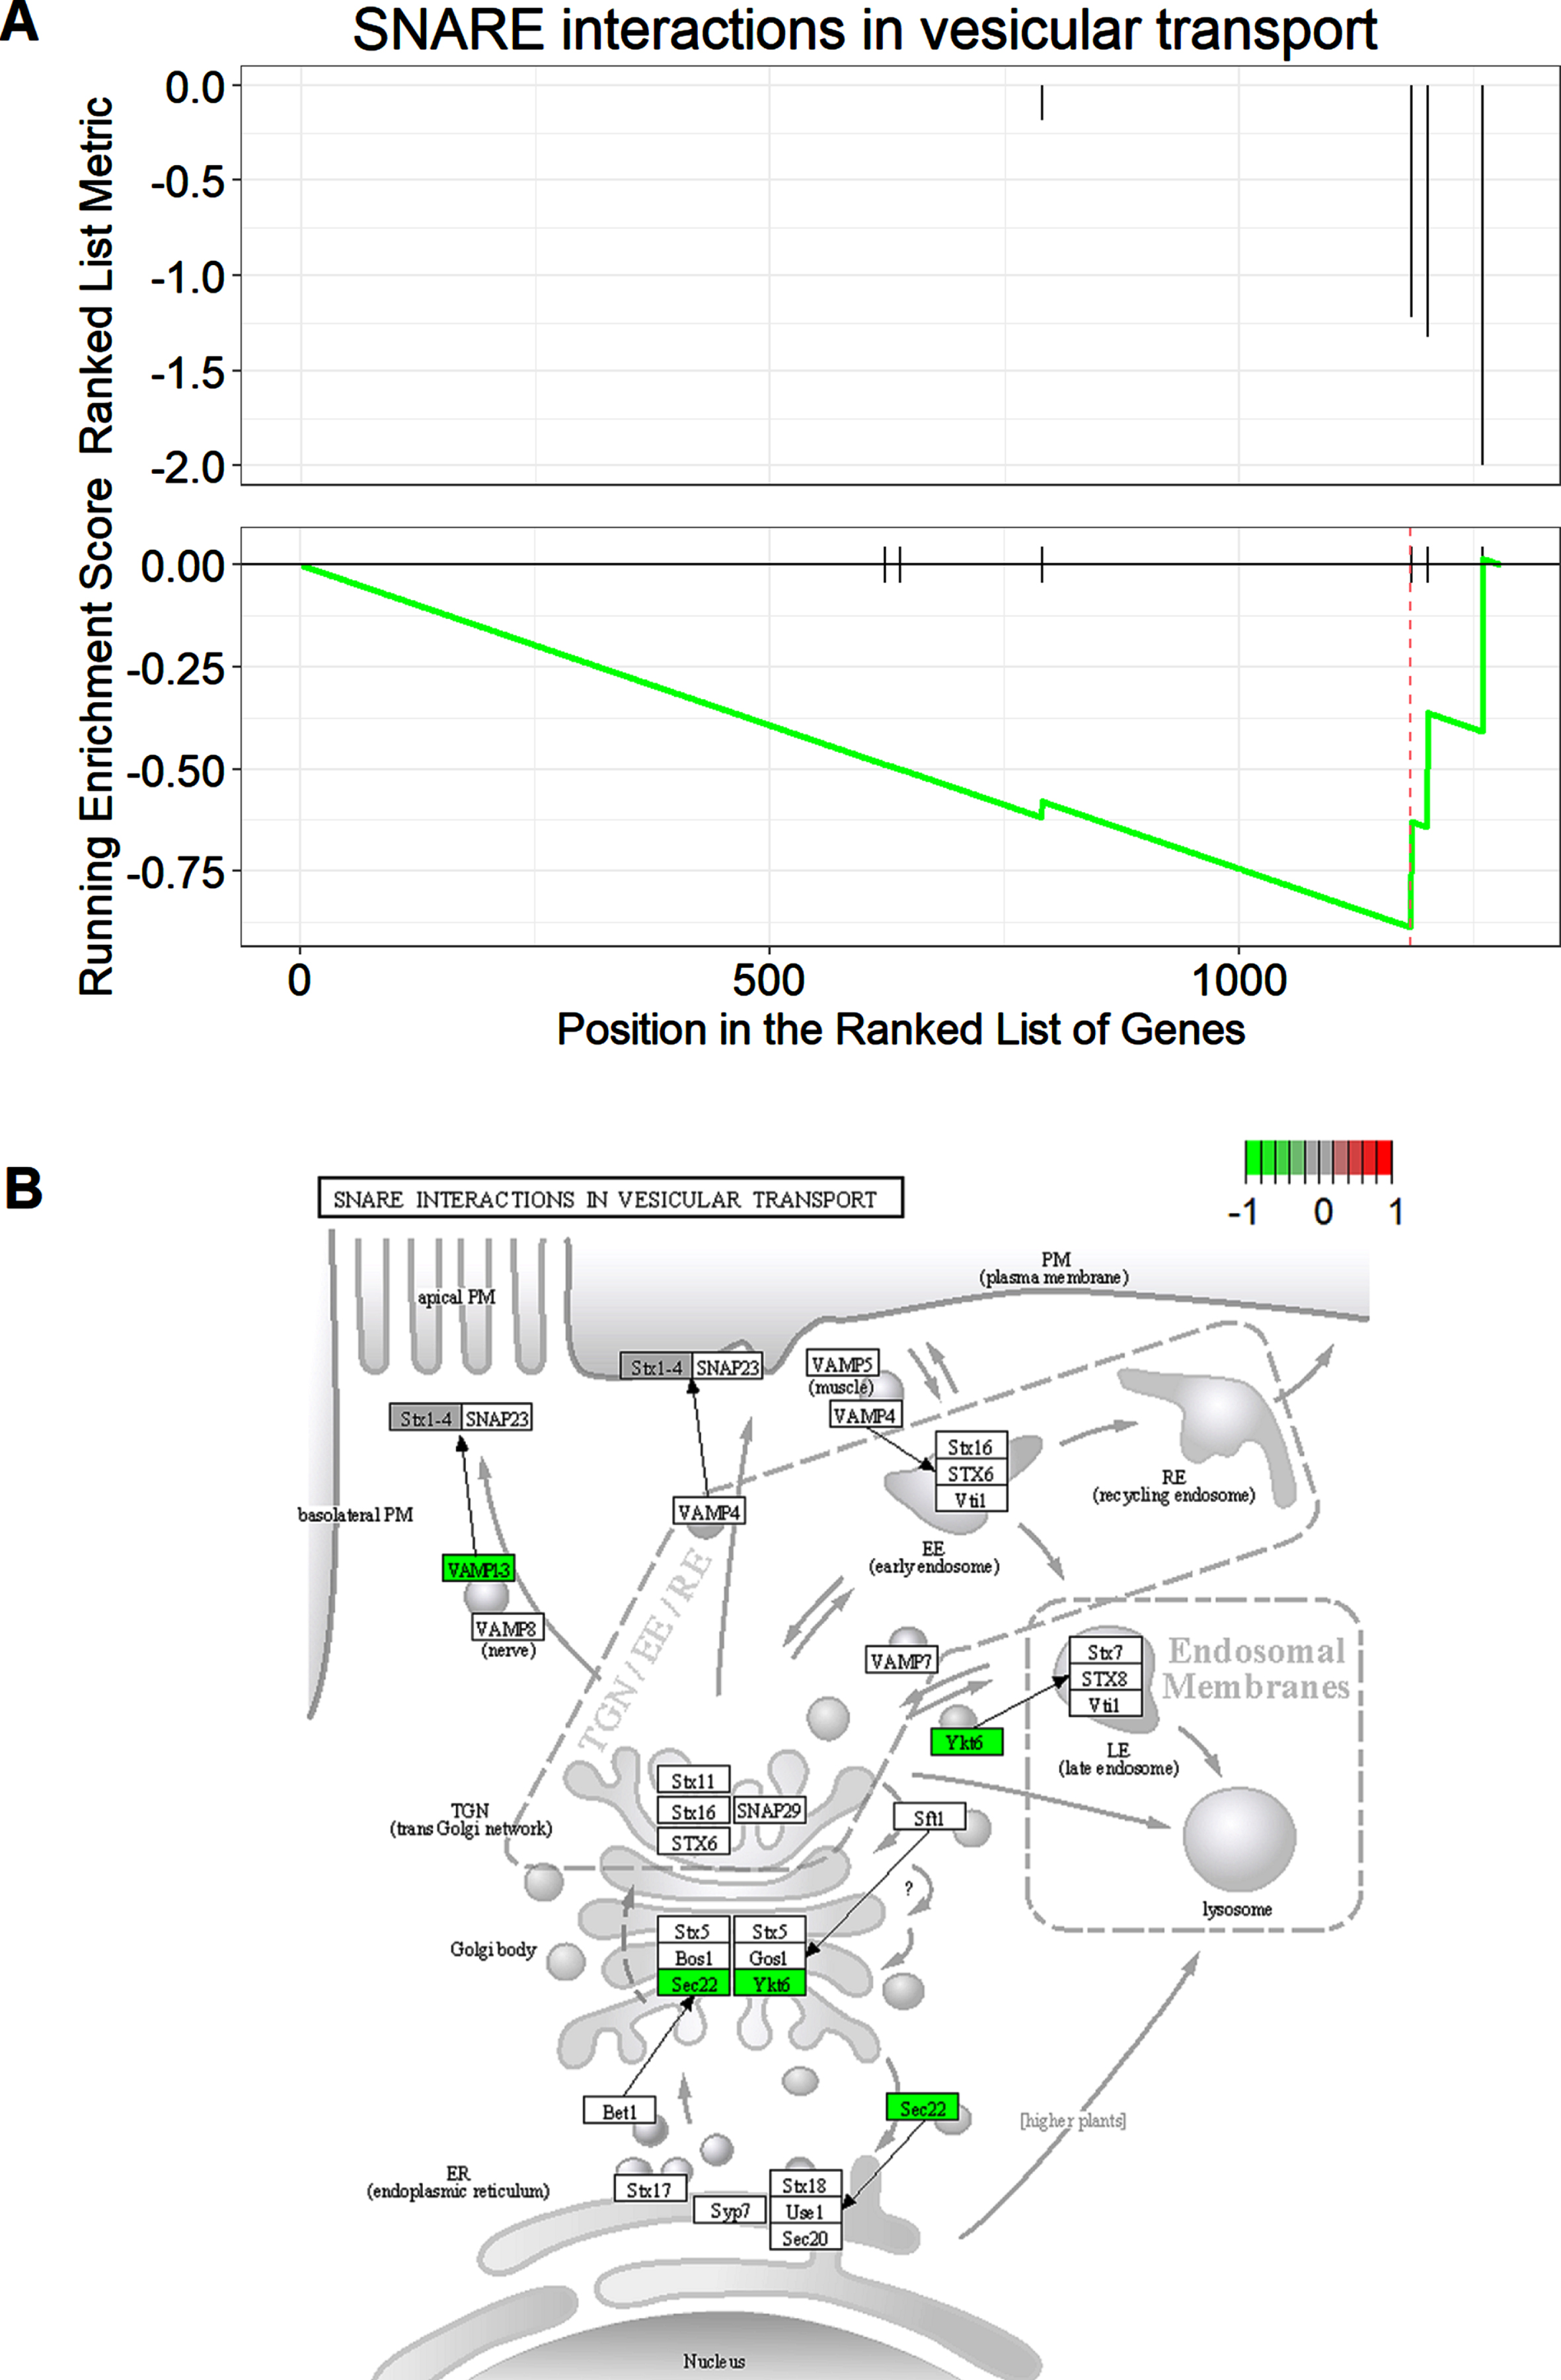
SNARE interactions in vesicular transport is a major dysregulated pathway in de novo proteome in Tg19959 mice. A) GSEA plot of SNARE interaction in vesicular transport. proteins were ranked by log2 of fold changes (Tg19959/WT) in a decreasing order. B) KEGG pathway map of SNARE interactions in vesicular transport. Modules with colors are proteins found in our study. Colors of the modules represent z-score as indicated by the scale bar.
We next conducted the weighted gene co-expression network analysis (WGCNA), another data mining method that allows data exploration in data set with low abundances or small fold changes with high sensitivity [26]. First, we constructed the co-expression network, which consisted of 28 major modules, as shown in Fig. 4A and 4B. After merging these modules with high similarities, totally 23 modules were generated, with the largest module having 260 proteins and the smallest module having 24 proteins, as shown in Fig. 4A. We used different colors to represent these modules. We then conducted GO analysis in these modules to see whether these modules could be assigned to a primary ontology. We presented the result of GO analysis in several of the largest modules. As shown in Fig. 5A, the primary ontology in red module, which was the largest module, was synapse-related, such as synaptic transmission, synaptic plasticity, vesicle docking, etc. This finding was consistent with the GO analysis in differentially expressed proteins in Fig. 2A, reflecting that synaptic abnormalities were the most significant alterations in de novo proteome of AD. The primary ontology in magenta module was dendritic spine-related, as shown in Fig. 5B. Metabolism-related process was the primary ontology in the green module, as shown in Fig. 5C. We further assessed the correlations between these modules and genotypes to determine which modules were associated with genotypes, as shown in Fig. 6A. We chose the dark green module to do further analysis since it had the highest correlation coefficient with genotypes and the p value was close to be significant (p = 0.06). We conducted GO analysis first in this module and found that the primary ontology was aspartate transport, as shown in Fig. 5B. However, GSEA analysis did not find any signaling pathway enriched in this module. Given the close metabolic relationship between aspartate and glutamate, association of this module with genotype also suggested synaptic alteration in AD was a primary characteristic.

WGCNA analysis of the de novo proteome. A) Cluster dendrogram of the de novo proteome. Color boxes below the dendrogram represent clustered modules. Color boxes in the bottom row represent modules after merging. B) Co-expression network of the de novo proteome. On the top and left are the dendrograms and modules after merging.
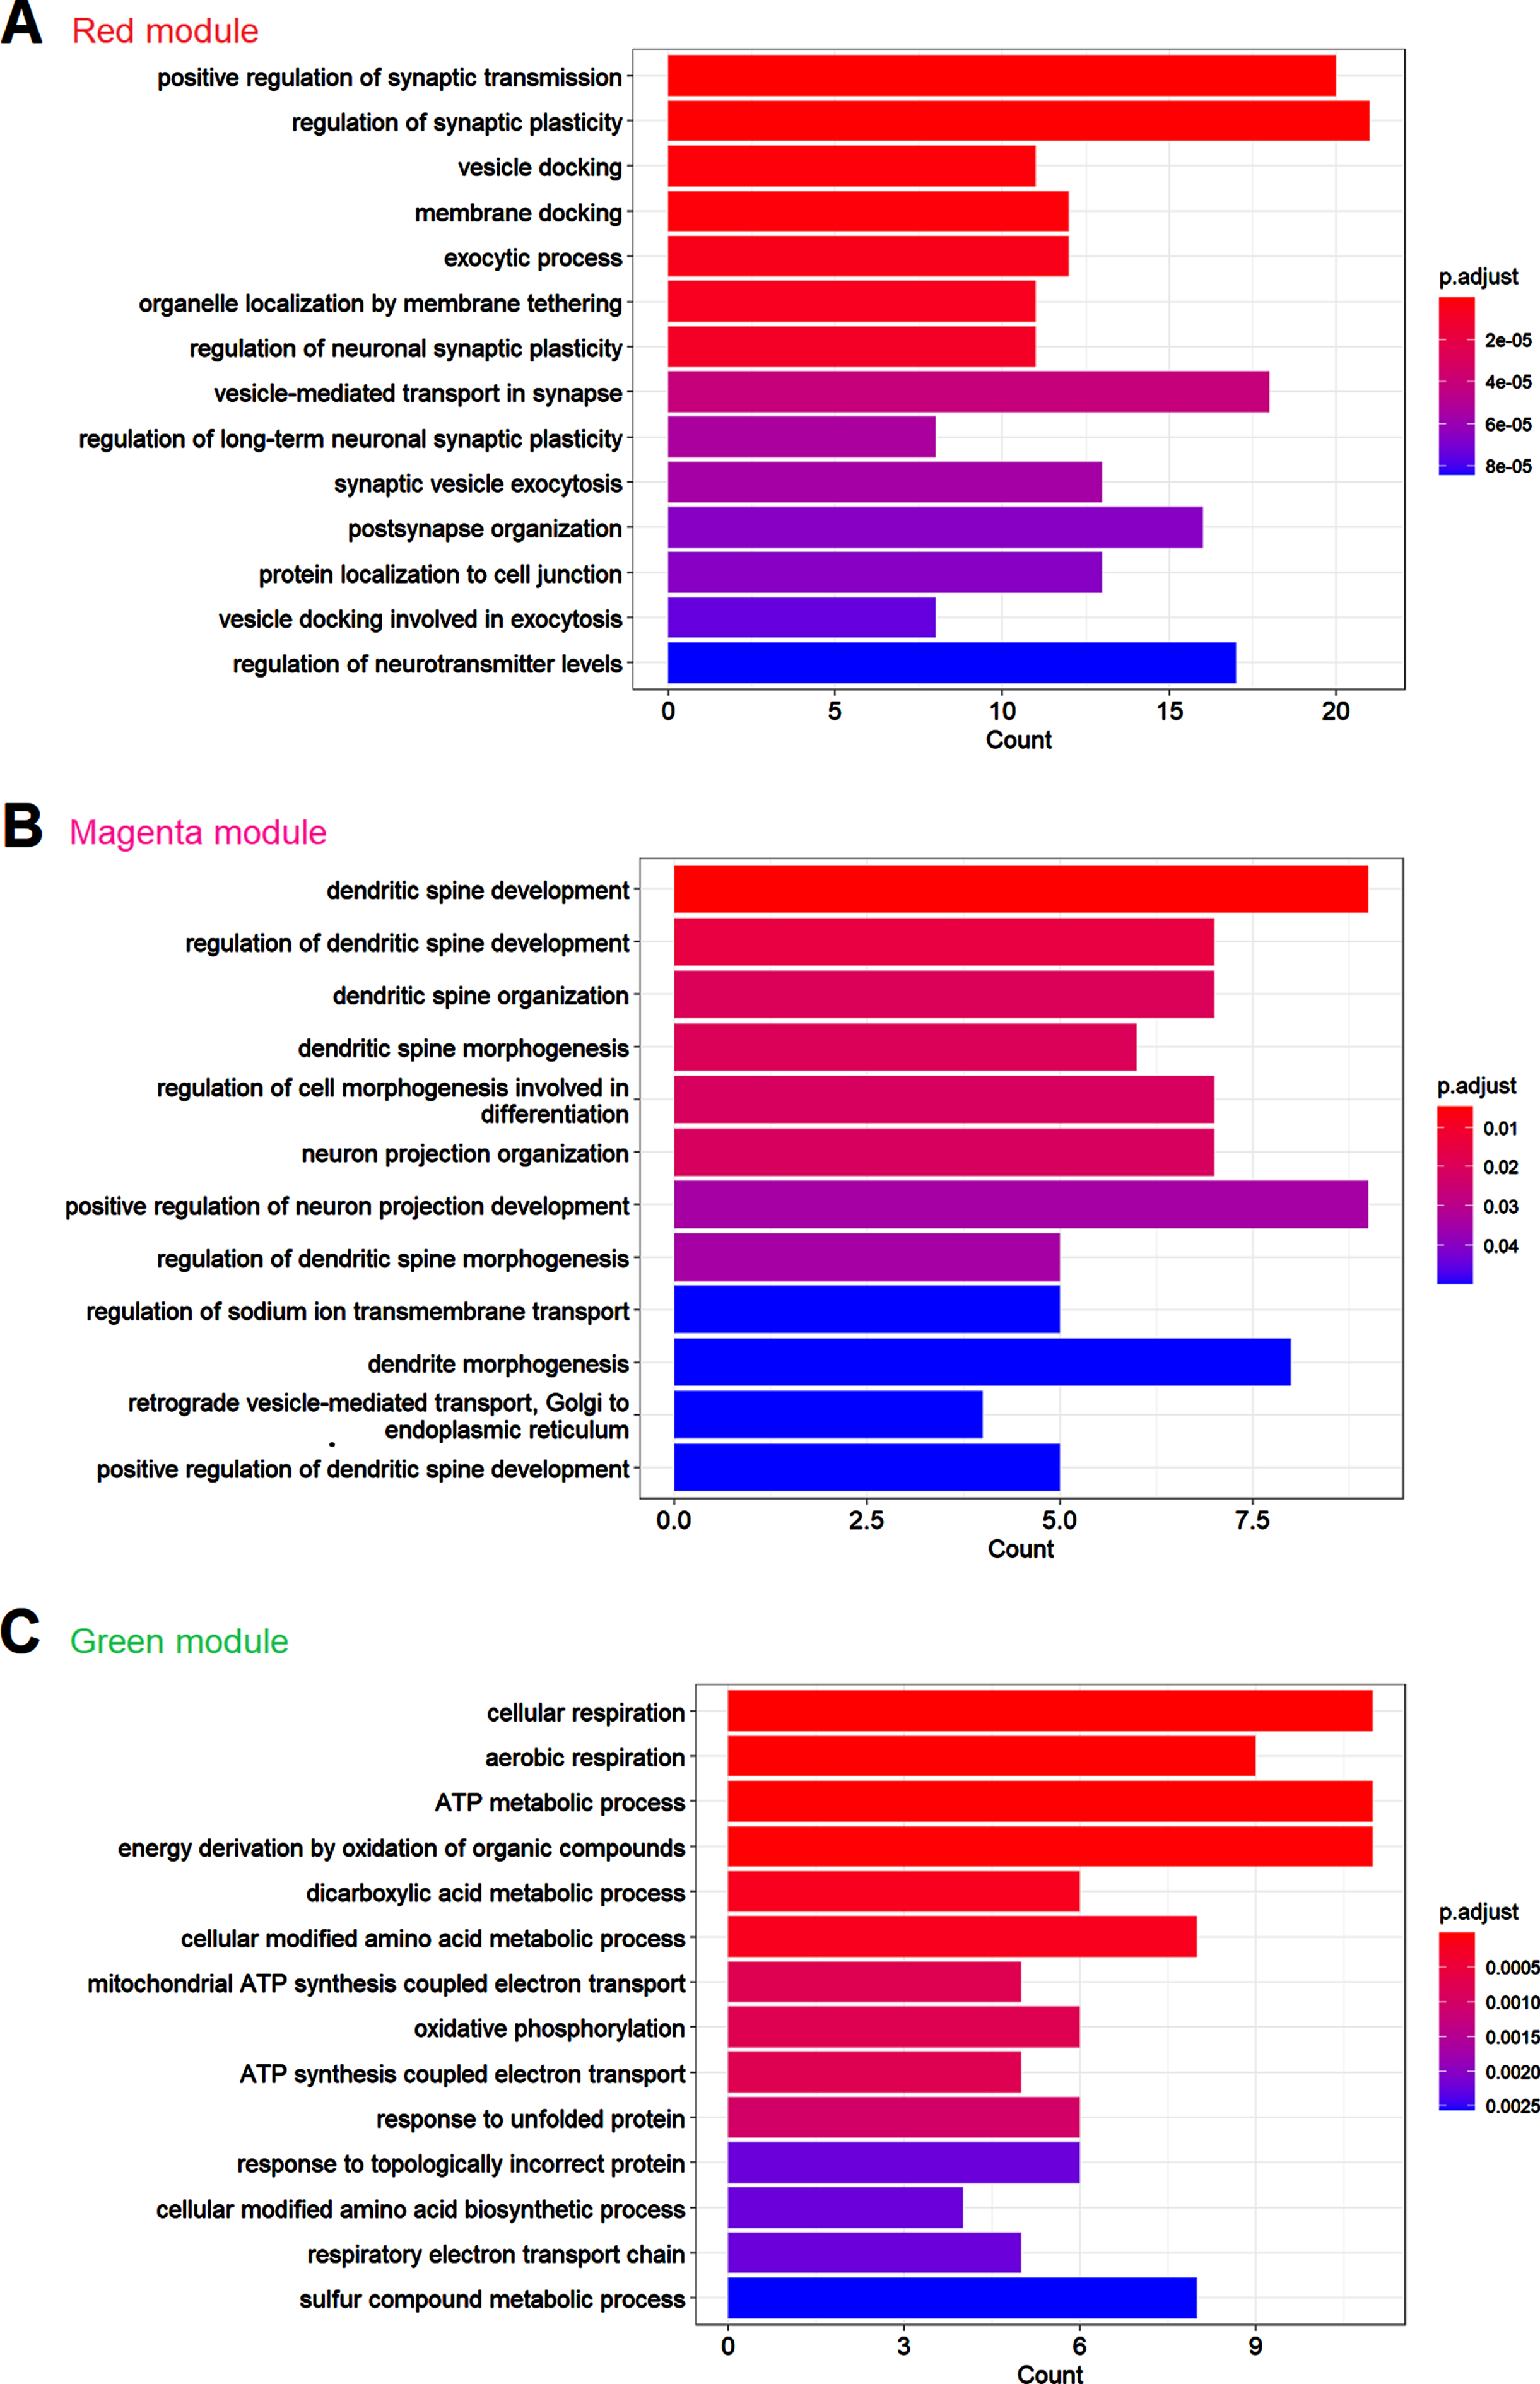
GO analysis of modules from the WGCNA analysis. A) Graph plot of the GO analysis of Red module. B) Graph plot of the GO analysis of magenta module. C) Bar plot of the GO analysis of green module. Colors of the bars represent adjusted p values of that terms as indicated by the scale bar next to the bar plot.
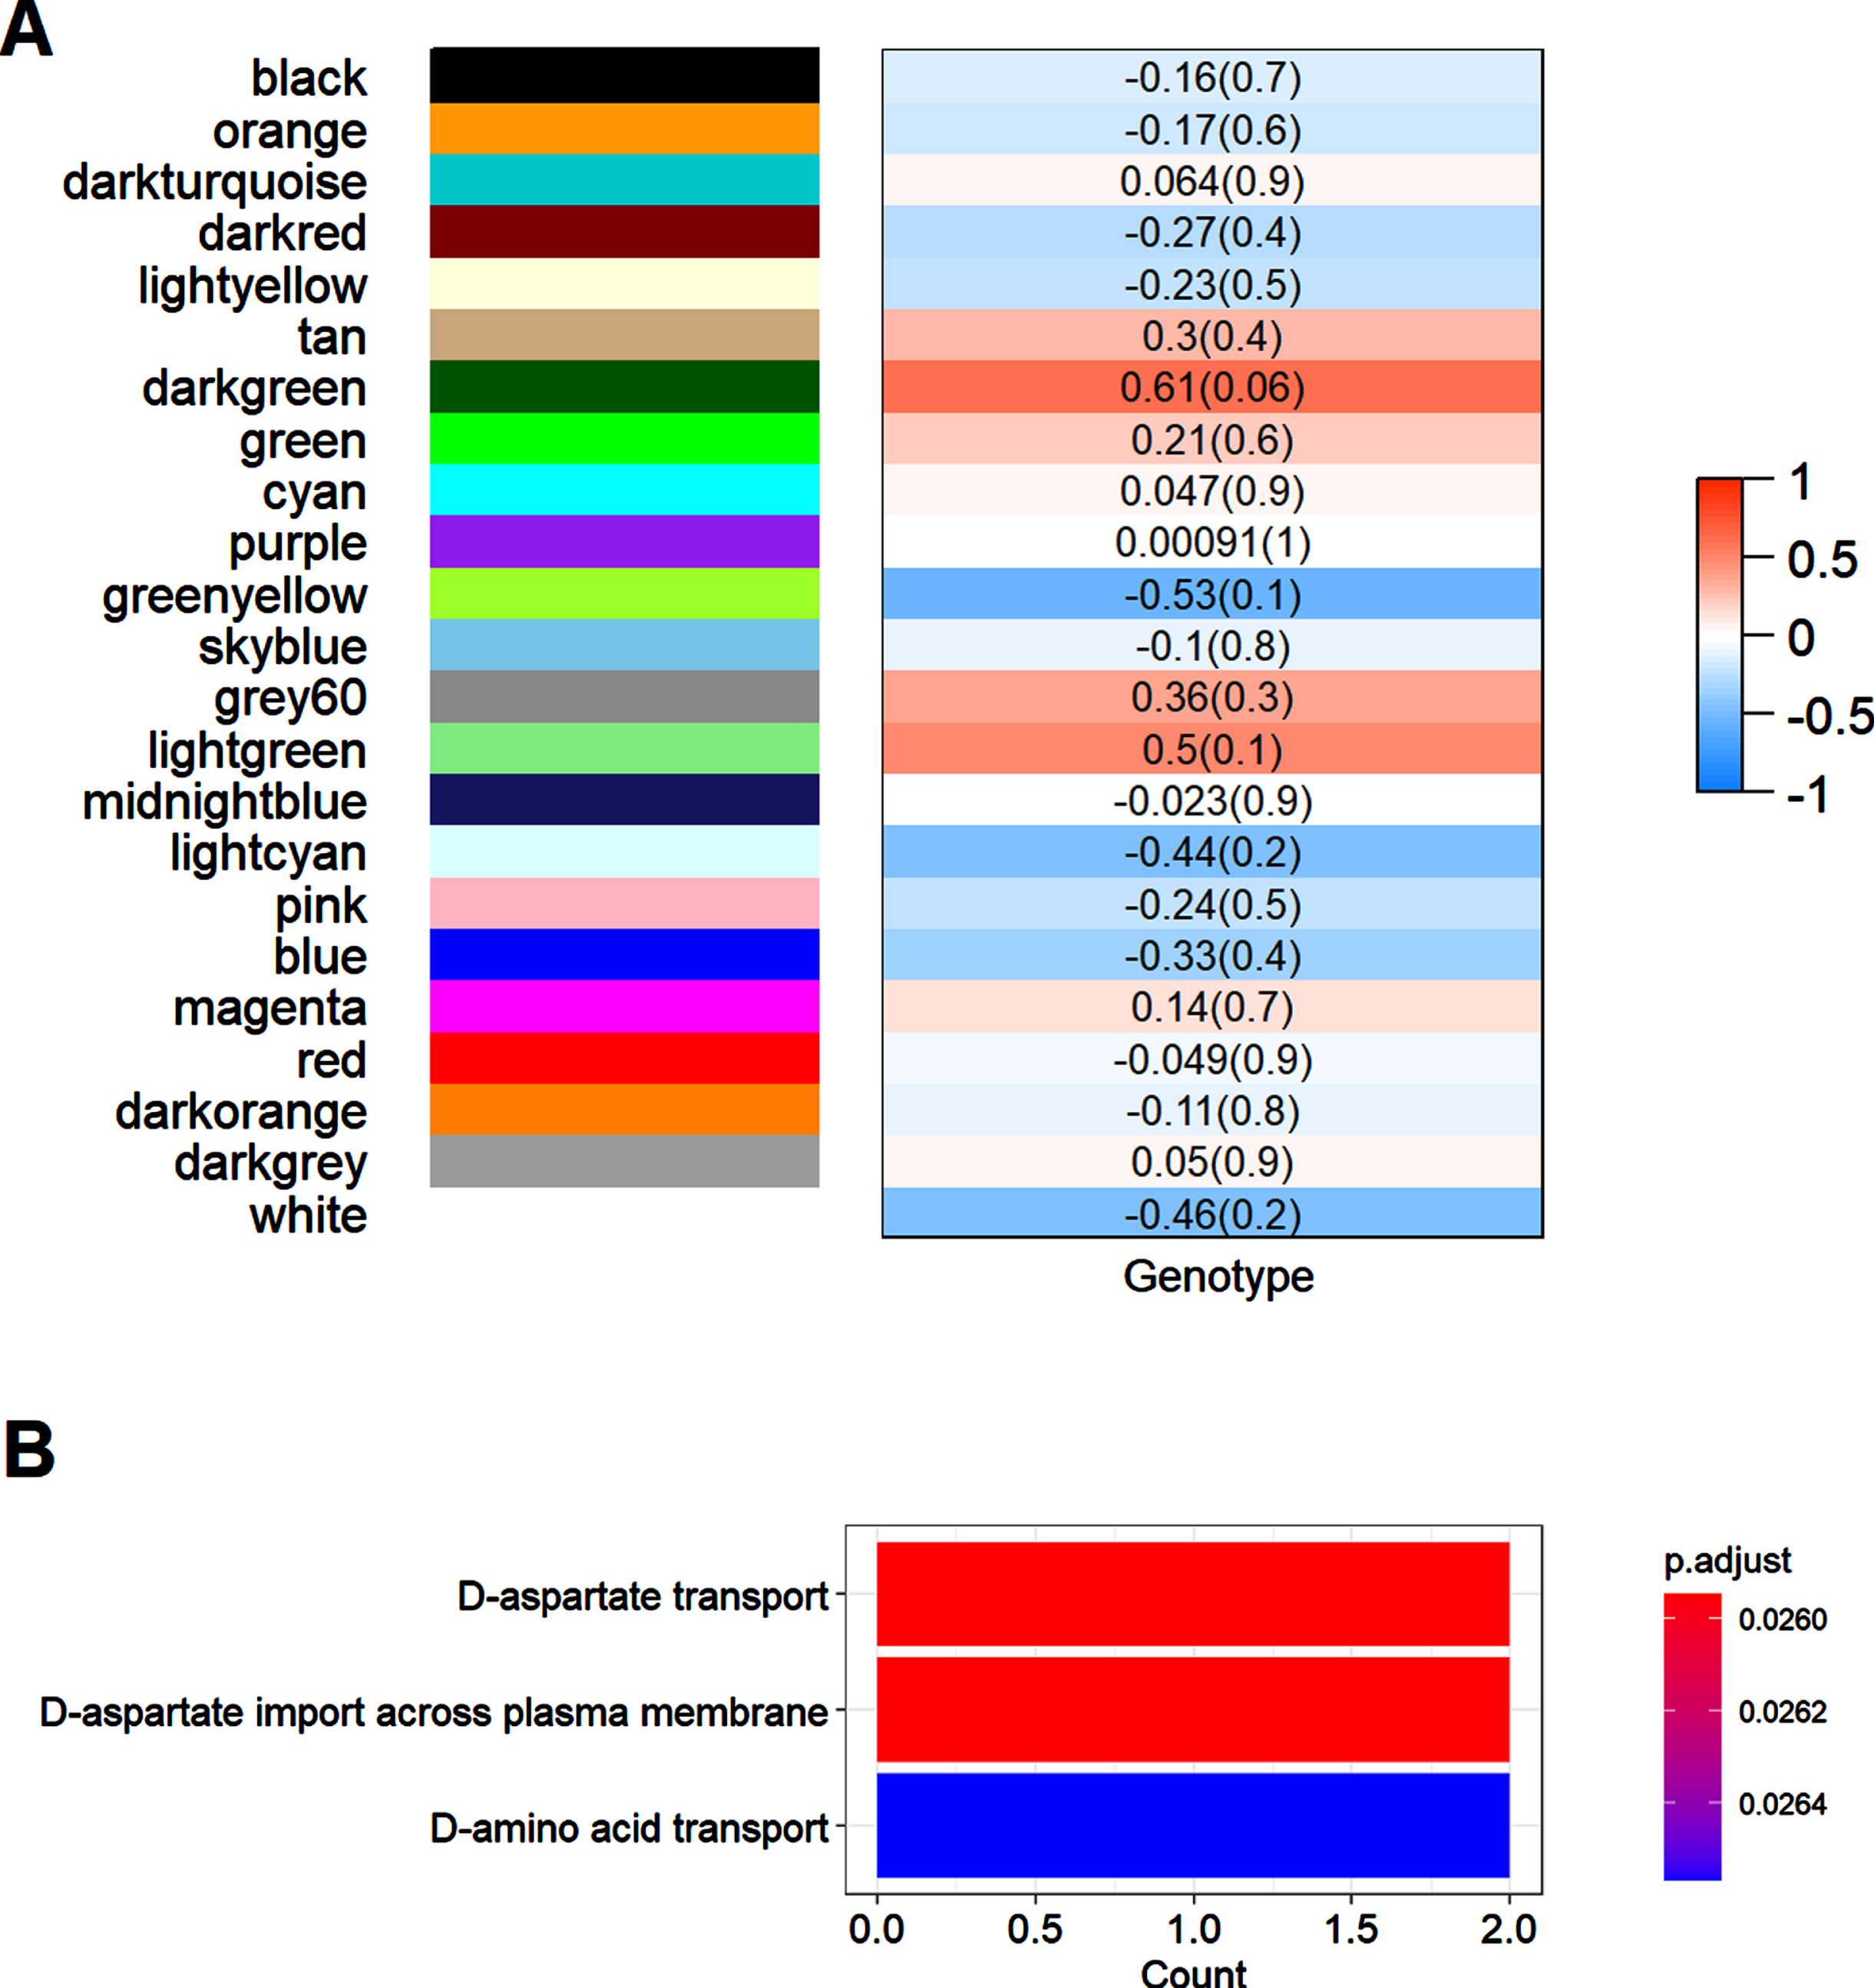
Analysis of associations between modules and genotypes. A) Associations between different modules and genotypes. The correlation coefficients of each modules and the corresponding p values (parentheses) are shown. B) GO analysis of the dark green module. Colors of the bars represent adjusted p values of that terms as indicated by the scale bar next to the bar plot.
DISCUSSION
Impaired protein synthesis capacity is implicated in neuronal disorders characterized by cognitive deficits [3, 27–29]. Until recently, very few published studies focus on de novo proteome dysregulation in AD [20, 31]. Here using the novel BONSPEC method, we were able to label, separate, identify, and quantify newly synthesized proteins in hippocampus of an established AD mouse model (and the WT control). We then applied bioinformatics tools including two data mining methods to analyze the BONSPEC data and found that synaptic abnormalities were the primary alterations of de novo proteome in AD. The results are in line with previous proteomic and transcriptomic studies [20, 32], supporting the idea that synaptic dysfunction plays a critical role in AD pathogenesis.
We also noticed dysregulation of several other signaling pathways in AD. In GSEA analysis, we found that de novo protein synthesis involved in fat digestion and absorption, hedgehog signaling pathway and TCA cycle were dysregulated in AD mice. In GO analysis of the green module, we found the primary ontology of the proteins was related the metabolism process. Such findings are consistent with previous studies indicating a role of metabolic signaling dysregulation in AD development [31, 33]. For example, we recently reported that impairment of the AMP-activated protein kinase (AMPK) signaling, which functions as a key regulator for maintenance of cellular energy homeostasis, may contribute to AD-associated cognitive deficits and synaptic failure [34]. GO analysis of the dark green module revealed metabolic dysregulation of aspartate. Aspartate could be converted to glutamate through aspartate aminotransferase and vice versa. Metabolism of aspartate in neurons and astrocytes was a major source of glutamate, which is the most abundant excitatory neurotransmitter critical for regulation of synaptic and cognitive function [35].
There are limitations in this study. First, the number and abundance of proteins detected with the BONSPEC method were much lower compared to the traditional proteomic analysis. While this could be related to “de novo proteome” (e.g., much smaller pool of proteins), it may affect the power of the bioinformatics analysis. We would optimize the method in future studies. For example, we would try to increase the incubation time of slices with L-AHA or increase the concentration of L-AHA, which could allow more newly synthesized proteins to be labeled. Second, the sample size in this study was relatively small, which may lead to insufficient power to detect certain altered signaling pathways or associations in AD. For example, in the WGCNA analysis, only the dark green module was close to be significantly associated with the genotype.
The current study focused on the dysregulation of basal de novo protein synthesis in AD. It would be intriguing for future studies to investigate de novo protein synthesis under stimulating conditions (e.g., synaptic activities) with similar approaches. And a comparison on regulation of the de novo proteome between basal and stimulating conditions in AD should provide further insights into the mechanisms underlying the AD pathogenesis.
In summary, we have developed the BONSPEC method to detect de novo proteome in the hippocampi of WT and Tg19959 AD model mice and identified synaptic abnormalities as the major characteristic of AD-related de novo proteome. Our findings could help pave the way for future studies to identify novel therapeutic targets and/or diagnostic biomarkers for AD and related dementias.
Footnotes
ACKNOWLEDGMENTS
We thank Dr. George Carlson of McLaughlin Research Institute for providing breeders for Tg19959 AD model mice. We thank the support of the Wake Forest Baptist Comprehensive Cancer Center Proteomics and Metabolomics Shared Resource, supported by the National Cancer Institute’s Cancer Center Support Grant P30CA012197.
FUNDING
This work was supported by National Institutes of Health grants R01 AG055581, R01 AG056622 (T.M.), the Alzheimer’s Association grant NIRG-15-362799 (T.M.), the BrightFocus Foundation grant A2017457S (T.M.).
CONFLICT OF INTEREST
The authors have no conflict of interest to report.
DATA AVAILABILITY
All data are available upon request. Please contact the corresponding author to request.