
Abstract
In terms of the generation of the over-voltage, caused by the coupling between overhead transmission lines and lightning electromagnetic fields, an experimental model was built to simulate the coupling, based on the theoretical analyses. It is concluded that when the overhead transmission lines couple with the lightning electromagnetic fields, there is less low frequency component but more high frequency one in its spectrum than the source, thus the coupled waveform is steeper, and the time is shorter than the excitation waveform, about 2
Introduction
The lightning electromagnetic pulse has a wide frequency range, high energy density, strong interference and damage. The hazard of lightning to transmission mainly concentrates on the power supply system and transmission system [1, 2, 3].
The coupling of the circuit includes the magnetic induction coupling and the electric induction. In fact, it is difficult to distinguish the intertwined radiation disturbance and conduction disturbance [4, 5]. It would cause transient high voltage and current, which lead to the equipment malfunction, lower precision, even the equipment damage [6]. Therefore, it is necessary to research the process and characteristics of coupling between the transmission cables and the lightning electromagnetic fields and has references to the arrangement of power systems, the electromagnetic compatibility engineering for information systems and the subsequent lightning protection.
Since the mid-twentieth century, amount of analyses have been carried out on the interference coupling of cables in western developed countries [7]. There are three international acknowledged models to describe the coupling between the electromagnetic fields and the transmission line, derived from the Maxwell equation respectively: Taylor model [8], Agrawal model [9] and Rachidi model [10]. If the application is proper, diverse methods on transmission line coupling could acquire equal response results [11]. It is worth to mention that the transmission line theory is not a complete solution but an approximate when the transmission line excited by the incident electromagnetic field [12].
Baba et al. calculated the induced over-voltage on the internal transmission lines of the tall buildings stricken by lightning, using the FDTD method [13].
Xie et al. compared the results of the elevated ground cable coupling of the transient electromagnetic fields which were calculated by Agrawal and Taylor model respectively, and were equal [14].
Wen et al. used numerical calculation to study the over-voltage of the lightning electromagnetic fields in the overhead power distribution lines, obtained that the distribution and the related characteristics of the distribution line coupling over-voltage [15]. Ren et al. adopted FDTD to calculate the near field distribution of the lightning current return stroke, and the transient over-voltage of the overhead power transmission line terminal was calculated with the transmission line equation [16].
Most of the above researchers calculated the pattern in the coupling of transmission lines through simulation models, however, it lacks of experimental results. On the physical conditions, there are differences between the cable coupling on lightning electromagnetic fields and the theoretical model. Especially in the near field, the cable coupling would not be the standard plane wave excitation source for the most of time. In this paper, the coupled characteristics of the lightning electromagnetic fields on overhead cable by scale model discussed, we obtain that when the overhead transmission lines are coupling with lightning electromagnetic fields, the coupled wave head is steeper than the excitation waveform; The coupled voltage linear increases with the augment of the electric resistance while it is below 510
The theoretical analyses on the overhead transmission line
The external incident field
In the Eq. (1), U
Theoretical model of transmission line.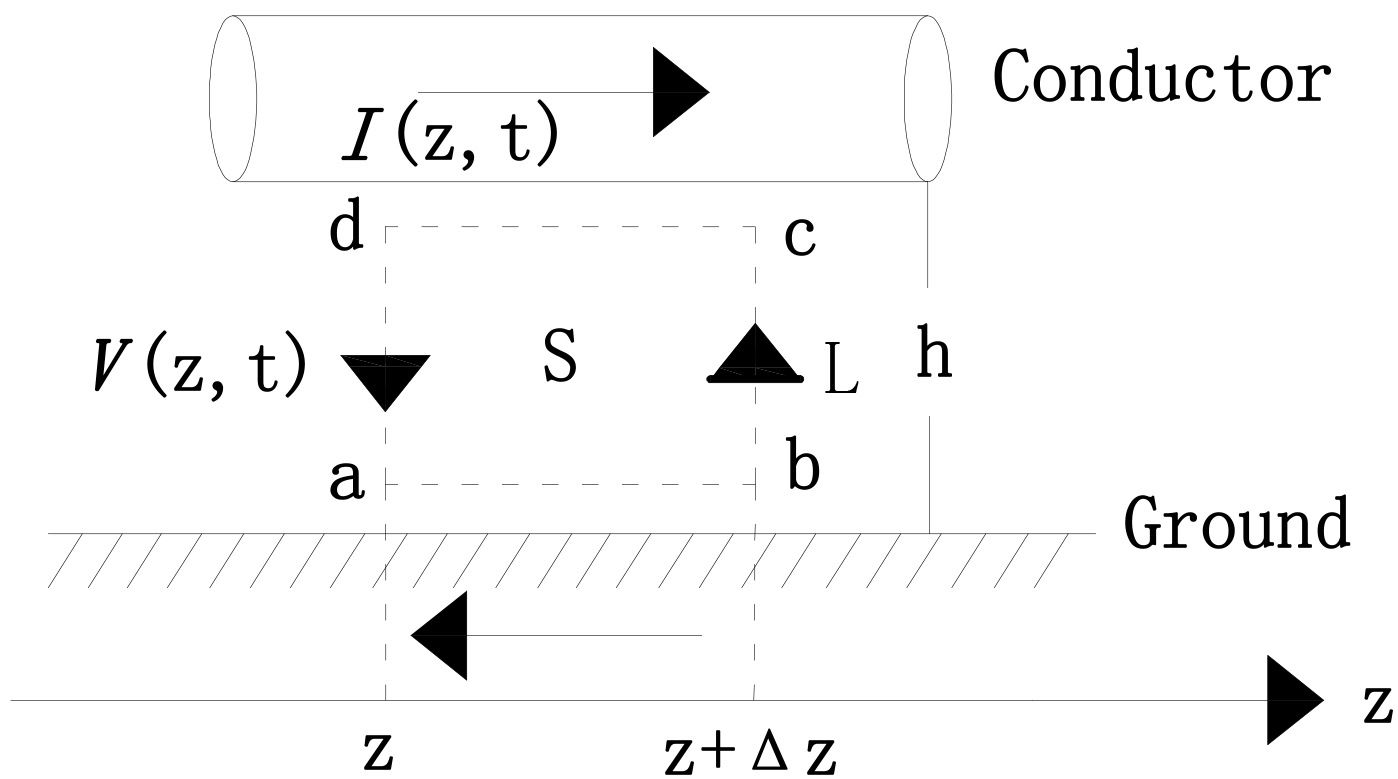
The total induced electric field can be decomposed into the sum of the incident field and the scattered field:
Load response model of ideal overhead single transmission on the ground can be seen as a kind of load response model extending of two-wire transmission lines. Its characteristic impedance is calculated as half of the two-wire transmission lines while the reflection coefficient is unchanged, still
According to the literature [17] can be obtained the load voltage and current at the terminal overhead transmission lines, which can be written as compact matrix forms, namely, BLT equations (Baum-Liu-Tesche).
Local current and local voltage are represented as the integral form of the transmission lines. For example, the following calculation equation of BLT can be obtained by integrating
vector sources as follows [19]:
If using the reflected voltage (Agrawal) formula, the full load current and voltage on the load can be given, but the excitation sources are different, which should be as follows:
Either Eq. (5) or Eq. (6) of the BLT source expressions, can be used to calculate the terminal response. As long as you use the correct components, you can get the same results.
As shown in Fig. 2a below, considering the case of plane wave excitation. The Agrawal transmission telegraph equations of a single overhead transmission line on the ground are derived from the double transmission lines equations. To make it easier to analyze ground reflected field, the incident field is still divided in to a vertically polarized component and a horizontally polarized components. The incident electromagnetic wave in Fig. 2b, the angle
The incident plane wave excitation system.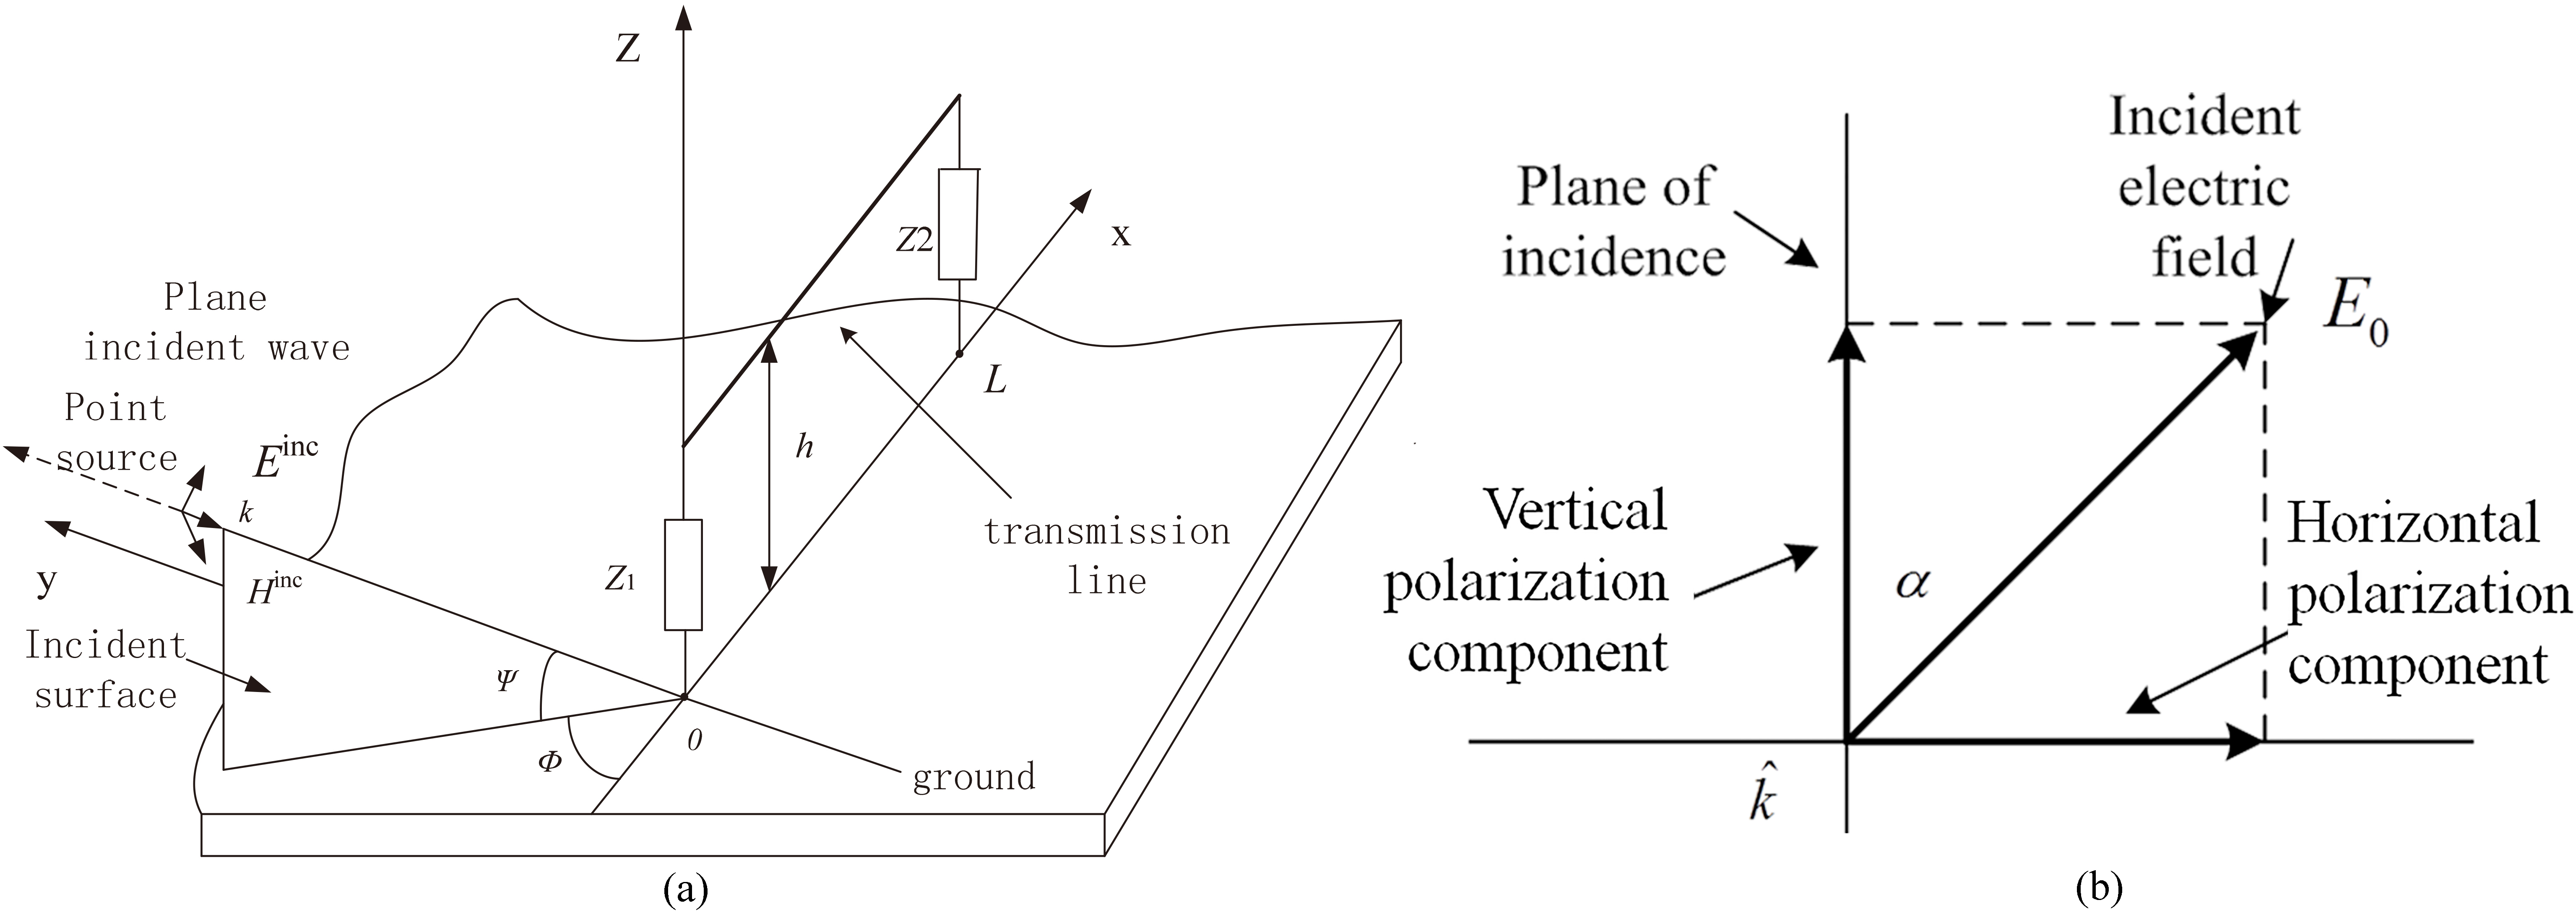
The distribution source
As requested, the height of the overhead wire is
The entire vertical excitation field at
The lumped voltage source at the end of the wire, that is
In the low frequencies, the expression is:
As the vertical field from in Eq. (9), the lumped voltage source at
The source integral can be calculated by
The approximate solution of overhead lines coupled the plane wave in the frequency domain can be obtained by making Eq. (13) into Eq. (4). A wide band spectrum can be transformed into time domain by Fourier transform. Then, the transient load response current and voltage of overhead transmission lines in the domain can be gained.
Establishment of experimental model
As shown in Fig. 3, a simulation model for the ratio of the lightning current channel is established [22]. At the outdoor, we set up a insulating rod with length of 30 m and diameter of 2 cm (d
The experimental model.
According to the requirements of the International Electrical Commission, the waveform of standard lightning impulse are shown in Fig. 4. In the experiment, the 8/20
Analytical lightning current waveform.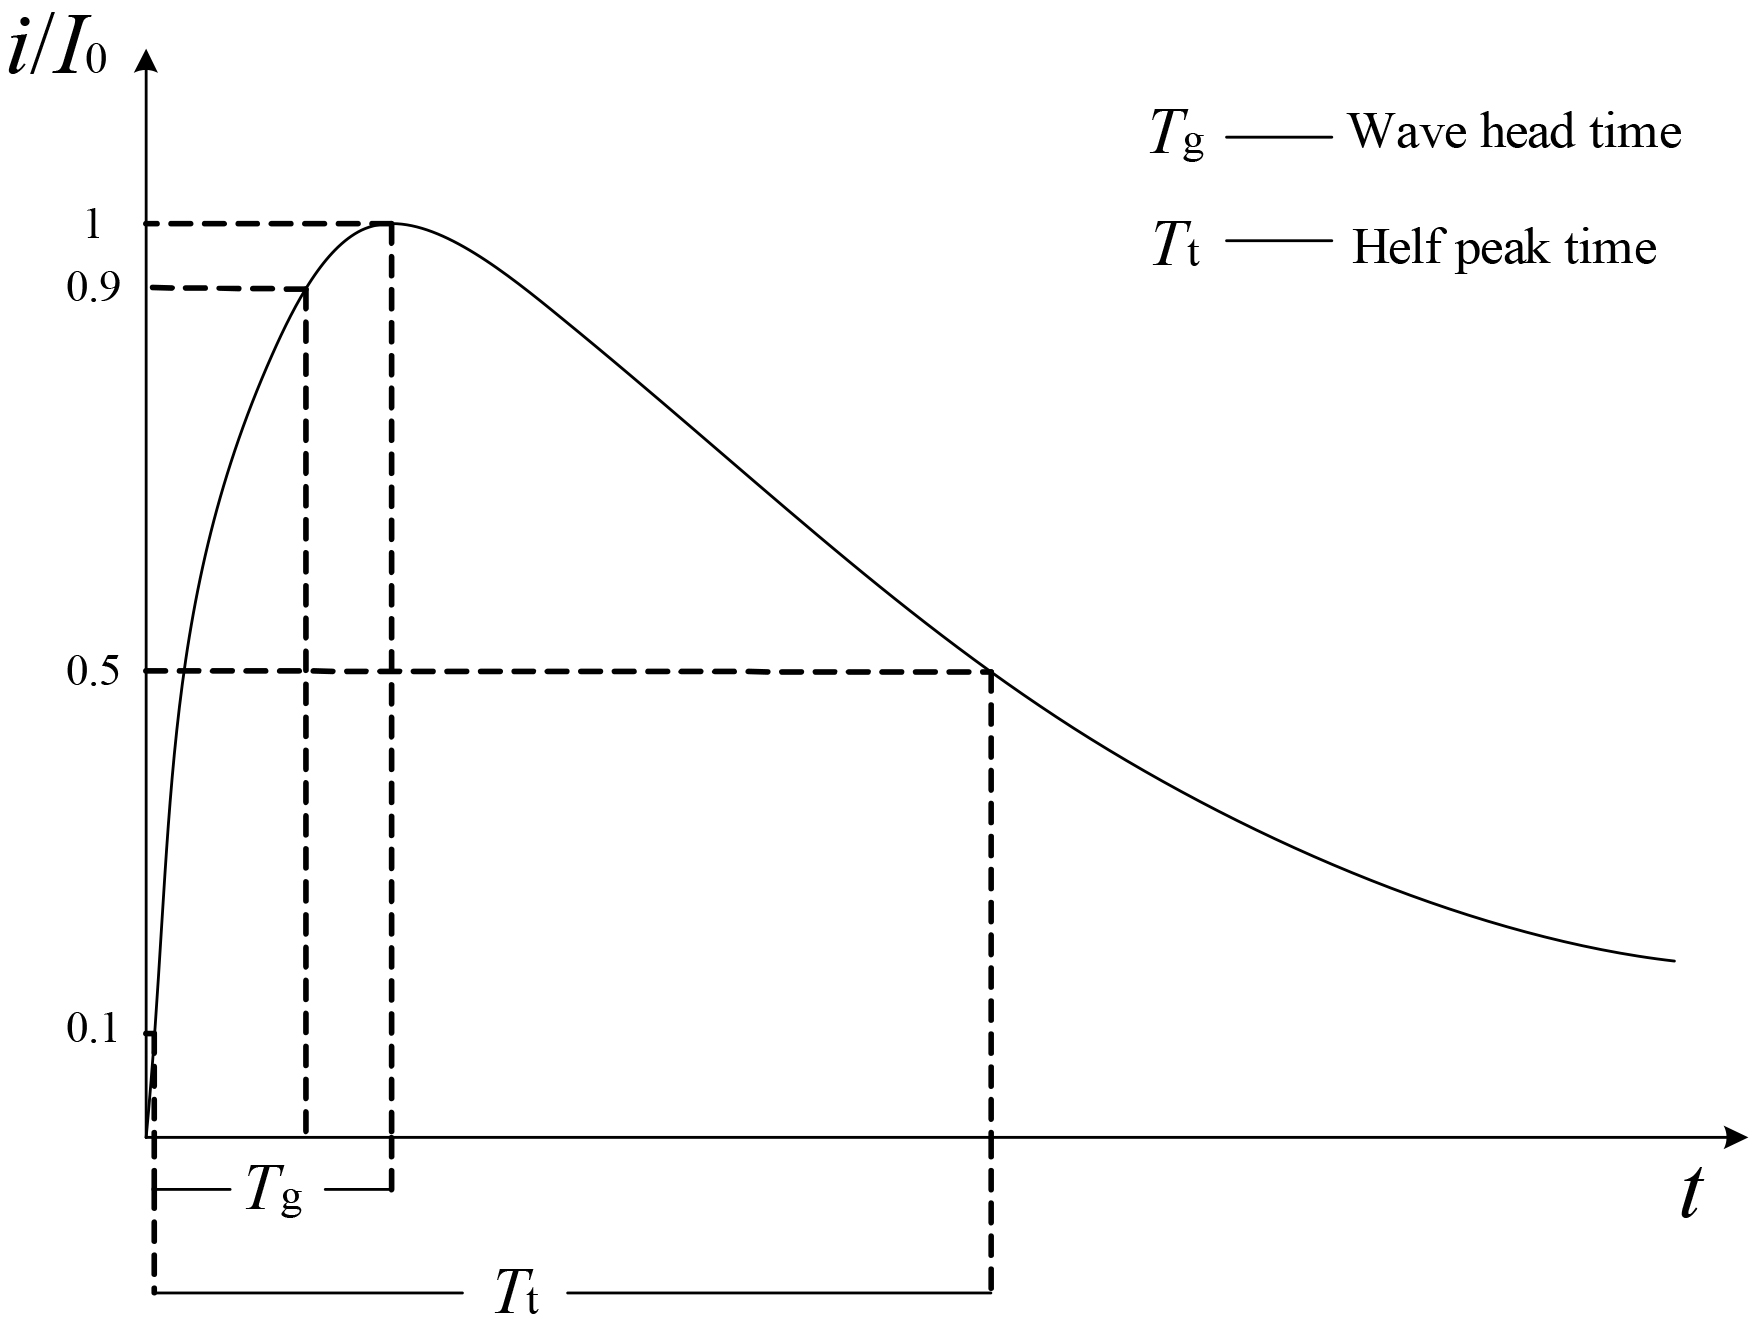
Measured simulated lightning current waveform.
8/20
The overhead line used a copper core insulated wire with a diameter of 9.0 mm. Core cross-sectional area of 47.7 mm
The day for testing was sunny, humidity 48%. Before and after the experiment, we have used 61557 electrical test equipment to test the soil resistivity on the test site (below the overhead line). The soil resistivity are 33
In the test, diverse conditions could be changed to analyze the characteristics of the lightning electromagnetic wave, such as the height, the length and the value of analog load.
Typical waveform analyses
According to the experimental data, a graph was plotted on time domain voltage waveform of overhead transmission line coupling lightning electromagnetic fields. As presented in Fig. 3a, the length of the line was 30 m, height being 3 m, the analog load R
Typical waveform.
As demonstrated as Fig. 6a, there was a high frequency oscillation, lasting about 3
Waveform comparison in time domain.
As shown in the Fig. 7, the coupling voltage wave (shown in Fig. 6a) and the the lightning channel excitation source voltage waves simulated are compared in time domain. By comparison, it can be known that the time of the voltage waveform of the overhead transmission line is much shorter than that of the excitation source. At the wave head of the coupling wave has a more obvious high-order mode. And at the rising edge and the peak of the wave, there are obvious oscillations, which is caused by the impedance mismatch of the overhead cable and the impedance mutation.
Waveform comparison in frequency domain.
The amplitude frequency curves were obtained by the Fourier transform of the current waveform which were converted by the coupled voltage waveform of Fig. 3a. Similarly, making Fourier transform to the simulation of lightning channel current collected at the impact platform. Two results were normalized and exhibited as the Fig. 4. It is presented that the simulated lightning current spectrum has the highest point in the extremely low frequency, 0–10 kHz, while a rapid decline, down to 100 kHz. Then the trend slows down, and gradually tends to 0. However, the coupled spectrum curve shows a rapid rise in the 0–5 kHz part. Normalized current A
The other test conditions were invariant. The amplitude of the simulated lightning impulse current aggrandized linearly from 5 kV to 40 kV, and the step size is 5 kV.
Coupled waveform with 2.5 m high and 510 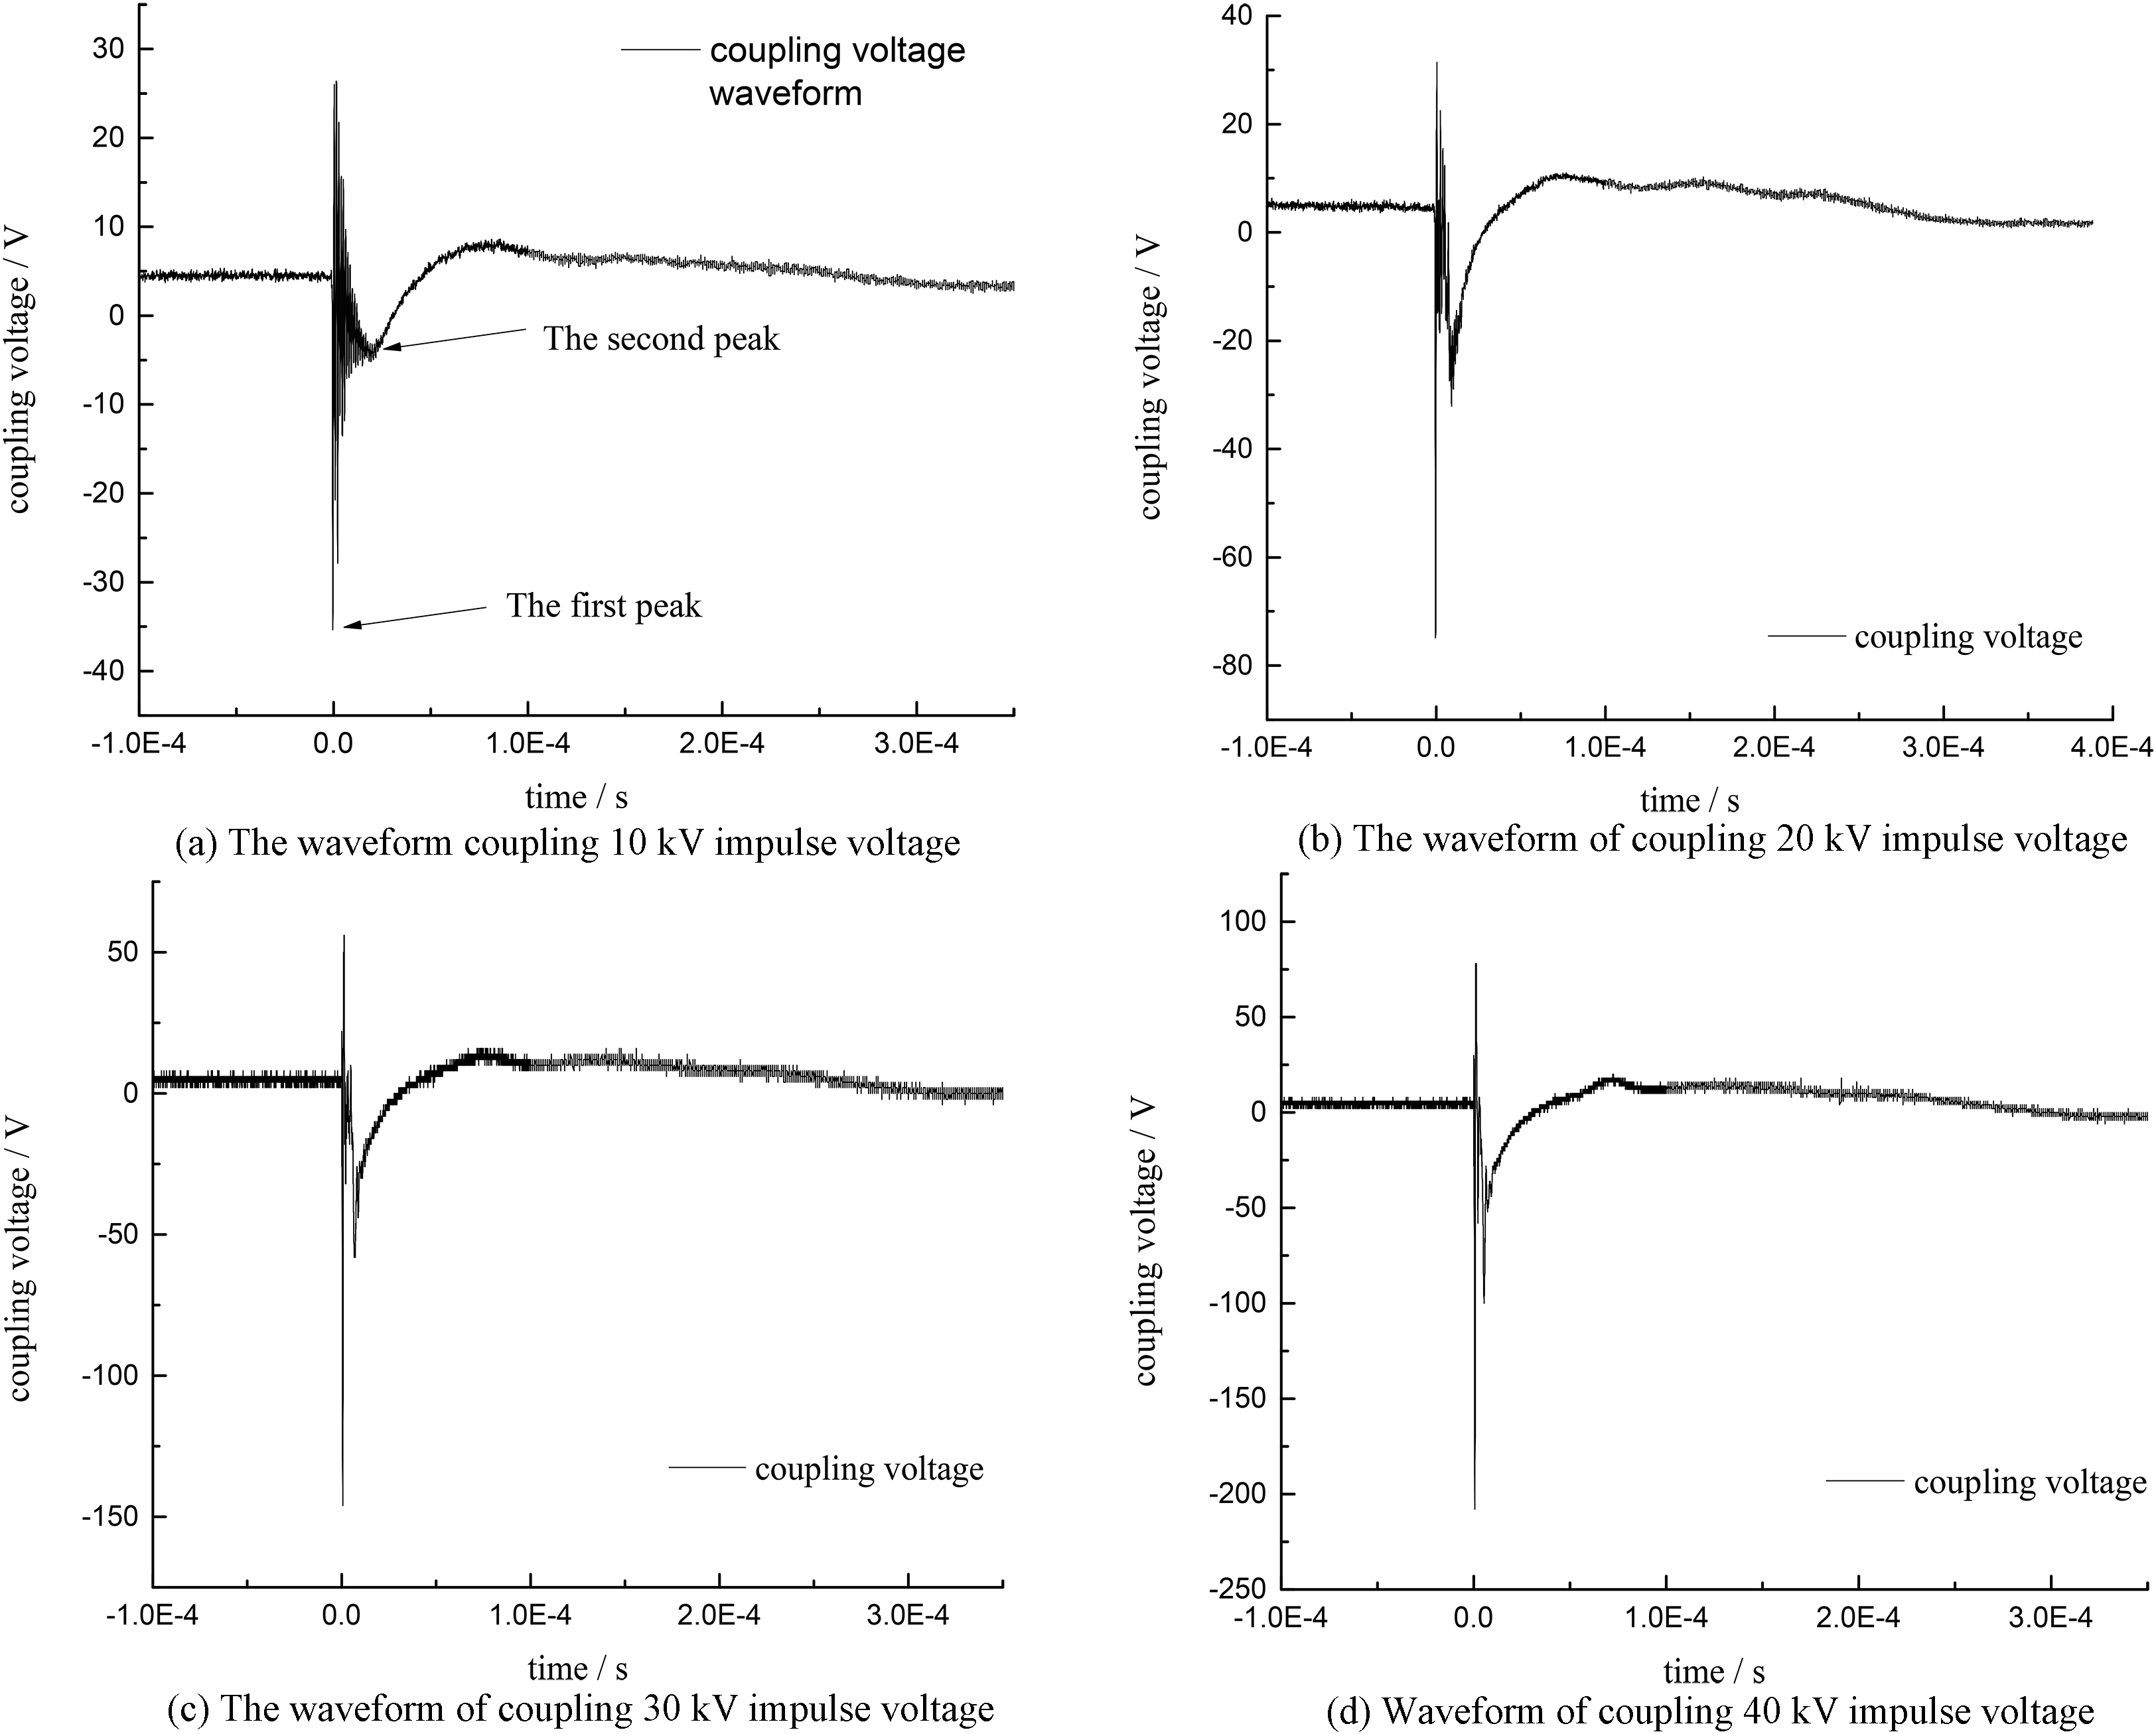
As demonstrated in Fig. 9, the four figures are the overhead wires coupling the lightning electromagnetic voltage waveform whose length were 30 m, both ends of the load impedance being 510
The coupled voltage change trend with difference impulse voltages.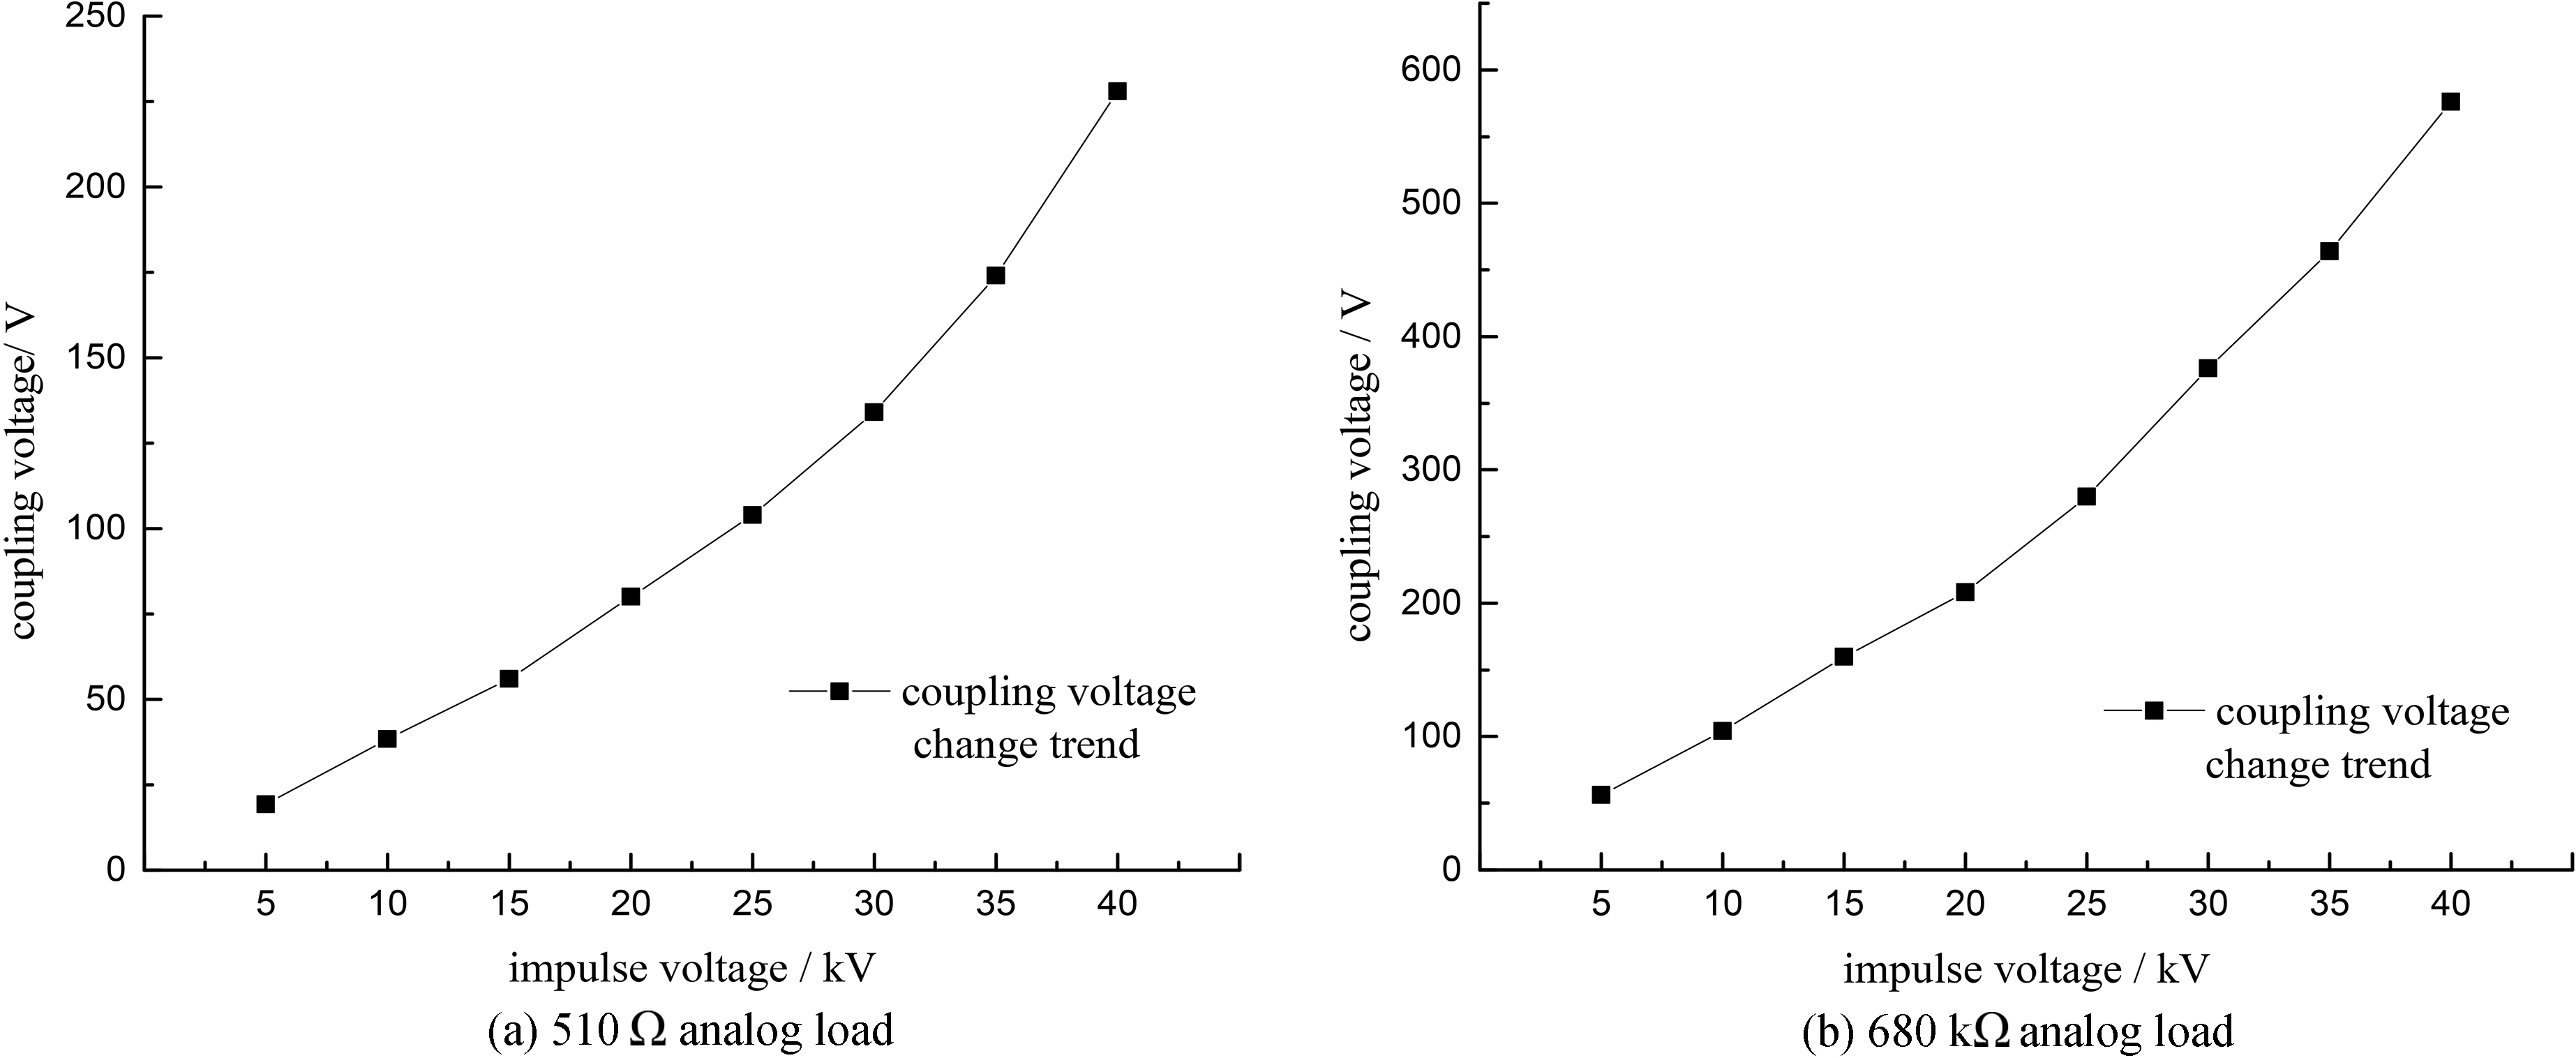
As present as Fig. 10, the overhead height was set as 3 m, and the experiment indicate being 510
The peak values of the coupled voltage data were shown in Table 1.
The coupled peak voltage in different analog load
The coupled peak voltage in different analog load
The coupled voltage change trend with different analog loads.
As presented in Fig. 11, the overhead cable coupled voltage increases with the augment of impulse voltage from excitation source in a linear pattern under different load conditions. On Fig. 11a and b, the load was respectively 300 k
The coupled voltage change trend with different heights.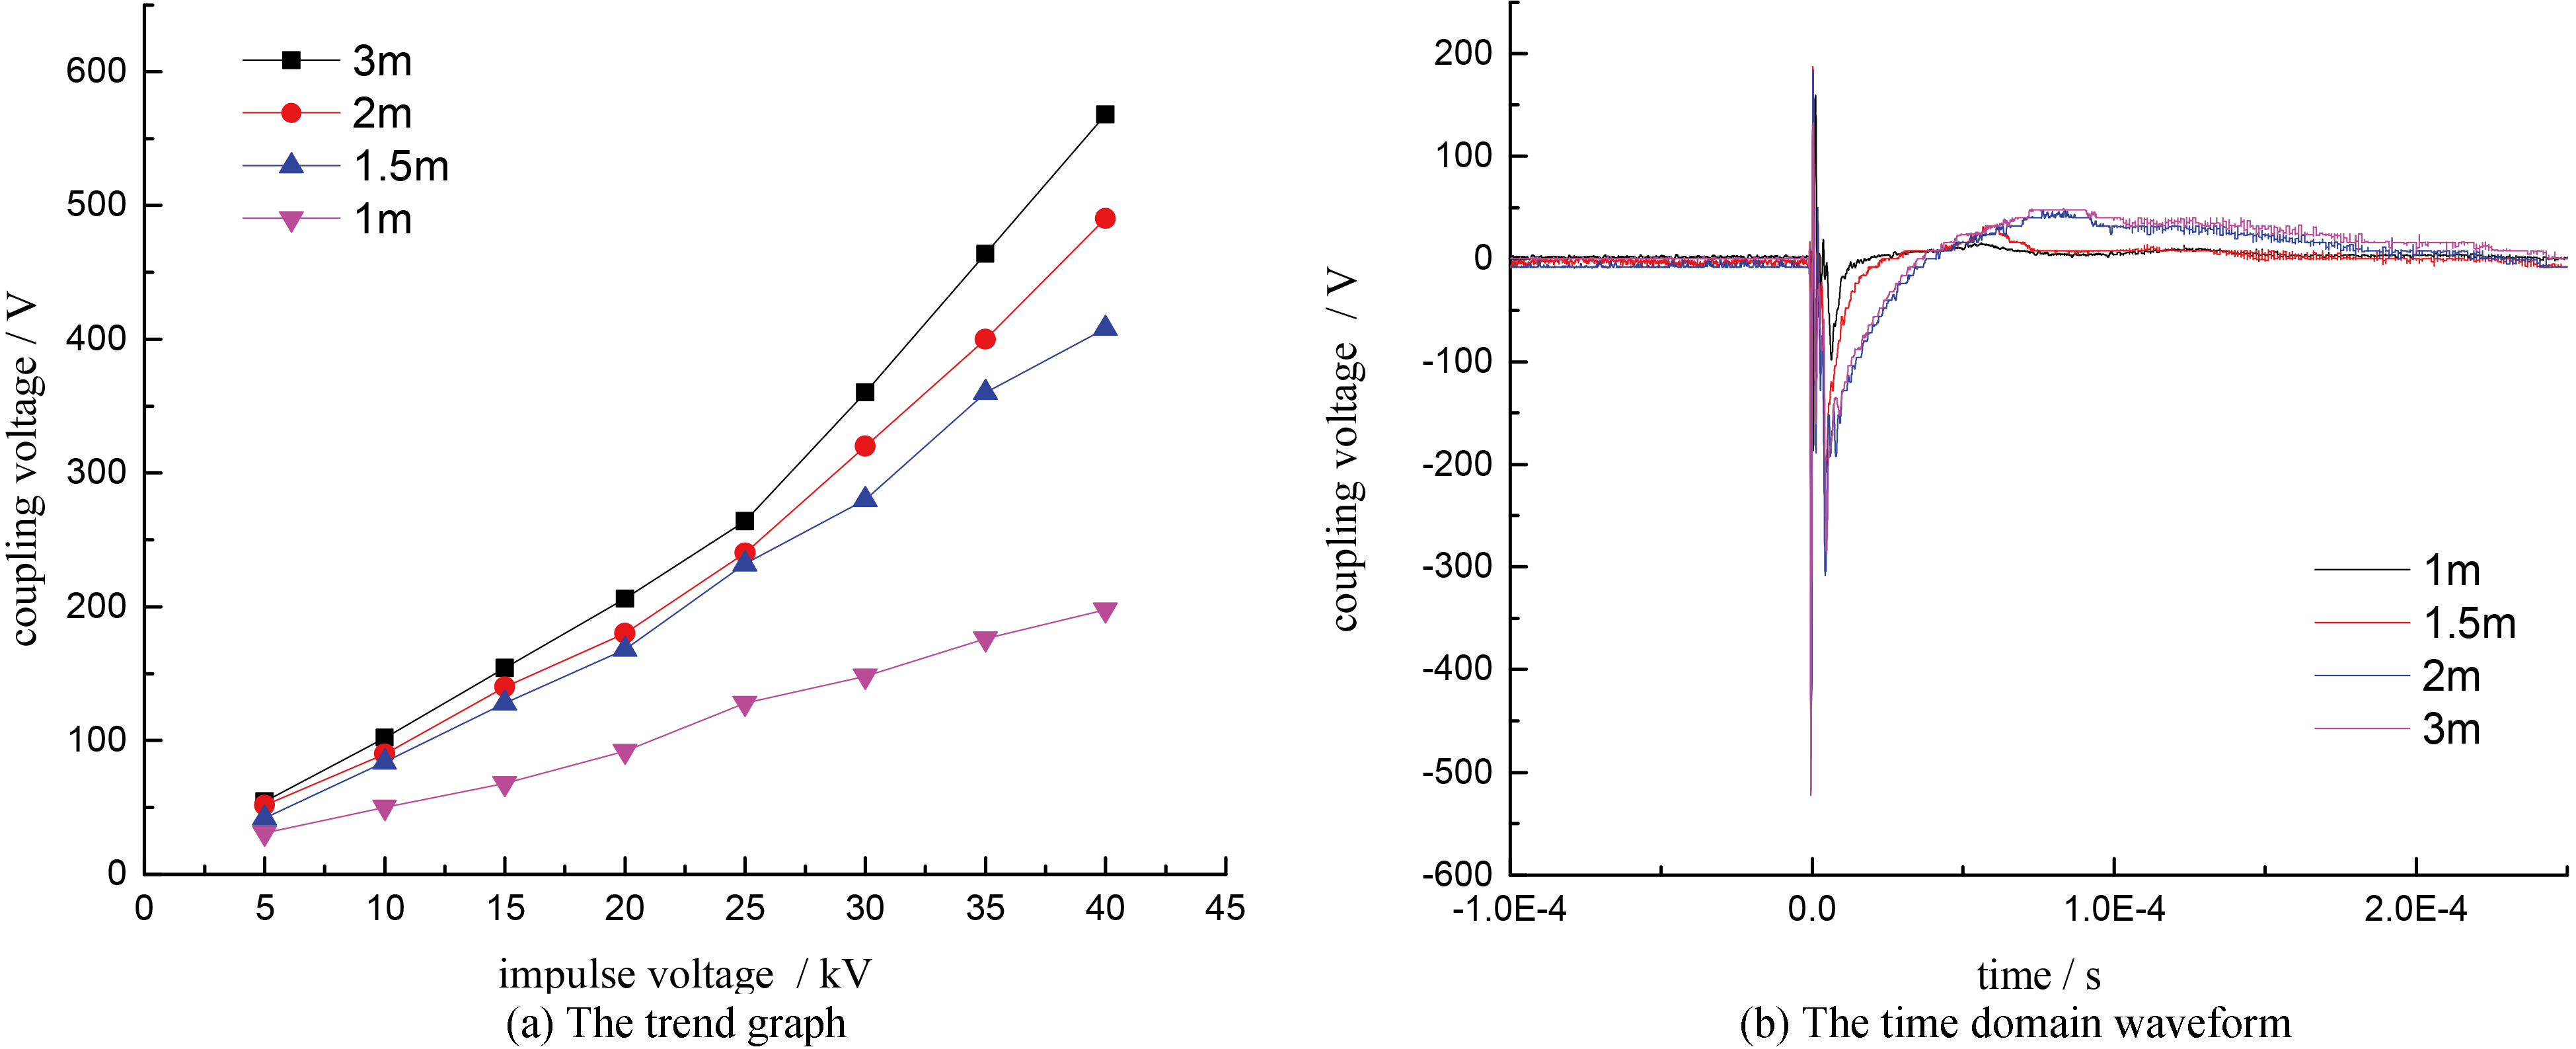
As demonstrated as Fig. 12a, altering the height of transmission line when load resistance was set as 300 k
According to Fig. 12b, higher overhead lines brought higher coupled voltage peak values. The coupled voltage of 2 m, 3 m high overhead lines had greater recoil waveform than the 1 m, 1.5 m ones. The smallest coupled amplitude value appeared at the overhead height of 1 m. 1.5 m, the second smallest value. Although the 2 m and 3 m high had alike waveform that had coincide elements, the peak in 3 m height was significantly greater.
The overhead line length was altered in the pursuant series of experiments. The overhead height was maintained as 3 m, the 40 m wire used. There were four sets of length: 10 m, 15 m, 20 m and 30 m. The extra length of wire was horizontally placed on the ground instead of cutting off when the length decreased in the experiment, so it maintained the resistance. As presented as Fig. 13, the augment of the overhead length made a greater coupled voltage peak in the impulse voltage range of 5–40 kV. In Fig. 13a, when the lightning impulse voltage was 40 kV, the wire with a load of 300 k
The coupled voltage change trend with different length.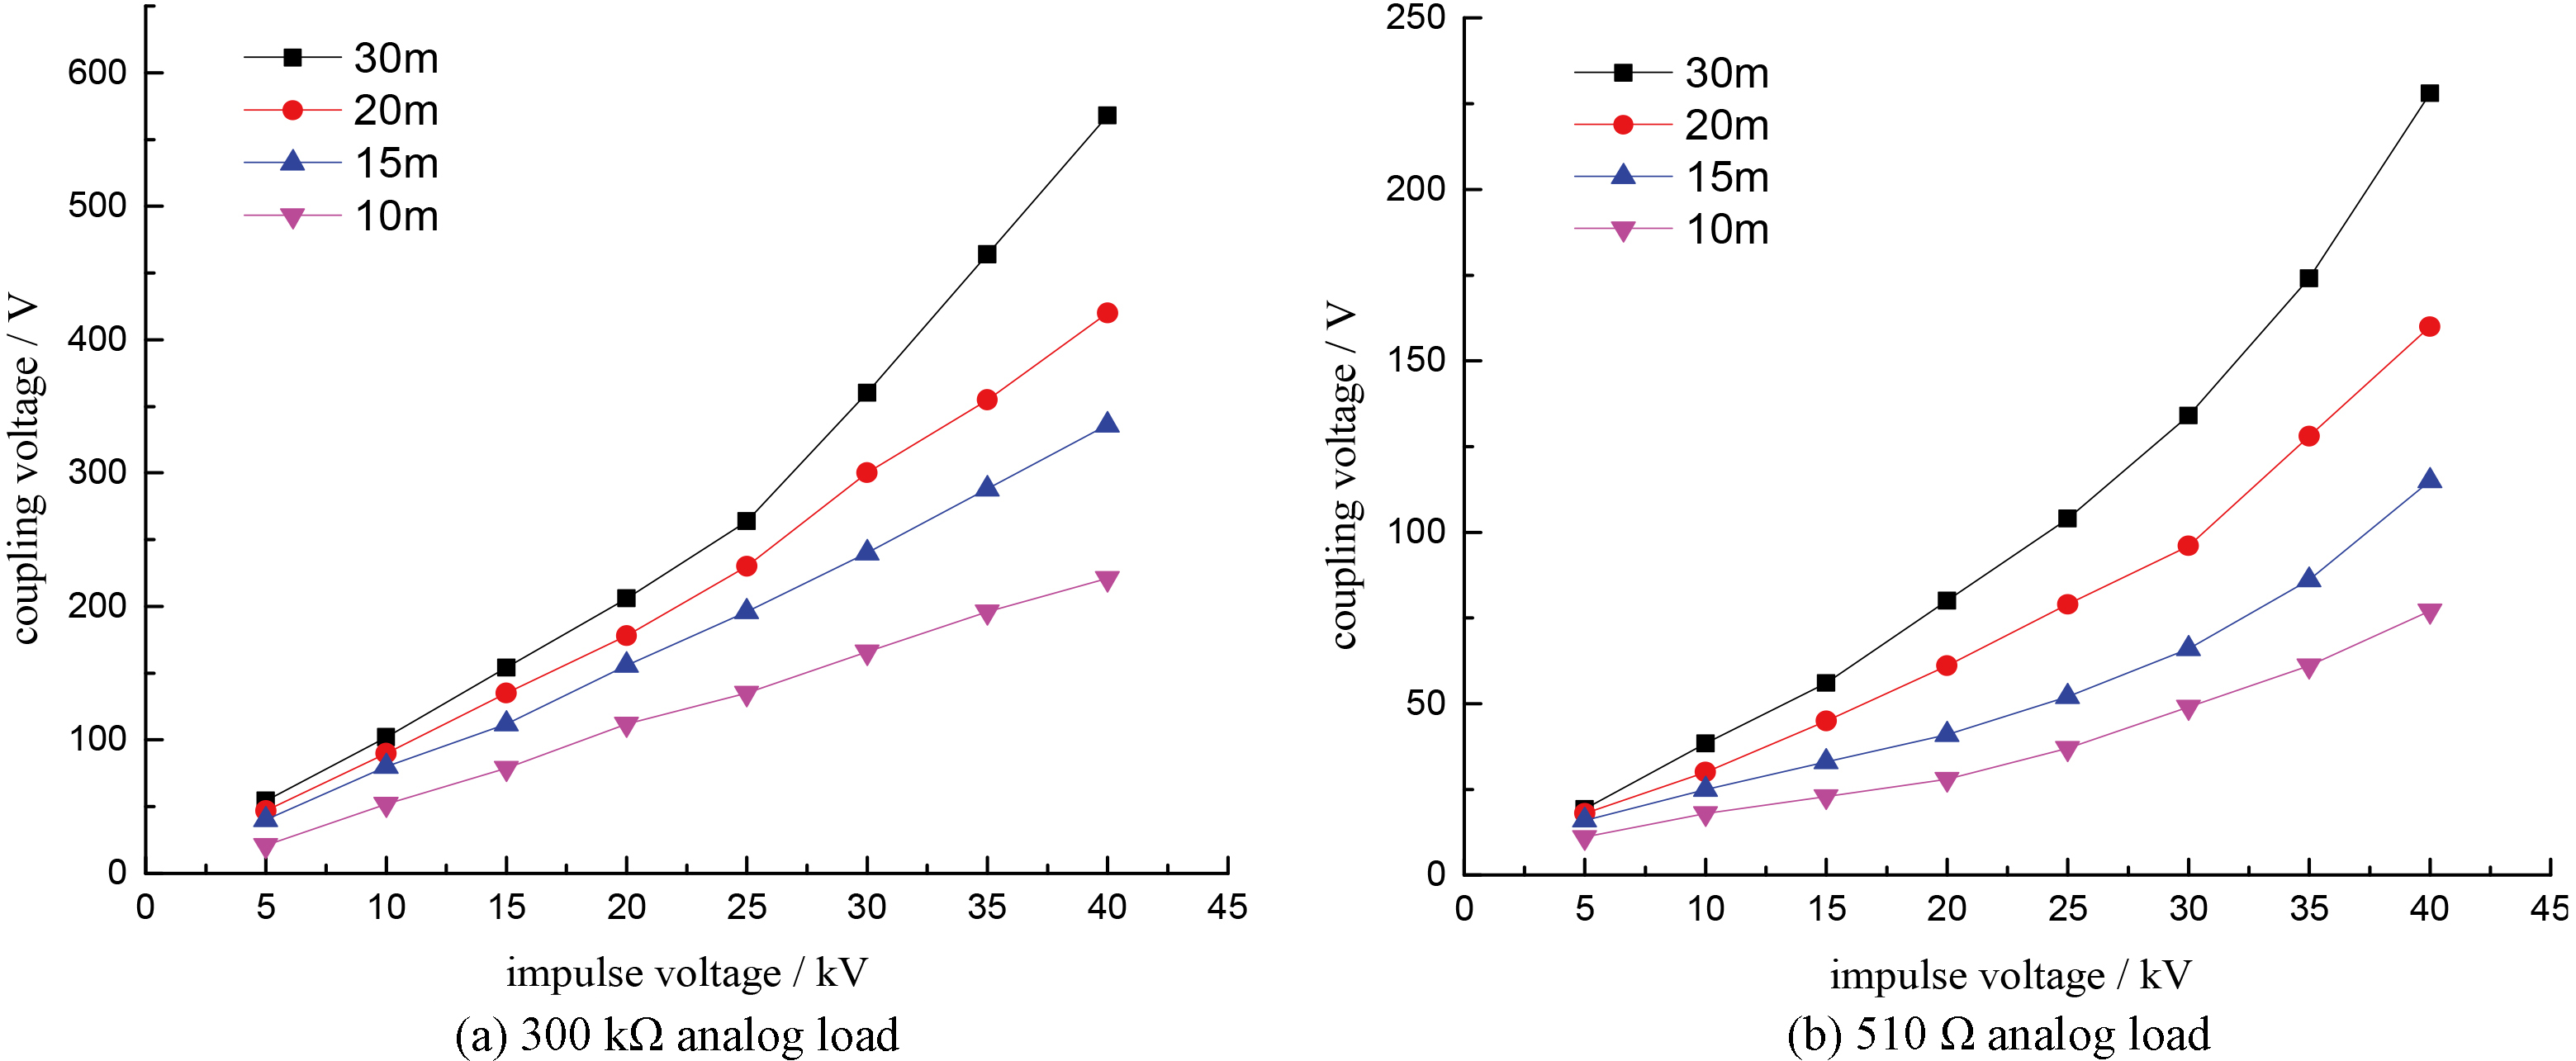
In conclusion, when the other conditions remained invariant, it was presented that the expansion of proportion, adding the height and the length of the overhead cables, would increase the coupled voltage extremely.There is an accordance between the experiments and the theoretical analyses.
When the length of the overhead transmission line is 3 m, and the load impedance is 300 k
The coupled peak voltage in different different distances
The coupled peak voltage in different different distances
Coupled waveform in different distances.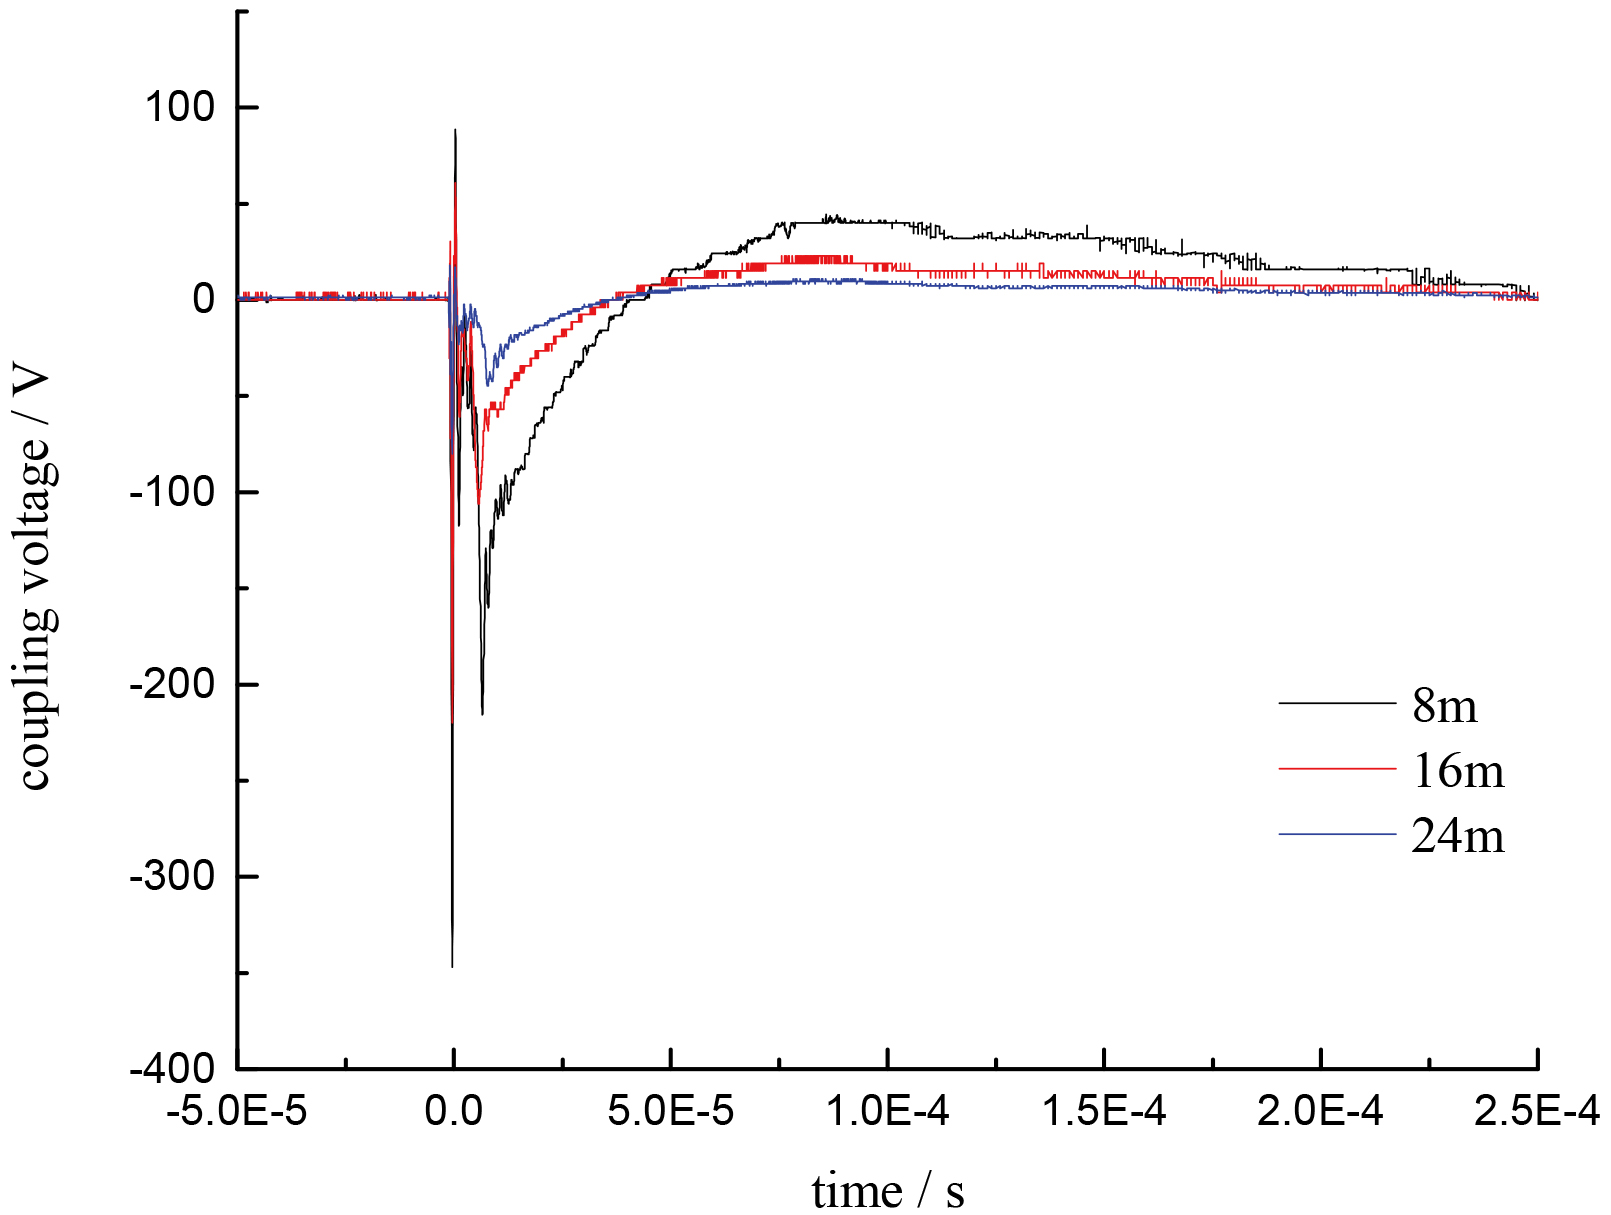
In terms of the generation of the over voltage, caused by the coupling between over-head transmission lines and lightning electromagnetic fields, we have built the model, and tested on multiple conditions, gaining following results:
On the experimental conditions, the coupled waveform of overhead transmission line has smaller coupled energy within low frequency bands (0–100 kHz), compared to lightning current waveform. However, the coupled energy is higher than the source waveform while the frequency reaches 100 kHz. It is presented in the time domain as following characteristics: the faster accelerated waveform; the steeper waveform; the high-frequency oscillation in waveform. The coupled voltage peak values of overhead lines raise with the augment of the lightning impulse voltages. The coupled voltage has a positive correlation with the augment of electric resistance while the resistance of overhead transmission line is below 510 The coupled voltage linearly increases with the add of the height whose range is 1–3 m, so does the length, ranging 10–30 m, since the coupled area of the lightning radiation fields enlarges while the magnetic flux amplifies. The experiment results are conformed to the theories.
Footnotes
Acknowledgments
The authors are grateful for the support from the Chinese Natural Science Foundation (Grant No. 41175003) and a project Funded by the Priority Academic Program Development of Jiangsu Higher Education Institutions.