



Abstract
Magnetic flux simulations were utilized in a novel magnetic measurement method performed for the detection of local thinning of ferromagnetic plates. It was shown by numerical simulation, how parameters affect detectability of the defects. Linear relationship was found between the evaluated parameters and size of the artificial slot. Good correlation was found between theoretical and experimental results.
Introduction
For pipes used in industry, e.g. in chemical and power plants, wall thinning is one of the most serious defects [1,2]. Detection of the thickness reduction is a very important issue for prediction of lifetime of the pipes in order to avoid severe accidents. Local wall thinning on the inner surface of a pipe (e.g. in a nuclear power plant) may occur due to a stream of coolant flowing inside the pipe, causing a serious problem of maintenance of the piping systems. The inspection should be done from the outer side of the pipe. A recently developed nondestructive method called Magnetic Adaptive Testing (MAT) was successfully applied for the detection of local wall thinning in ferromagnetic plates [3,4]. MAT is based on systematic measurement and evaluation of minor magnetic hysteresis loops [5]. It was shown, that even a relatively small, local modification of the plate thickness could be detected from the other side of the specimen with an adequate signal/noise ratio.
To improve applicability of MAT, the measurement conditions should be optimized. It is important to study, how modification of the measured hysteresis loops, caused by the presence of an artificial slot in the investigated ferromagnetic plate(s), are influenced by geometry of the applied magnetizing yoke, by height of the air gaps between the magnetizing yoke and the sample surface (and also between the plates – if there are more than one plate present) and also by size of the slot. For this purpose numerical simulation was performed on a three-sheets system of low carbon steel plates. We calculated [6] how geometrical parameters of the measured arrangement affect change of the magnetic flux inside the magnetizing yoke, i.e. also inside the magnetizing and pick-up coils wound closely around body of the yoke, where the pick-up coil was the main source of the detected variation of the measured signal. Result of the simulation helped to find optimal parameters of the experimental arrangement.
The purpose of the present work is to perform similar numerical simulations of the measurement on a single ferromagnetic steel plate which contains various artificial slots of different size, and to compare results of the simulations with the experimental data. Measurements were done by MAT.
Geometry of the arrangement
A ferromagnetic steel plate of size 500 mm × 300 mm × 6 mm is considered, which contains an artificial rectangular slot, the size of which is varied (Fig. 1). Length of the slot is equal to that of the plate (300 mm), while its width can be 5 mm, 10 mm and 15 mm and its depth 1, 2 and 3 mm. Magnetization of the plate is brought about by a yoke attached on top of the plate. The yoke is a C-shaped laminated Fe-Si transformer core with cross-section S = 10 × 5 mm2. It is magnetized by a coil wound on the bridge of the yoke with N = 200 turns. There is also a pick-up coil wound on one of the yoke legs with n = 75 turns (note that coils are not shown on the figure).

Configuration used both for measurement and simulation. The geometry on the right represents a quarter-view of the arrangement, showing only part of the whole plate, and with the yoke in central position right above the slot.
Change of the magnetic flux density in the cross section of the magnetizing yoke, which occurs due to the presence of the artificial slot, was calculated as a function of the size of the slot The AC/DC Module of the Comsol Multiphysics® finite element software was used for the simulations [7]. The physics setting is “magnetic fields” (mf), the governing equation of which is
Let 𝛷1 denote the flux in the yoke according to (2) when there is no slot in the material and, in turn, 𝛷2 be the flux in the presence of the slot. We define the relative change of the magnetic flux as 𝛷1∕𝛷2. By the simulations we investigated how this flux change depends on the size of the slot and on the distance between the legs of the magnetizing yoke. Three slot widths (5, 10 and 15 mm) were combined with three slot depths (1, 2 and 3 mm) resulting all together in nine different cases.
In Fig. 2. the calculated flux change is plotted for all these cases as function of the distance between the legs of the magnetizing yoke. It can be seen that by optimal choice of the yoke, the obtained flux change can be maximized. As expected, the flux change strongly depends on the size of the slot, but the dimensions of the magnetizing yoke (e.g. distance between yoke legs) play only a limited role.
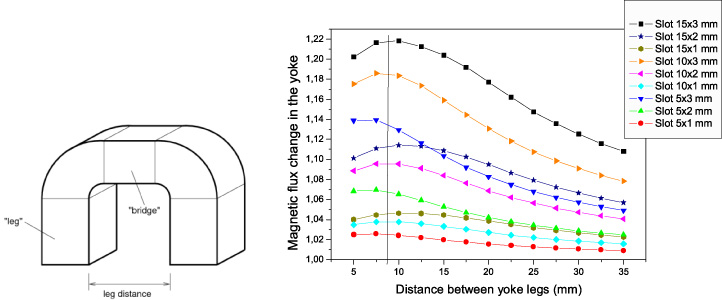
Left: geometry of the magnetizing yoke; right: relative flux change, 𝛷1∕𝛷2, as function of the yoke leg distance, with the slot cross section area as parameter.
In the present work we are going to make a comparison between results of the simulation and the experiment. In the experiment (see below) in all measurements we used the magnetizing yoke having 8.2 mm distance between the legs, and only the size of the slot was modified. Therefore we picked those points from the computed curves in Fig. 2 that correspond to the 8.2 mm yoke leg distance (marked by vertical line), and plotted them versus the cross section area of the slot (see Fig. 3).
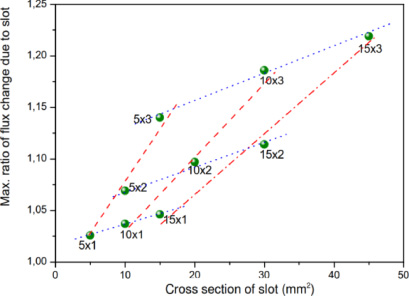
Maximum values of the calculated flux change for different cross sections of the slots (cf. Fig. 2).
Measurements were performed by MAT on the above described steel plate having different size slots. MAT investigates a complex set of minor hysteresis loops (from a minimum amplitude of the magnetizing field, with increasing amplitude by regular steps) for each sample of the measured series. A specially designed permeameter [8] with a magnetizing yoke was applied for measurement of families of minor loops of the magnetic circuit differential permeability. The flat samples were magnetized by the attached yoke having a total outside length 18.2 mm, a total outside height of the bridge 22 mm, and a distance between the legs 8.2 mm (see above). The magnetizing coil gets a triangular waveform current with step-wise increasing amplitudes and with a fixed slope magnitude in all the triangles.
This produces a triangular time-variation of the effective field in the magnetizing circuit and a signal is induced in the pick-up coil. As long as the field sweeps linearly with time, the voltage signal in the pick-up coil is proportional to the effective permeability of the magnetic circuit. Note that we cannot speak about “frequency” in this measurement, because the time of each period is increasing due to the increased amplitude of the minor loops. The magnetizing current rate of change was chosen as 1 A/s. This low rate means an almost static magnetization, so the possible influence of eddy currents is negligible. The influence of magnetizing current’s speed in Magnetic Adaptive Testing was studied detailed and reported in [9] and [10].
The permeameter works under full control of a PC computer, which registers data files for each measured family of the minor “permeability loops”.
The experimental raw data are processed by an evaluation program, which divides the originally continuous signal of each measured sample into a family of individual permeability half-loops. The program filters experimental noise and interpolates the experimental data into a regular square grid of elements, 𝜇 ij ≡ 𝜇(h ai , h bj ), of a 𝜇-matrix with a pre-selected field-step. 𝜇-matrix is the matrix of permeability, which elements are simply calculated from the measured permeability loops. Coordinates h ai , h bj of the elements represent the actual magnetic field value, h ai , on the actual minor loop with amplitude h bj . Each 𝜇 ij -element represents one “MAT-descriptor” of the investigated material structure variation.
The matrices are processed by another evaluation program, which divides values of their elements by corresponding element values of a chosen reference matrix (i.e. matrix standardization), and arranges each set of the mutually corresponding elements 𝜇 ij of all the evaluated 𝜇-matrices into a 𝜇 ij (x)-degradation function. Here x can be any independently measured parameter. In our case this is the position of the center of the magnetizing yoke with respect to the axis of the slot when it moves on the surface of the sample along a straight line perpendicular to the length of the slot. The sketch of the measurement is shown in Fig. 1. The details of evaluation (i.e. how the optimal MAT descriptors are chosen) is presented in [5].
The magnetizing yoke is moved step-by-step in the x-direction on the top surface of the sample. The slot is located on the bottom side. The MAT measurement is performed at each pre-selected position of the yoke. The yoke is oriented perpendicular to the axis of the slot in all cases.
Once the degradation functions are computed, the next task is to find the optimum degradation function(s) for the most sensitive and enough robust description of the investigated material degradation. The matrix-evaluation program calculates also sensitivity of each permeability 𝜇 ij (x)-degradation function and draws their “sensitivity map” in the plane of the field coordinates (h ai , h bi j ) ≡ (i, j). A 3D-plot of sensitivity of the degradation functions can substantially help to choose the optimum one(s). This map shows relative sensitivity of each 𝜇 ij (x)-degradation function with respect to the independently measured x-parameter of the investigated material. Sensitivity of each degradation function is computed as the slope of its linear regression and it is expressed by a color and/or shade in the sensitivity map figure. This map is very useful if we want to characterize the reliability and reproducibility of the MAT descriptors. To ensure high enough sensitivity, MAT descriptors should be taken from the highest sensitive area (colored by red in Fig. 4). If the area of the highest sensitivity is large enough, good reproducibility of the measurement is ensured. For illustration, the map of relative sensitivity of the 𝜇(x)-degradation functions in the case of the detected 10 mm × 3 mm slot is shown in Fig. 4. It is also indicated in this figure by crossing lines, from which point the “optimal MAT degradation function” of Fig. 5 is taken.
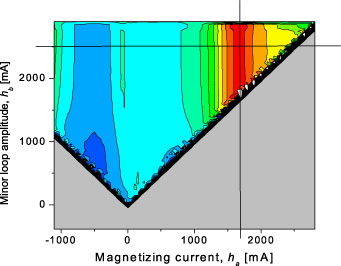
Sensitivity map of the 𝜇(h ai , h bj , x)-degradation functions. The degradation functions with the magnetizing current coordinates around h a = 1650 mA, and with minor loop amplitudes larger than h b = 1700 mA have the top sensitivity, and used in Fig. 5.
Results of the measurements performed on three different plates having 10 × 1, 10 × 2 and 10 × 3 mm2 cross sections of their slots are shown in Fig. 5 for illustration. Similar measurements were performed for plates containing 5 × 1, 5 × 2, 5 × 3, 15 × 1, 15 × 2 and 15 × 3 mm2 slots, respectively, but those results are not shown here. The optimally chosen MAT-degradation functions were normalized by the value measured at the largest distance from the center of the slot (x = −60 mm). It is clearly seen that the MAT descriptors have a well-defined local maximum when the magnetizing yoke is positioned over the center of the slot. The larger the size of the slot the larger signal is observed.
Evaluating the measured curves (cf. Fig. 5) the maximum values of the MAT descriptors can be plotted as function of the cross sectional area of the slot (see Fig. 6). The dot and dash lines show the correlation between magnetic descriptors and volume of the slot for the given depths and widths of the slots. Obviously, the spread of these points is very similar to that of the simulated ones (cf. Fig. 3).
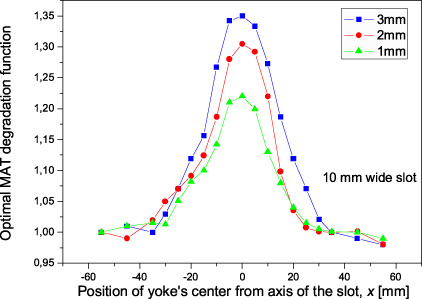
The optimally chosen MAT degradation functions vs. position of the center of the yoke. The center of the 10 mm wide slot is at position x = 0. Parameter: depth of the slots.
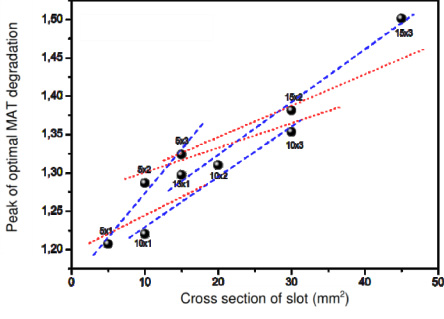
Peak values of the measured MAT descriptors for different size slots: points represent different individual slot cross sections, e.g. 10 × 3 denotes a 10 mm wide and 3 mm deep slot.
It was found that existence of the investigated artificial slots can be detected with a good signal to noise ratio by a nondestructive magnetic method (MAT) based on magnetic minor hysteresis loop measurement. The evaluated parameters indicate presence/absence of the slot and are able even to reflect size of the slot quantitatively. Numerical simulation confirmed that detection of the slot by a magnetic inspection head (i.e. the magnetic yoke with the necessary coils) attached to the investigated steel plate from the side opposite to where the slot is situated makes sense. The signal measured inductively by the experimental method in the pick-up coil originates from variation of the magnetic flux inside the magnetic circuit composed of the magnetizing yoke and of that part of the ferromagnetic plate, which contains the investigated slot.
The results of both the simulation and of the experimental measurement showed nearly linear correlations between the evaluated parameters and the cross section of the slots. This was true both for the case when depth of a given slot was fixed and its width was modified, and also when width of a given slot was fixed and its depth was varied. However, the slopes were significantly different (see Figs 3 and 6). Consequently we can conclude that depth of the slot has a larger influence on the measurable signal than its width, considering the same slot volume.
Good qualitative correlation was found between the calculated relative change of the magnetic flux, 𝛷1∕𝛷2, and the peak values of the optimally determined measured MAT normalized parameters (again, cf. Figs 3 and 6). In a quantitative sense, the simulated and the measured parameters differ by some percent, but this can be certainly improved by taking a more detailed computational model.
Conclusions
Long rectangular artificial slots were milled in the bottom sides of plane-parallel steel plates. Presence and dimensions of such slots were detected magnetically by a magnetizing inspection head positioned at the top side of the plate. Detection of similar slots (or thinning of such plates) from the opposite side of the plates is an important tool for finding potentially dangerous defects in any closed piping system, e.g. in nuclear power plant cooling manifolds. Numerical calculations were performed and system of minor magnetic hysteresis curves was measured. Magnetic measurements proved that the slots can be detected with good signal/noise ratio, and simulation showed that this phenomenon can be interpreted by calculation of magnetic flux change inside the magnetizing yoke. It was also found that keeping the same volume of a given slot, the depth of the slot has a larger influence on the measurable signal than the width of the slot.
The results of simulation can be used successfully for determining the optimal parameters of the actual measurement arrangement of the MAT method. A useful message of the present work is to show the tendency, that is, how parameters of the testing arrangement affect the measured magnetic flux. This result can also be important for identification of the slots from the measured signal. The good correlation between the calculated and measured quantities also means the experimental validation of the used simulation method.
Footnotes
Acknowledgements
The work was supported by the Hungarian Scientific Research Fund (project K 111662) and by the Researcher Exchange Program between the Czech Academy of Sciences and Hungarian Academy of Sciences. S. Bilicz appreciates support of the János Bolyai Research Scholarship of the Hungarian Academy of Sciences. I. Tomáš appreciates support of the project No. 14-36566G of the Czech Science Foundation.