
Abstract
A 3-D coupled magneto-fluid-thermal model is established for temperature rise prediction in a ventilated dry-type transformer rated at 2500 kVA. In order to accurately estimate electromagnetic losses, a three-dimensional (3-D) transient finite element method considering the effect of eddy-current losses on the foil type windings is proposed. Besides, two orthogonal B-P loss curves are adopted to model the anisotropy of grain-oriented (GO) silicon steel. The non-uniform power losses of winding and core are mapped into the thermal field as heat sources. Moreover, the transformer structures such as the narrow struts, insulation barrier and clamps are considered to improve the computational accuracy of air velocity and temperature distribution. At last, the test of temperature rise has been carried out to verify the proposed model.
Introduction
When the large capacity dry-type transformers is running under long-term full load, various overheating problems may possibly arise due to highly nonuniform of loss distribution or poor cooling conditions [1–3]. Especially for the foil-type windings, the extremely significant eddy currents at both ends of the windings are more likely to cause the damage of electrical insulation [4]. The
In this paper, a SCB10-2500kVA/10kV dry-type transformer is tested to verify the proposed model. The electromagnetic power losses are calculated in 3-D transient magnetic field based on Maxwell software considering magnetic anisotropy of silicon steel and eddy current losses, which are imported to the thermal field analysis as the heat source. The convective heat transfer coefficient can be calculated by the iteration of CFD in fluid-solid interface based on Fluent software. The temperature calculation and velocity distribution are in good agreement with the measured results.
Analysis methodology
Measurement of magnetic anisotropy properties
A novel 2-D magnetic property testing system is established in this paper as shown in Fig. 1. The excitation structure consists of the vertical double-yokes and two pairs of core poles wound with the excitation coils. And the sensing structure is composed of the conventional B needles and two H coils which are wound around a 50 mm × 50 mm epoxy plate. The feedback control system in the LabViewTM infrastructure can generate two-channel signals to magnetize the silicon steel specimen in alternating and rotating mode. By using the analog output of the data acquisition card and two linear power amplifiers made by BrockhausTM, the four signals of U
Bx
, U
By
, U
Hx
, U
Hy
corresponding to the
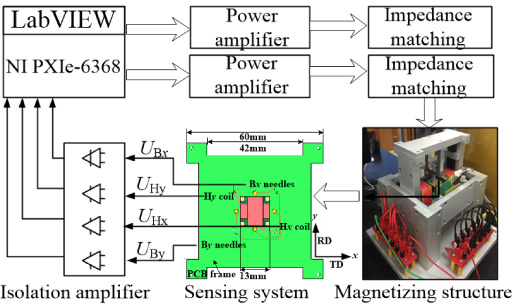
The 2-D magnetic properties testing system for single steel sheet.
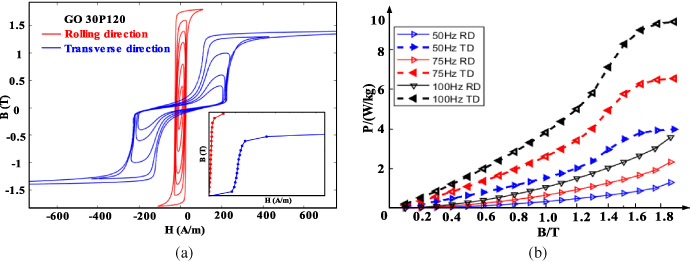
Anisotropy measurement of GO 30P120 steel (a) Hysteresis loops along RD and TD at 50 Hz. Inset: corresponding magnetization curve (b) Measured core losses in GO steel single sheet along RD and TD at 50 Hz, 75 Hz, 100 Hz.
The EMF voltage of B induction coil is controlled as a standard sinusoidal waveform whose total harmonic distortion (THD) is not larger than 0.5%. The measured H signals integrated by the EMF of H induction coils are diverse for that along rolling direction (RD) and transverse direction (TD). The hysteresis loops and corresponding magnetization curves of grain oriented (GO) steel 30P120 (0.3 mm) under alternating magnetization in RD and TD are shown in Fig. 2(a). The measured core losses in RD and TD with different frequencies and flux densities are displayed in Fig. 2(b). It can be noticed that the magnetization curve in RD is much higher than that in TD, implying a higher permeability. Besides, the alternating core losses increase with increasing frequency and magnetic flux density, while the core loss in TD is obviously much larger than that in RD. As a result, the silicon steel in RD is easier to be magnetized than that in TD, with a remarkable spatial anisotropy in the silicon steel plane. The B-H curves and series of B-P curves in the orthogonal direction (along y-axis and x-axis) are used as the material data in the finite element method (FEM), so that the nonlinearity and anisotropy of GO steel can be taken into account.
In this paper, the 3-D transient finite element analysis model is built up to predict transient core losses at each time step. The total loss P is mainly composed of the eddy current core loss P
c
, hysteresis core loss P
h
and excess core loss P
e
. The transient loss models are derived from dynamic Steinmetz equation, as follows [15]:
The
The fluid flow and heat transfer in dry-type transformer need to meet the energy, momentum and mass conservation laws. A standard k–ϵ equation is used to describe the turbulence model within the ventilation system due to the calculated Reynolds number (Re > 2300). Since the Mach number of airflow in the transformer model is small, the air used to ventilate the power transformer can be considered as the incompressible Newtonian fluid. The energy equation complemented with the continuity and momentum equations can be used to describe the temperature distribution and fluid movement within the transformer, as follows [18]:
In the region of the transformer windings and iron core, the equation of heat conduction in 3-D Cartesian coordinates is given as follows [18]:
Figure 3(a) shows the 3-D electromagnetic computation model of a SCB9-2500kVA/10kV dry-type transformer, mainly consists of the core, structural parts as well as high & low voltage (HV & LV) windings. As shown in Fig. 3(b), the layer-type foil winding is adopted as the LV structure, whose interlayer insulation employs GHG insulating paper. While the segmented cylindrical type wire winding is adopted as the model of HV structure, the external insulation of which is cast by epoxy resin. The basic parameters of the tested transformer are shown in Table 1.
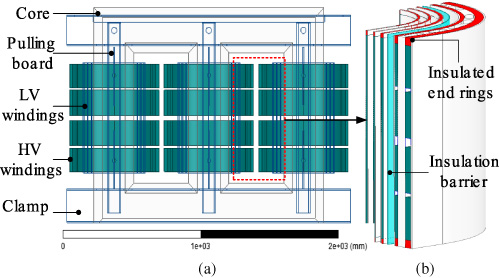
The 3-D simulation model of the ventilated dry-type transformer model. (a) Schematic simulation model (b) Winding structure.
Parameters of the tested transformer
The flowchart of the 3-D coupled magneto-fluid-thermal model is shown in Fig. 4. The power losses of core and windings calculated by FEM model as the heat source are exported to the CFD model. After each iteration of CFD and magnetic simulation iteration, the resistivity of the copper conductor is updated based on the temperature results, until the temperature error is less than 0.1 K. The memory of the high -performance computer is 32 G, with 2.5 GHz and 10-cores CPU. The calculated results need around 8 hours to achieve the convergence accuracy with approximately 1000 step iterations.
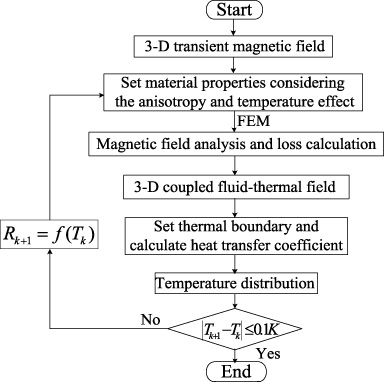
Flow chart of 3-D coupled magneto-fluid-thermal model.
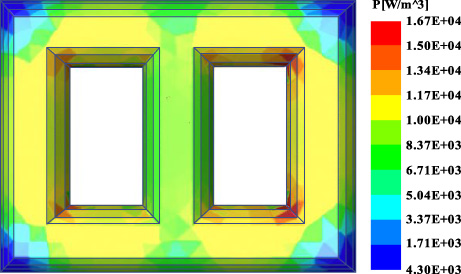
The simulated loss density distribution in the core of transformer.
Based on the dynamic Steinmetz equation considering the nonlinear magnetization characteristics and the anisotropy of silicon steel, the averaged loss distribution of the transformer core in one period can be observed in Fig. 5. The simulation results show that the loss concentrates at the core limb and middle iron yoke, whose maximum value locates at the T-shaped corner. Figure 6 shows the distribution of magnetic flux in the calculation model of the transformer. There exists a great quantity of longitudinal leakage flux in the main airway of HV & LV windings and transverse leakage flux at both ends of windings due to the fringing effect. Consistent with the leakage flux distribution, the eddy current loss in foil winding is generated non-uniformly, especially in the innermost layer. The variation of the total current density is significant especially in the region of both ends of the winding.
The maximum current density can be up to 2 times as large as the current density (3.01 × 10⁶ A∕m2) in the internal area of foil winding. The current density in the outermost layer shows a wavy distribution due to the leakage flux caused by the segment structure of the HV windings, which peak value can be up to 3.42 × 10⁶ (A∕m2). Table 2 shows the simulation and tested values of various power losses. The core losses are obtained by no-load experiment, while the winding losses are measured by short-circuit experiment. The errors between computational and experimental results are within 8%.
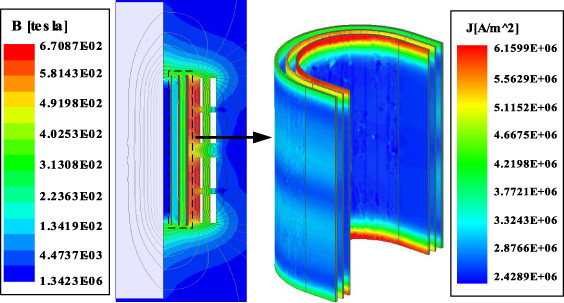
Current density distribution for foil windings induced by magnetic leakage flux.
Losses calculation and comparison
Considering the natural convection heat dissipation of the transformer, the periodic symmetric temperature model is established in Fig. 7(a). The external walls of the surrounding air have been prescribed as the pressure boundary conditions. Based on the testing environment in the laboratory, the parameters of the static pressure and initial temperature are set up to 101325 Pa and 293 K, respectively. In order to speed up the CFD simulation, the bottom surface is regarded as the inlet velocity boundary, in which initial inlet velocity can be set as 0.01 m/s.
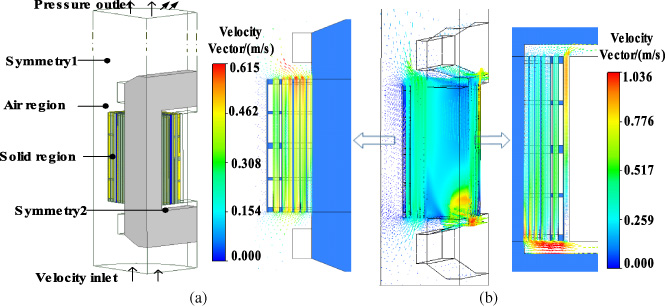
The periodic symmetric temperature model of the transformer (b) The distribution of velocity inside the transformer.
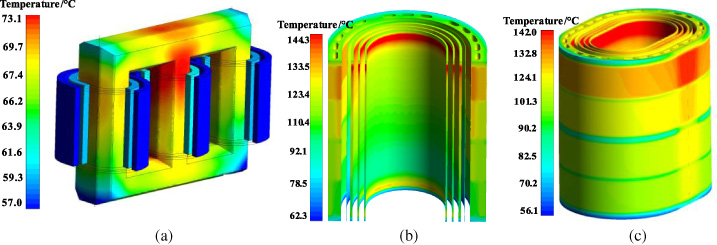
Temperature distribution inside the transformer model. (a) Transformer core. (b) LV windings (c) HV windings.
The velocity vector distribution of the air inside the transformer is shown in Fig. 7(b). The velocity near the upper part in the air duct is much larger due to the higher temperature, ranging from 0.15 m/s to 0.78 m/s. Moreover, the maximum velocity at the inner narrow air duct of the HV windings can be up to 0.8 m/s. The transformer structures especially the core yokes and clamps can block the flow path of the air, while the air duct can provide additional air flow path with relatively low wind resistance. As a result, the optimization of the ventilation system can be beneficial to dissipate the heat and to remove the potential hot-spot at the conceptual design stage of the power transformer.
The temperature distribution inside the transformer model considering the air fluid is shown in Fig. 8, the hot-spot region of the transformer core in no-load condition locates at the upper part of the core limb as shown in Fig. 8(a), the averaged temperature rise of the core is 65 °C. Figure 8(b) and Fig. 8(c) represent the temperature distribution results inside the transformer windings. The variation of temperature along the axial contours of the three-layer foil windings exhibits a similar behavior. The temperature rise is extremely significant at both edges of the windings, which can attribute to the eddy current loss induced by magnetic leakage flux. The hottest-spot area is observed at the upper part of the innermost windings, up to the maximum value of 139.4 °C. The insulating barrier is mainly used for electric isolation, whose temperature rise can be up to 75 °C because of the absorption of radiant energy between the high-voltage and low-voltage windings. For HV windings, the temperature of the inner layer is higher than that of the outer layer, since a large amount of heat is transferred to the external environment in the form of air convection and radiation. The hottest region locates on the inner surfaces of the first segment HV windings, whose average temperature is equal to 135 °C.
In order to verify the simulation, the testing system of transformer temperature rise has been established as shown in Fig. 9(a), which includes three-phase AC regulator, infrared thermography, thermocouple tester, anemometer and flowmeter. Several typical temperature measurement points are selected along the axial direction of B phase winding as shown in Fig. 9(b). The temperature rise curves at these points during eight hours’ operation are automatically recorded, when the temperature fluctuates no more than 1 K. Figure 10 shows the comparison between the simulated and tested temperature rise at the points marked in Fig. 9(b), the error percentage is within 7%. Figure 11 shows the temperature distribution of the transformer core under no-load test and the HV windings under short-circuit test by using an infrared thermography, the temperature rise and hot-spots prediction are highly consistent with the measured ones.
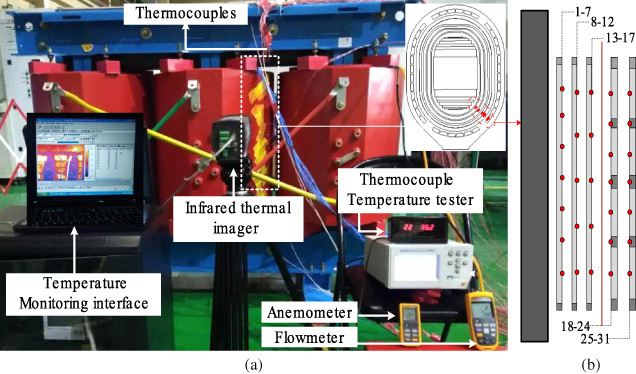
Temperature rise test (a) Experimental system (b) Temperature measurement point in the windings.
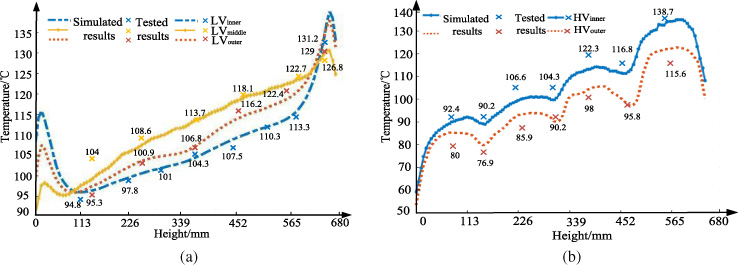
Temperature distribution of the transformer windings along the axial direction. (a) LV windings (b) HV windings.

Temperature distribution measured by an infrared thermography. (a) Core temperature under no-load test (b) Winding temperature under short-circuit test.
A 3-D coupled magneto-fluid-thermal model for a ventilated dry-type power transformer is built up, which no longer relies on the empirical convective heat transfer coefficient in fluid-solid interface. Considering the temperature property of the conductor materials and magnetic anisotropy of the electrical sheet, the electromagnetic losses and temperature rise of the transformer are simulated by multiphysics field analysis. Moreover, the dedicate structures of the insulation barrier and narrow strut are considered to obstruct the path of fluid flow and heat radiation. The proposed method is proved to be valid for the thermal design of power transformers since the simulated results are in good agreement with the measured ones at the specific hot-spots.
Footnotes
Acknowledgements
This work was supported by the project from State Grid Corporation of China (52110419000R).