
Abstract
Although polymer nanocomposites have attracted much attention, their bulk application is limited due to poor manufacturing scalability while maintaining organized microstructures. Active assembly of nanoparticles using magnetic fields is a promising nano-manufacturing method, as it allows control of alignment direction, is inexpensive, non-damaging, scalable and allows organization of fillers by inter-particle motions. This paper describes the design of an automated image capture and magnetic control system to study the alignment of magnetic graphene nanoparticles in an epoxy matrix by applying a low magnetic field (∼100 mT) and by the automatic image capture of magnetization effects through an optical microscope. This system can continuously observe the alignment process, providing more accurate information about the behavior of the nanoparticle orientation compared to a manual method that only allowed observation of the sample after the experiment had been conducted. A better understanding of nanoparticle alignment could lead to the development of composites with oriented carbon-based nanoparticle structures.
Introduction
With the growing demand for advanced lightweight composites, polymer-based nanocomposites reinforced by carbon nanofillers have attracted wide attention due to the low fabrication cost, low-mass and their outstanding multifunctional properties, providing potential applications in various fields, such as in the automotive, aerospace, in electronics, among others [1]. Although, many methods have been directed towards producing polymer carbon-based composites for functional and structural applications, the main problem is still the poor dispersion of the carbon nanofillers into the polymer matrix, leading to degraded mechanical and electrical properties with limited industrial applications [2,3]. Among them, an active assembly manufacturing technique applying magnetic fields has shown promising results since it allows for the bulk processing of nanocomposites while retaining a homogeneous microstructure [4]. In order to achieve controlled nanoparticle organization in nanocomposites, the understanding of some critical issues is needed, such as the proper conditions (filler loading, field strength, alignment time) for the formation of the nanoparticles under the applied magnetic field.
This paper presents the design and development of an automated image capture and magnetic control system which allows the study of the alignment of magnetic graphene nanoplatelets (GNPs@MNP’s) in an epoxy matrix using a low magnetic field (∼100 mT) by capturing automatically images of the magnetization effects through an optical microscope (Fig. 1).

Schematic image (a) and digital photograph (b) of the magnetization system comprising the electromagnet and the optical microscope which controlled by the LabView software, giving the ability for automatic capture imaging.
The automatic image capture process was controlled by the use of LabView software. In order to align the magnetic nanoparticles, a steel electromagnetic C-core was built and was energized by a software-controlled power supply unit which allows the user to define the required magnetic field strength through the LabVIEW VI. The alignment procedure of the magnetic nanoparticles under the application of a magnetic field was held via a series of experiments using different concentrations of the magnetic graphene sheets (GNPs@MNPs). Due to automation of the image capture during the curing process, a large number of curing conditions can be analyzed and examined at any point during the process, providing the optimal conditions about the magnetic assembly of the nanoparticles into the epoxy composites.
The development and design of an automated camera system
An automatic image capture system was developed, providing accurate analysis for the nanoparticle magnetic orientation in a polymer matrix. An optical microscope (Leitz Ergolux) had an attached Infinity X 32 Mega Pixel USB camera with a capture rate of 30 Frames per Second (FPS) in video mode and an image resolution of 1280 × 1024. LabVIEW was chosen by supporting a variety of drivers that allow the programmer to implement any supported camera instantly without direct consideration of the driver itself, reducing complexity and time. LabVIEW was the language to develop the automation side of the system with NI Vision Acquisition Software (VAS) being a suite of drivers that support the acquisition and saving of images from a large range of camera standards.
LabView VAS was used which is suitable to create a live video, giving best observation results. For instance, the grab.vi provides a VI (Virtual Instrument) that runs once and captures a single image (Fig. 2(a)). This was the starting point of the control system as it provided the absolute minimum ability of capturing an image. It can be seen that the example VI (Fig. 2(b)) contains a number of sub VIs with various uses. The sub VI labelled opencamera.vi (I) is self-explanatory, as it attempts to open a camera on the selected port. The second sub VI labelled IMAQ (Image Acquisition) snap2.vi (II) captures a single frame of the camera, with a utility labelled IMAQ (V) consisting of a Call Library Function that provides the required memory and information in order to store an image.
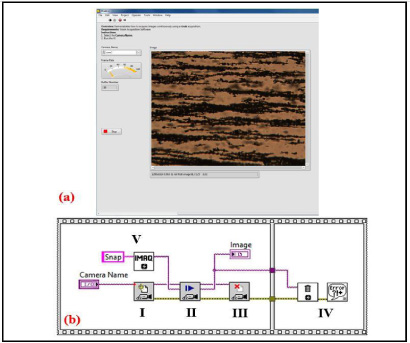
(a) Grab.vi is used as provided by NI to create a live video. A fully cured 1% wt. magnetic nanoparticles (GNPs@MNP’s) sample is being brought into focus. (b) A sequence structure in snap.vi, explaining the procedure of capturing a single image.
The image is then displayed in the VI and the camera port closed (III). Any errors are fed to an image dispose VI (IV) that is then wired to an error output. A sequence structure is implemented in snap.vi to ensure that the camera attempts to capture an image before an error is generated.
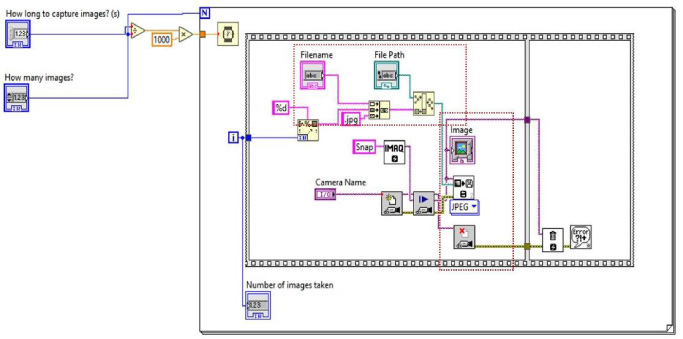
Control flow of the number of the images which could be captured, the filename and the file directory.
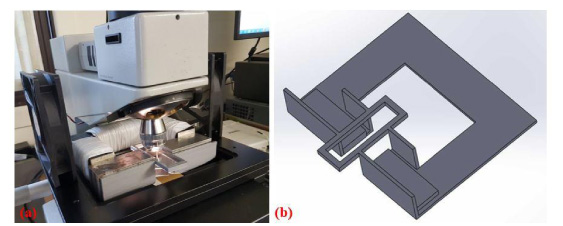
(a) The electromagnet and bracket fitted to the microscope with the pole gap and specimen slide holder located beneath the objective. (b) 3D model of the electromagnet bracket with a volume of 165 mm × 142 mm × 32 mm. 5 mm platforms are added to offset the height difference of the core caused by the copper windings.
A specific feature of the control system was the ability to choose the file directory and to create the filename (Fig. 3). In addition to this, it was considered useful for the program to increment the filename in order to distinguish the order of each image capture and also to prevent any file overwrites. Appending the file directory is achieved by the build path function that takes a path defined by the user and adds the relative filename. The output to this is wired to the IMAQ Write File 2 sub VI that saves the captured image as a user defined file type in the defined directory with the defined file name. The filename incrementation is achieved by wiring the loop indicator into an integer to string function and then added to the string concatenate function that combines this with the user defined filename. Also, LabVIEW has a variety of interface styles. The time between each image is calculated automatically for the user.
A DC electromagnet (Fig. 4(a)) was developed since a constant magnetic field was required for the nanofiller alignment process. It has been shown [5] that the desired alignment of GNPs within an epoxy resin would occur with a magnetic field strength of at least 100 mT.
An iron C-core with dimensions of 100 × 170 × 30 mm with a 110 mm gap was used with two separate I-cores with dimensions of 100 × 30 × 30 mm. The I-cores were used to enable varying of the air gap to the required size, which in this case was determined by the width of glass microscope samples. The sample slides are a standard 76.2 × 25.4 × 1 mm with the applied epoxy specimen typically having an area of 20 × 20 mm. The air gap was determined to be 30 mm to allow the slide to be positioned within the air gap.
With the maximum field and gap in the core determined, Ampere’s Law was used as a starting point for the design of the electromagnet.
It was found to be practical to select enamelled wire (diameter of 0.813 mm and maximum current rating of 11 A), with 685 turns and a maximum current limited to about 3.5 A was determined to produce 100 mT across an air gap of 30 mm without excessive heating. Thermal gradients would lead to unwanted influence on the curing behaviour of the specimen. As an additional mitigation against thermal effects, small fans were attached to the microscope in order to provide augmented cooling of the electromagnet. A 3D bracket was designed to hold the sample in the centre of the air gap (Fig. 4(b)).
As automation is a key component to the system specifically via software, the electromagnet needed to be controllable for the user. In order to conform to the previous design for image capture, LabVIEW was again used for this purpose. A Kepco Bipolar Operational Power Supply was provided with ±36 V and ±12 A output, BOP 36-12M [6]. The PSU has two modes of operation; voltage limiting mode and current limiting mode both with the ability to be either front panel adjusted or remotely programmed. In order to operate the PSU by remote control, a control potential of 0 to ±10 V must be applied to preamp B (Fig. 5) [7] to operate the output current linearly throughout the range of the PSU.
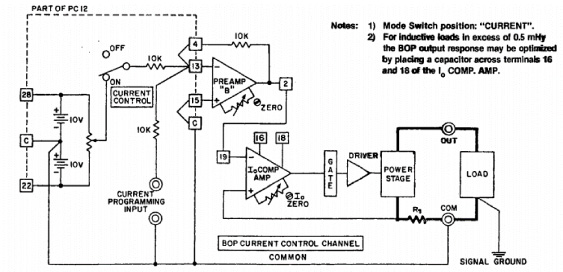
A voltage is applied to the current programming input which is in turn connected to the negative preamp terminal with the positive preamp terminal connected to common. This voltage output controls the driver and power stage [7].
As the maximum current required for the electromagnet was known to be 4 A, the potential across preamp B for the PSU was calculated by dividing the 0 to ±10 V control potential across the range of ±12 V resulting in ±1 V of control potential producing ±1.2 A. From this, 4 A was output from the PSU by applying a control potential of 3.35 V. In order for the control potential to be user determined with software, a DAC was needed in order to convert any signals produced by a PC into an analogue DC voltage. As the control software was to be designed in LabVIEW it was necessary to use an NI compatible DAC with LabVIEW support. An NI S-series 6115 data acquisition (DAQ) PCI card was installed into the resident PC. The DAQ consists of a number of DACs and Analogue to Digital Converters (ADCs) with various analogue and digital input and output (I/O) namely a nominal analogue output voltage range of 0 to ±10 V[8] controllable with NI-DAQmx, an NI VAS included driver. The output provided by this card was ideal for remote current control. The NI SCC-68 is an I/O connector block for signal connection to an NI DAQ device that consists of a breadboard area for I/O signal connections and bus terminals for power connections [9]. The connector block allowed direct access to the ports of the NI S-series 6115 data acquisition (DAQ) PCI card, specifically the analogue output terminals. By wiring the screw terminals of the connector block to the voltage control of the software controlled PSU it was possible to control the output current with a LabVIEW VI. To implement the DAQ and the connector block, NI provided the example VI Voltage On demand output.vi that allows the user to choose any installed NI-DAQmx compatible hardware that is capable of an analogue voltage output and allows direct control of the hardware. The On Demand output.vi VI allows the user to select the required magnetic field instead of the voltage to generate the necessary magnetic field and the option to adjust the minimum and maximum voltages was removed. Using this system the user can avoid any mistakes or extra steps by allowing only the magnetic field strength to be selected.
In order to check the operation of the system, the magnetic assembly of the iron-coated GNPs into the epoxy matrix was investigated. Figure 3 shows the magnetic response of the 1% wt. magnetic graphene-fillers (GNPs@MNPs) in different period times over the curing process. Within a very short time (10 min), significant alignment is observed (Fig. 6(b)) in the field direction comparing with the random dispersed fillers (Fig. 6(a)). However, there is little difference between the images of 60 min and 120 min (Fig. 6(c), (d)), indicating that most alignment occurs within one hour with any changes during the remaining time negligible.
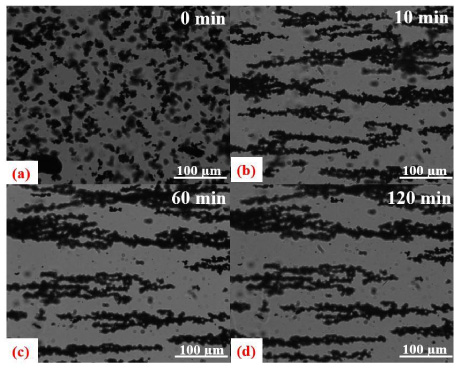
(a) The random dispersion of the magnetic GNPs before the application of the magnetic field (b) after ten minutes it is clear that the magnetic GNPs have been responded to the magnetic field. (c) At sixty minutes, the alignment of the magnetic clusters seems to be stable into the epoxy matrix. (d) After two hours any alignment or changes to the epoxy and GNPs is negligible.
An automated image capture and magnetic control system was developed in order to understand better the alignment conditions of iron oxide-based graphene nanosheets exposed to a low magnetic field, which will assist in enabling scalable manufacturing of tailored nanocomposites through active assembly of nanofillers. The automatic imaging system provided a user controllable method for obtaining images of the samples through the curing period and also the electromagnet was capable of producing a minimum of 100 mT across the sample for the whole experiment, resulting in a comprehensive analysis tool for the magnetic alignment of the GNPs within an epoxy resin, and allowing a more detailed analysis with a potential one second resolution over the time of the curing period of the epoxy resin. Further studies are planned to examine the GNP loading, field strength and time with the aim to identify the optimum conditions for alignment of GNP clusters in the cured material.