
Abstract
Due to the poor conversion efficiency and signal-to-noise ratio (SNR) of Electromagnetic Acoustic Transducer (EMAT) testing, the defect detection sensitivity is limited, which restricts the extensive industrial applications. A finite element model for the testing process of a meander-coil EMAT was established that considers the simplified excitation and detection circuits for the EMAT. Based on this model, the effect of the connection methods (parallel or series) of the coils in the generating and receiving EMATs on their generating and receiving efficiency was investigated, and the simulation results were validated experimentally. Subsequently, the pulse compression technique with a 13-bit Barker code was used for the EMAT detection, and improvements of the SNR and range resolution were established through numerical simulation and experimental measurement. The results show that compared with the traditional EMAT design, which comprises single-layer transmitting and receiving coils, the conversion efficiency of the optimized EMAT with two excitation and receiving coils in the parallel connection can be improved by 52.8%. With the application of the Barker-coded pulse compression to detect the ultrasonic A-scan signal with no synchronous average, the SNR of the defect echo can be improved by 9.5 dB compared with the A-scan signal with 128 synchronous averages.
Introduction
The Electromagnetic Acoustic Transducer (EMAT) has the advantages of non-contact detection, rapid operation, long-range inspection, and producing different types of ultrasonic waves, so it is particularly desirable for measurements under on-line or hostile environmental conditions [1]. In nondestructive testing, EMATs provide a useful and perspective technique as they can be used at a certain liftoff on a hot and rusted surface [2]. EMATs are widely used in high-temperature testing and on-line inspection. They can generate and receive ultrasonic waves via Lorentz forces and the magnetostriction effect. By simply changing the coil and magnet geometry, EMATs can generate different ultrasonic wave modes, such as SH waves, angle-beam shear-vertical (SV) waves, focused surface waves, and bulk waves. However, a major drawback to EMATs is their relatively poor signal-to-noise ratio (SNR), originating from the inherent inefficiency of the transduction effect in both the transmitter and receiver EMATs [3].
Several researchers have suggested methods for improving the conversion efficiency and SNR of EMATs, and EMATs should be carefully designed to maximize sensitivity. First, the static magnetic field can be arranged optimally to increase the local magnetic flux density in the EMAT active area [2]. For example, K. Mirkhani and C. Chaggares, et al. [3] investigated the effects of varying the magnet-to-coil width ratio for a racetrack-coil EMAT. B. Dutton and S. Boonsang, et al. [4] provided a different magnetic configuration comprising two square permanent magnets, and compared it with a conventional single-disk permanent magnet. R. Dhayalan and V. Satya, et al. [5] introduced an effective method for improving the signal amplitude from a meander-line EMAT using a ribbon soft magnetic flux concentrator.
Second, finite element and numerical analysis methods have been used to investigate the effect of the EMAT parameters on the conversion efficiency. For example, S.J. Wang and L. Kang, et al. [6] established a 3D model for a meander-line-coil surface-wave EMAT, combining their numerical calculations and analytical solutions with focus on the influence of the dynamic magnetic field. L. Kang and S. Dixon, et al. [7] established a 3D finite element model for the transmission process of a surface-wave EMAT, and used the orthogonal test method to investigate the effect of changing various EMAT parameters on the amplitude of the surface wave. Y.G. Wang and X.J. Wang, et al. [8] studied the transduction process of a PPM EMAT based on the 3D finite element method. W.Z. Shi and Y.X. Wu, et al. [6,9] built a circuit-field coupled finite element model for a spiral-coil EMAT. Based on this model, the conversion efficiency and liftoff sensitivity of the EMAT could be improved.
Finally, some advanced signal processing techniques have been proven effective methods for improving the SNR. For example, S. Legendre and D. Massicotte, et al. [10] used a wavelet transform algorithm to extract the required time information from a received Lamb-wave ultrasonic nondestructive evaluation signal. This multiscale method of signal analysis is particularly suitable for the peak detection problem. K.S. Ho and T.H. Gan, et al. [11] introduced wide-bandwidth EMATs and pulse-compression signal processing techniques for thickness measurement and imaging of metallic plates, which greatly improved the SNR and increased the detection speed. J. Isla and F. Cegla [12] presented a new approach of coded excitation whereby receive intervals or pauses were introduced within the excitation itself, and reception occurred in these intervals. Thus, the length of the coded excitation was not limited by the distance between the closed reflector and the transmitter/receiver. S.Q. Zhang and X.Q. Zhou, et al. [13] proposed a processing method based on coded excitation and pulse compression to improve the SNR of magneto-acoustic imaging, which could be improved by 21.5 dB. For a similar SNR improvement, the processing time of the coded excitation method can be shortened by 95.8% compared with the single-pulse excitation method. D. Si and B. Gao, et al. [14] proposed a modified variational mode decomposition linked wavelet method for EMAT denoising. This method not only removed the noise, but also preserved the information of defects. W.Z. Shi and W.W. Chen, et al. [15] used chirp pulse compression to process a raw ultrasonic signal from an EMAT tested with the forgings at different temperatures from 92 to 730 °C. Among these signal processing techniques, pulse compression is widely used in radar signal processing, while the Barker code sequence is mostly adopted in phase-coded pulse compression for its low sidelobe level [16]. Pulse compression can improve both the SNR and the axial resolution [13]. When the Barker-code pulse compression technique is applied to an EMAT detection system, both the SNR and range resolution of the ultrasonic echoes can be improved, which is particularly necessary for EMAT application.
Furthermore, Rayleigh waves are of particular interest in the field of nondestructive evaluation, and they are specifically sensitive to surface or near-surface defects [17]. Surface EMATs, most often termed meander-coil EMATs, have been described previously in the literature. Depending on the excitation frequency, meander coil periodicity, and sample thickness, meander-coil EMATs can generate Lamb or surface waves [18]. C.B. Thring and Y. Fan, et al. [19] proposed a focused Rayleigh wave EMAT with high-resolution surface-breaking defect sizing and detection, and the real defect in an aluminum billet sample could be detected. Recently, a phased Rayleigh wave EMAT array was investigated and developed using analytical and finite element models together with experimental measurements, and a defect with the width and depth of 0.2 and 0.8 mm, respectively, could be detected [17,20,21].
The equivalent impedance of the EMAT coil is also an important factor that should be considered when designing the EMAT geometric parameters [22]. For most pulse generators, the maximum output power or voltage is limited, so the excitation current may be affected by the impedance of the coil. Regarding the receiving circuit of an EMAT, the input voltage from a preamplifier is influenced by the EMAT coil impedance. Additionally, the equivalent impedance of the EMAT coil is determined by its geometric parameters. Some researchers have proposed that the number of coils could be increased to increase the conversion efficiency of EMATs [23]. However, the effect of the connection methods (parallel or series) of the coils in an EMAT on the EMAT conversion efficiency should be considered. When the connection method of the EMAT coils is optimal, the EMAT conversion efficiency can be enhanced.
This paper provides some methods for improving the conversion efficiency and SNR of the meander-coil EMAT. Finite element simulations and experimental measurements were conducted to investigate the effect of the connection method of the EMAT coils on the generating and receiving efficiency of a surface-wave EMAT. In addition, the Barker-coded pulse compression technique was used in the surface-wave EMAT testing. The advantages of this technique in improving the SNR and the range resolution were also analyzed via the numerical simulations and experimental verification.
Modeling of meander-coil Electromagnetic Acoustic Transducer (EMAT)
Configuration of meander-coil EMAT
The EMAT mostly comprises three parts, namely: a coil, a permanent magnet or electromagnet, and a testing metal. For nonferromagnetic materials, only the Lorentz force mechanism contributes to the generation and receiving of ultrasonic waves. However, for ferromagnetic materials, ultrasonic waves can be used in the inspection via three mechanisms, specifically: Lorentz force, magnetization force, and magnetostriction effect [24]. Figure 1 shows the configuration of a meander-coil EMAT based on the Lorentz force mechanism. When the meander coil is excited with radiofrequency (RF) current with a large amplitude, an induced current can occur in the testing specimen. With the existence of the static magnetic field provided by the permanent magnet, Lorentz forces are induced in the skin depth of the testing specimen, and then a Rayleigh wave is produced that travels along the surface of the specimen. Simultaneously, the longitudinal wave and SV wave travel obliquely into the specimen.

Configuration and Lorentz force mechanism of a meander-coil Electromagnetic Acoustic Transducer (EMAT).
To investigate the effects of the EMAT parameters on the generation efficiency and detection efficiency, the bias magnetic field provided by the magnet, the induced current generated in the specimen surface in the EMAT transmitter, and the open-circuit voltage received by the EMAT detector can be modeled via the finite element method (FEM) using the differential equations. The bias magnetic field provided by the magnet can be solved by the following equations [5,25]. A magnetic scalar potential φ
m
is defined by [25]:
Using Maxwell’s equations, the magnetic flux density
Equations (1) and (2) can be linked by the relation [25]:
The induced current density
An ultrasonic wave propagating in the testing sample can be solved using [27]:
The open-circuit voltage
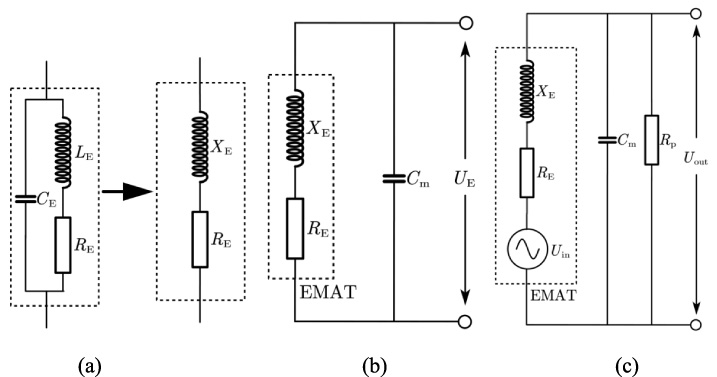
Equivalent excitation and detection circuits for the EMAT: (a) Equivalent impedance of the EMAT coil; (b) Excitation circuit; (c) Detection circuit.
For the system of the coil and specimen, the capacitance (C
E
) value is very small and can be neglected [29]. Figure 2(a) shows the simplified equivalent circuit for this system. Thus, the equivalent impedance of the EMAT coil can be viewed as a resistance (R
E
) and an inductance (L
E
). X
E
can be calculated by: X
E
= jωL
E
, where ω = 2πf is the angular frequency. Then, the equivalent impedance of the EMAT coil can be given by: Z
E
= R
E
+ jX
E
. Figure 2(b) shows the equivalent excitation circuit for the EMAT, including Z
E
of the EMAT coil, a matching capacitance (C
m
), and the excitation voltage (U
E
) of a pulse generator. C
m
can be calculated by:
Finite element model of the meander-coil EMAT
The process of generating and detecting surface waves for a meander-coil EMAT was solved in commercial software using the finite element method. A 2D finite element model was built for the meander-coil EMAT to simplify the numerical model and reduce the computation time. Figure 3 illustrates the specified meander-coil EMAT with a double-layer meander coil, and each conductor has four wires. To remove the ultrasonic noise produced in the magnet, a copper backplate is placed below the magnet, and its width is equal to that of the magnet.

Structure of a double-layer and multi-splitting meander-coil EMAT.
The dimensions and properties of the meander-coil EMAT used in the simulations and experiments are listed in Tables 1 and 2. The residual magnetic strength of the Nd–Fe–B magnet is 1.2 T. The excitation frequency is 1 MHz, and the main ultrasonic wave is the Rayleigh wave.
Material properties
Dimensions of the EMAT

Finite element model of the meander-coil EMAT.
Figure 4 shows a 2D finite element model for the process of testing for the meander-coil EMAT. We conducted the model generation and simulation (including the equivalent circuits for the EMAT excitation and detection system) analysis using a commercial finite element software. The maximum sizes of free triangular meshing elements for the specimen, magnet, coil, and air regions were respectively 0.16, 0.5, 0.001, and 2 mm. The maximum computing timestep was 0.01 μs, and a consistent result for the simulation could be reached. The previous study [30] stated that at least 7 elements per wavelength were needed. To comply with this criterion, around 20 elements per wavelength were chosen in this work; thus, the maximum size of meshing elements for the specimen was 0.16 mm. To resolve the current density in the conductor of the meander coil accurately, considering the skin-depth of the conductor, the meshing element size of the conductor should be finer; here, the maximum size for the coil was 0.001 mm. To achieve errors lower than 1%, nine elements across 3 times the skin depth in the specimen surface were chosen, and the “element growth rate” was set to 1.2 for avoiding abrupt changes in the mesh density of the different regions [30]. The computation accuracy of the static and dynamic magnetic field is affected by the size of the air region, but enlarging the air region will cost more computation time; therefore, an infinite element domain surrounding the air region was added to the model. The radial thickness of the infinite element domain is 10 mm, which guarantees the simulation time and calculation accuracy.
Figure 5(a) illustrates the EMAT coils with double-layer configuration, which comprise rectangular meander copper traces on a polyimide film. The copper traces lie on both faces of the substrates. The two coils on the left are used for generating surface waves, while the other two coils are used for receiving waves. All the transmitting coils or detection coils can be jointed in two connections, namely: parallel (Fig. 5(b)) and series (Fig. 5(c)).

Structures and connections of double-layer and multi-splitting meander coils: (a) Side view of the coils; (b) Parallel connection; (c) Series connection.
The transient excitation current passing the k-th conductor of the meander coil is given as:
Meander-coil EMAT probe
Figure 6 shows the developed meander-coil EMAT, with the detection and transmitting coils built within. The double-layer and multi-splitting coil was produced using a flexible printed circuit board (PCB) technique, and most of the developed EMAT parameters were the same as those in the simulation model, as listed in Table 2. In addition, the length and width of the multi-splitting coil were 92 and 20 mm, respectively. Two multi-splitting coils were located on both faces of the substrates. The two coils on the left and right sides of the flexible PCB coil are used respectively for generating and receiving surface waves. To suppress the electromagnetic noise from the RF power generator and shorten the dead zone caused by the main bang, the center distance between the generating and receiving coils was 29 mm. An Nd–Fe–B permanent magnet of 25-mm thick, 40-mm wide, and 80-mm long was used in the EMAT probe. A 0.1-mm-thick copper foil was placed between the two generating coils and the magnet to reduce the ultrasound generation in the magnet surface. The width and length of the foil were the same as those of the single multi-splitting coil. The EMAT was housed in a stainless-steel casing to suppress the electromagnetic noise in the environment, as well as to protect the EMAT during detection. As shown in Fig. 6, the thickness, height, width, and length of the steel casing were respectively 5, 60, 50, and 100 mm. Six ball bearings were installed in the stainless-steel casing, and the EMAT liftoff was 0.5 mm, so the EMAT probe could move freely during measurement.

Developed meander-coil EMAT and flexible PCB coil.
Figure 7 shows a diagram of the experimental setup. The signal generator and RF power generator are used to generate a high current pulse for the transmitting EMAT coils, and with the help of Lorentz forces, surface waves can be produced that propagate in the structural steel surface. A transmitting pulse of a sinusoidal tone burst signal or Barker code signal can be generated by the signal generator. The preamplifier had an input impedance of 1 KΩ, bandpass filter operating at the 0.1–2-MHz frequency band, and gain of 60 dB. The impedance matching network between the RF power amplifier and the transmitting EMAT coil helps to increase the excitation current, and that in the EMAT detecting system is used to maximize transfer efficiency between the detection EMAT coil and the preamplifier. Thus, the SNR can be improved by the two impedance matching networks. Ultrasonic signals can be recorded in the data acquisition card, and post-processed and archived by a computer.

Diagram of the experimental setup.
Two testing blocks (block 1# and block 2#) were prepared for the experimental measurements, pictures of which are shown in Fig. 8 along with the EMAT probe. Both blocks are made of 0.45% carbon steel. Block 1# is 120-mm wide, 600-mm long, and 60-mm thick, while block 2# is 350-mm wide, 600-mm long, and 35-mm thick. Block 1# was used for testing the generating and receiving efficiency of the EMAT with parallel or series connections. We also manufactured a slit defect with the length of 10 mm, width of 1 mm, and depth of 2 mm in block 2#, and this block was used for verifying the detection capability of the EMAT probe with Barker-code pulse compression technique. The same EMAT probe described in Fig. 6 was used for testing with the two blocks.

Two blocks used as testing specimens in the experiments.
Finite element calculated results
Figure 9 shows the components B sx and B sy of the static magnetic field at the depth of 1 mm from the permanent magnet upper surface; the magnet dimensions are given in Table 2. It can be observed that the predicted magnetic field corresponds with the experimental measurements using the teslameter.

Calculated and measured static magnetic flux density at the depth of 1 mm from the permanent magnet upper surface along the X direction.
The calculated ultrasonic waves for different times excited by the meander-coil EMAT are shown in Fig. 10, considering the Lorentz forces due to the self-induced magnetic field. It can be observed that not only Rayleigh (R) waves, but also SV and longitudinal (L) waves were simultaneously generated, and the amplitude of the R-wave was larger than that of the SV wave.

Propagation of ultrasonic waves in a steel specimen.
The distributions of the eddy current and Lorentz force on the steel sample along segment AB (Fig. 3) for the transmitting EMAT with a single-layer coil and the excitation current of 10 A are presented in Fig. 11. B sx , B sy , B dx , and B dy were assumed as the components of B s and B d in the X and Y directions, respectively. Figure 11(a) shows that B sx , B sy , and B dx significantly contribute in providing the bias magnetic field for the transmitting EMAT with a negligible B dy . Meanwhile, f Lsx , f Lsy , f Ldx , and f Ldy are respectively defined as the components of f Ls and f Ld in the X and Y directions. As shown in Fig. 11(b), both the directions of f Ls contribute in generating surface waves, and f Ld mainly acts in the Y direction. The Lorentz force f Ldy produced by the interaction of J iz and B dx strongly affects the production of ultrasonic waves.

(a) Magnetic field and (b) Lorentz force along segment AB.
Ultrasonic wave propagation was generated by the Lorentz force due to the static magnetic field and the dynamic magnetic field, as in Fig. 12. Figure 12(a) shows that the Lorentz force f Ls mainly generates R waves, together with a few SV and L waves. However, from Fig. 12(b), the force due to f Ld primarily contributes in producing angled ultrasonic waves with a few R waves, and the frequency content of R waves due to f Ld is twice that due to f Ls . Furthermore, the use of an impedance matching network in the EMAT system and the structural parameters of the receiving EMAT, the R wave due to f Ld with a double frequency could not be efficiently received. Therefore, only the R wave due to f Ls is discussed here.

Displacement distribution and propagation of ultrasonic waves at 8.9 μs generated by Lorentz force due to (a) static magnetic field and (b) self-induced magnetic field.
Figure 13 shows the effect of the three kinds of meander coil on the generation efficiency of the transmitting EMAT. Figure 13(a) depicts the typical induced voltage when the receiving EMAT with a single-layer coil was used. Echoes “A” and “B” represent the surface waves upon reflection from the left and the right surfaces of the specimen, respectively.
As shown in Fig. 13(b), the generation efficiency of the transmitting EMAT with double-layer coils in the series connection is larger than that with double-layer coils in the parallel connection when the amplitude of the excitation current is 1 A. An impedance analyzer E5061A was used to measure the meander coils, and the impedance for the single-layer coil was (37.6+47.6j) Ω, and those for the double-layer coils with parallel connection and series connection are (20.7+40.5j) Ω and (125.9+177.5j) Ω, respectively. As in Fig. 13(c), when the transmitting coil was driven by the limited voltage source, the transmitting EMAT with double-layer coils in the parallel connection exhibited the largest generation efficiency. Moreover, as shown in Fig. 13(c), parallel connection > single layer > series connection. The driven current was derived from the equivalent circuit according to Fig. 2(b). For most class-AB or class-D pulse generators in the EMAT system, the maximum output voltage was limited. Thus, the generation efficiency of the EMAT should be considered according to the stronger eddy current or higher amplitude signal and the equivalent impedance of the EMAT coil.

Influence of the three kinds of meander coils in the transmitting EMAT on the induced voltage from the same EMAT receiving coil: (a) Induced voltage with a single-layer coil; Echo “B” when the transmitting coil was driven with (b) current having amplitude of 1 A and (c) pulse generator having the output voltage (U E ) of 700 V. The distance between the upper-side coil and the down-side coil was 0.2 mm.
Figure 14 shows the effect of the three kinds of meander coil on the generation efficiency of the receiving EMAT, and Fig. 14(a) depicts echo “B” from the single-layer coil and the up-side and down-side coils of the double-layer coil in the receiving EMAT. As in Fig. 14(a), the existence of the up-side coil has little effect on the induced voltage from the down-side coil. Thus, the induced voltages from the single-layer coil and the down-side coil in the double-layer coil are nearly the same. We can also observe that as the distance between the coil and the specimen is increased, a reduced voltage is induced. Thus, the voltage from the up-side coil is less than that from the down-side coil. This reduction may also contribute to the shielding effect of the down-side coil.
The influence of the connection methods (single-layer, series, and parallel connection) on the induced voltage from the receiving EMAT and the input voltage from the pre-amplifier is shown in Fig. 14(b). It can be seen here that the receiving EMAT with double-layer coils in parallel connection exhibits the largest generation efficiency, and parallel connection > series connection > single layer. The induced voltage from the double-layer coils in parallel and series connections is larger than that from the single-layer coil, but the ratio of the equivalent impedance (Z E ) of the EMAT coil to the input resistance (R p ) of the pre-amplifier may also affect the output gain (G = U out ∕U in ) of the preamplifier. Thus, the changing trend of the induced voltage from the receiving EMAT is not consistent with the trend of the input voltage of the pre-amplifier.

Influence of the three kinds of meander coils in the receiving EMAT on the induced voltage (U in ) and input voltage (U out ) of the pre-amplifier when the same generating EMAT was used: (a) Echo “B” from the single-layer coil and the up-side and down-side coils of the double-layer coil in the receiving EMAT; (b) Amplitude of echo “B” from the induced voltage from the receiving EMAT and the input voltage of the pre-amplitude. The two coils in the generating EMAT were in parallel connection, and the excitation current was 1 A. The distance between the up-side coil and the down-side coil in both the generating and receiving EMATs was 0.2 mm.
Some experiments were also conducted to verify the simulational results referring to the influence of the parallel and series connections of the EMAT coils, and were performed with Block 1# (shown in Fig. 8). Figure 15 shows a comparison between the optimized EMAT and the traditional one. In the traditional EMAT, the transmitting and receiving coils are of single-layer, while for the optimized EMAT, the two transmitting coils are in parallel connection and the two receiving coils are in parallel connection. Compared with the traditional EMAT, the conversion efficiency of the optimized EMAT can be enhanced by 52.8%.

Experimental A-scan ultrasonic signals from the EMATs having (a) transmitting and receiving coils of single-layer, and (b) two transmitting coils in parallel connection and two receiving coils in parallel connection. The dimensions of the meander coil are listed in Table 2, and the EMAT probe was tested with block 1#.
When the transmitting and receiving coils in the EMAT are in parallel or series, the amplitudes of the ultrasonic echo from the slit are quite different, and Table 3 shows this variation. As can be seen here (rows 1, 2, and 3), the defect echoes of the two receiving coils in parallel and series connections are larger than those of the single-layer receiving coil. Further, from Table 3 (rows 2, 3, 6, and 7), regarding the receiving coils of the EMAT, the benefits of the parallel and series connections are nearly the same. We can also find in Table 3 (rows 1, 4, and 5) that for the EMAT’s transmitting coils, the echo from the coils with series connection is less than that from the single-layer coil, and the echo from the coils with parallel connection is the largest.
Effect of the connection mode of the transmitting and receiving coils in the EMAT on the amplitude of the received ultrasonic signal. The dimensions of the meander coil are listed in Table 2
As in Fig. 13(c), Fig. 14(b), Fig. 15, and Table 3, both the simulation result and experimental measurements reveal that when the two transmitting coils of the EMAT are in parallel connection, the generation efficiency is the largest, and this conclusion is still valid for the two receiving coils in the EMAT. However, the conclusion is valid only for the EMAT parameters provided in Table 2. Moreover, when more than two transmitting or receiving coils are used in the EMAT, this conclusion may not be true. As the number of transmitting or receiving coils is increased, the magnet-to-specimen distance is also increased, and the conversion efficiency of the EMAT will be reduced. Additionally, there may be a larger impedance mismatch between the EMAT coil and the RF power generator or preamplifier, and the existing impedance matching network cannot meet the requirement.
Barker-coded pulse compression
Barker-coded pulse compression is a useful way for improving the SNR and range resolution of the detected ultrasonic signal, and this technique is especially required in EMAT detection. The compression ratio is proportional to the length of the code, and a typical 13-bit Barker code binary phase sequence C
k
is
We used a sinusoidal sub-pulse with the center frequency of 1 MHz and duration of 5 μs as an element of the 13-bit Barker code sequence, and the excitation sequence was used to excite the EMAT. Figure 16 shows the excitation waveform. As shown in Fig. 16, the packet width of the excitation signal is 65 μs.

13-bit Barker code sequence with sinusoidal sub-pulse.

Calculated induced voltage signal and pulse compressed signal when a 13-bit Barker code sequence with sinusoidal sub-pulse was used as the excitation. The sinusoidal sub-pulse has the frequency of 1 MHz and duration of 5 μs: (a) Original induced voltage signal; (b) Pulse compressed signal without sidelobe reduction; (c) Pulse compressed signal with sidelobe reduction.
When the meander coil EMAT is excited by the phase-coded signal u[m], a received voltage s[m], representing the ultrasonic waves, can be obtained by the EMAT. Cross-correlation between the received signal and the chirp signal can be carried out using [13]:
To avoid the sidelobes in the pulse compressed signal, the mismatched filter for Barker code was applied based on the lowest peak sidelobe level (PSL), which is given by:
Figure 17 shows the simulated induced voltage signal and the pulse compressed signal from the EMAT receiving coil under Barker-coded excitation. Compared with the original signal given in Fig. 17(a), Fig. 17(b) shows that the packet width of the compressed signal was reduced to 18 μs, and the peak of the wave packet has been largely improved. Figure 17(b) and Fig. 17(c) depict that the peak of the sidelobes is weakened when the sidelobe reduction according to Eq. (17) is used, and the PSL is increased from 22.05 to 60.51 dB. We found that the range resolution and the SNR are effectively increased when the Barker-coded pulse compression is used.
Figure 18 shows the two groups of curves: the coded induced voltage signal and the compressed signal after sidelobe reduction with the different noise levels. Figure 18(a) and (b) present the two curves with 20% white noise, while Fig. 18(c) and (d) show those with 40% white noise. Figure 18(e) and (f) present the curves with 60% white noise; Fig. 18(g) and (h) display those with 80% white noise. It can be seen from the simulated signal in Fig. 18(a), (c), (e), and (g) that with increasing white noise, the coded induced voltage is affected by the noise, and the induced voltage is submerged in the noise. Furthermore, it can be seen from Fig. 18(b), (d), (f), and (h) that after pulse compression and sidelobe reduction, the noise is suppressed. The results show that the pulse compression method can suppress noise, as well as improve the SNR. Figure 18(a) and (b) show that the SNR of the transmission wave can be improved by 18 dB after pulse compression and sidelobe reduction.

Simulated induced voltage signal with different noise levels and the pulse compressed signal after sidelobe reduction when a 13-bit Barker code sequence with sinusoidal sub-pulse was used as the excitation: (a) Coded induced voltage signal with 20% white noise; (b) Compressed signal of (a); (c) Coded induced voltage signal with 40% white noise; (d) Compressed signal of (c); (e) Coded induced voltage signal with 60% white noise; (f) Compressed signal of (e); (g) Coded induced voltage signal with 80% white noise; (h) Compressed signal of (g).

Diagram of the EMAT probe on the steel block surface illustrating their positioning and the propagation paths.

Experimental A-scan ultrasonic signals when (a) 128, (b) 8, and (c) no synchronous averages were used. The optimal EMAT with the two generating coils in parallel connection and the two receiving coils in parallel connection was used, and detection was performed with block 2#.
The positions of the EMAT probes and the propagation paths of the surface waves are illustrated in Fig. 19, and the generated surface waves propagated around the block surface in right and left directions. Figure 20 shows the experimental A-scan ultrasonic signals when different synchronous averages were used; these experiments were performed using block 2# with a slit (shown in Fig. 8). Here, we used the optimized EMAT with the two generating coils in parallel connection and the two receiving coils also in parallel connection. Figure 20(a) shows the received ultrasonic signal with 128 synchronous averages, and the propagation paths of the wave packets “A”, “B”, “C”, and “D” are noted in Fig. 19. Wave packet “C” is the ultrasonic echo reflected by the slit defect with the length of 10 mm, depth of 2 mm, and width of 1 mm. As shown in Fig. 20, compared with the SNR of the defect echo with no synchronous average, the SNRs of the defect echoes with 8 and 128 synchronous averages can be improved by 9.6 and 18.8 dB, respectively. In particular, synchronous averaging is an effective way of improving the SNR of the EMAT. However, long waiting periods are required for the signal to die out in-between subsequent transmissions, and the duty cycle of the power generator for the EMAT is limited. Thus, the number of synchronous averages cannot be significantly increased.

(a) Reference signal, (b) raw ultrasonic wave signal without synchronous average, and (c) pulse compressed signal when the 13-bit Barker-coded pulse compression technique was used. The sinusoidal sub-pulse has the frequency of 1 MHz and duration of 5 μs. The optimal EMAT with the two generating coils in parallel connection and the two receiving coils in parallel connection was used, and the detection was performed with block 2#.
Figure 21 shows the reference signal, raw ultrasonic wave signal without synchronous average, and the pulse compressed signal when 13-bit Barker-coded pulse was used as the excitation for the generating EMAT, and the sinusoidal sub-pulse has the frequency of 1 MHz and duration of 5 μs. Figure 21(b) and Fig. 21(c) show that after pulse compression and sidelobe reduction to the raw ultrasonic wave signal without synchronous average, the width of the wave packet (range resolution) and the SNR largely improved. As shown in Fig. 20(a) and Fig. 21(c), the width of the defect echo packet was approximately 12 μs, and the SNR of the defect echo could be increased by 9.5 dB compared with the SNR of the defect echo processed by 128 synchronous averages. Due to the ring-down from the main bang, the wave packets “A” and “B” cannot be successfully observed. If the EMAT probe and the EMAT detection experimental system are optimally designed, this problem can be solved. Thus, we can conclude that the Barker-coded pulse compression technique can help to improve the SNR without the sacrificing the range resolution compared with the signal procession method of synchronous averaging.
We can concluded from Fig. 18 and Fig. 20 that both the Barker-coded pulse compression technique and synchronous averaging can be used to remove electromagnetic noise from the detection environment. A considerable SNR can be achieved using the Barker-coded pulse compression technique to the non-averaged ultrasonic signal compared with 128 synchronous averages, and hence, the detection efficiency can be improved, which is particularly desired in high-temperature detection and on-line inspection [15]. We also realized the drawback of the Barker-coded pulse compression technique when comparing Fig. 20 and Fig. 21, this is a dead-zone in detection caused by the ring-down from the main bang. The dead-zone generated by the Barker-coded pulse compression technique is larger than that in the traditional excitation method with a tone-burst pulse. Thus, the defect near the EMAT probe may not be detected with Barker-coded pulse compression. Moreover, the central disadvantage of this technique is that the length of the coded excitation or sequence is limited by the distance between the closest reflector and the transmitter/receiver [12].
This paper provides some methods for improving the detection sensitivity of a surface wave EMAT. One is the selection of the connection methods of the coils used in the generation and receiving EMATs, and the other is the application of the Barker-coded pulse compression technique.
When optimizing the EMAT parameters, it is better to consider the equivalent impedance of the EMAT coil. This is because the equivalent impedance of the EMAT coil affects the power distribution of the excitation circuit and receiving circuit, and the EMAT coil impedance is related to the geometric parameter of the EMAT and the testing object.
For the given EMAT design parameters, the transmitting EMAT with double-layer coils in parallel connection exhibits the largest generation efficiency, and according to the conversion efficiency, parallel connection > single layer > series connection. Further, the receiving EMAT with double-layer coils in parallel connection presents the largest generation efficiency, and parallel connection > series connection > single layer. When the two coils in the generating and receiving EMATs are in parallel connection, the conversion efficiency can be improved by 52.8%. However, a different EMAT design will have different connection methods for the peak conversion efficiency, and the connection methods will be varied with the number of coils used in the EMAT. Choosing an appropriate connection method may be a good suggestion for improving the EMAT conversion efficiency.
Meanwhile, the Barker-coded pulse compression technique is an effective method for improving the SNR and the range resolution. The SNR can be improved by extending the duration of the excitation pulse. In this paper, for the slit with the length of 10 mm, width of 1 mm, and depth of 2 mm, the SNR of the defect echo can reach 29.5 dB, improved by 9.5 dB compared with the raw ultrasonic signal wave with 128 synchronous averages. However, due to the ring-down from the main bang, some wave packets could not be successfully observed. More efforts should be explored in the future to solve this problem.
Footnotes
Funding
This research was supported by the Equipment Pre-research Fund Project (grant number: 6140004030116JB91001).