



Abstract
BACKGROUND:
The sweetness of highbush blueberries (Vaccinium corymbosum L.) is related to changes in sucrose and other primary sugar metabolites.
OBJECTIVE:
This study compared the fruit quality and sugar metabolism in the blueberry cultivars Brigitta and Elizabeth at three ripening stages and with a postharvest chitosan treatment to determine which factors are important in sugar metabolism in the two cultivars.
METHODS:
Blueberries were harvested at three ripening stages. Fully ripe fruit was treated with chitosan and kept at room temperature for 5 and 10 days. GC-MS was used to measure organic acids, individual sugars, and sugar derivatives. Gene expression was analysed using qPCR.
RESULTS:
Elizabeth fruit was less firm than Brigitta fruit, but contained more soluble solids. The sweeter taste of Elizabeth versus Brigitta was due to down-regulated VcINV, VcSPS, and VcADR transcription and increased sucrose concentration. Chitosan inhibited VcADR and VcINV transcription in Elizabeth, but activated these genes in Brigitta after 5 days of storage.
CONCLUSIONS:
Aldose reductase might be an essential enzyme in blueberry sugar metabolism. These findings support research on the mechanism of sugar accumulation in fruit during maturation and after postharvest treatments in blueberries.
Introduction
Northern highbush blueberries (Vaccinium corymbosum L.) are tasty fruit that are popular with consumers [1]. The taste of the fruit is related to the balance between acid and sugar [2]. As with other fruit, producers and researchers are interested in the flavours and metabolite compositions of blueberries because the sweetness of the fruit is not always related to the sugar content [3]. Sugar accumulation in blueberries depends on the cultivar, ripening, and storage conditions [2, 4]. The optimum cultivars determine the sensory quality of fruit [2].
During sugar metabolism in fruit maturation, the conversion of sucrose to glucose, mannose, and fructose and their derivatives is complex and differs among fruit. In blueberries, the principal enzymes involved in sugar accumulation during fruit maturation include invertase (INV) and sucrose-phosphate synthase (SPS) [4, 5]. The inhibition of VcSPS and VcINV affects sugar biosynthesis [4]. Soluble acid INV activity negatively correlates with the fruit sucrose concentration in blueberries [6]. The aldose reductase gene in the aldo-keto reductase (AKR) superfamily also uses sugar during the metabolic process [7, 8]. In peaches, PpAKR1 mRNA increased with abscisic acid, oxidative stress, and cold and salt stress treatments [9]. However, aldose reductase has not been investigated in blueberries.
Sugar is metabolised in blueberries during ripening and after postharvest treatments. Exogenous ethylene induces sucrose metabolism by inhibiting the expression of SPS [5]. Chitosan is used to treat fresh fruit and vegetables after harvest [10] to inhibit microbial growth and reduce postharvest diseases [11–14]. In longan fruit, chitosan treatment induces greater pulp total soluble sugar, sucrose, and total solids [15]. In harvested sweet cherries, chitosan delays the increase in total soluble sugar [16]. In blueberries, chitosan is applied as an undercoat or a chitosan-based edible coating containing nano-sized titanium dioxide particles [17] or acid-soluble chitosan [13]. However, few studies have examined sugar accumulation in fresh blueberries after chitosan treatment.
This study investigated the sugar metabolism in the blueberry cultivars Brigitta and Elizabeth by analysing the fruit quality, sugars, and acids, and the expression of the VcADR, VcSPS, and VcINV genes during ripening and after chitosan treatment. The results suggest the need for further studies on primary metabolite mechanisms in fruit during maturation and the effects of chitosan treatments on the postharvest quality of blueberries.
Materials and methods
Fruit materials and chitosan treatment
The blueberry cultivars Brigitta and Elizabeth were grown in the same greenhouse, under the same conditions in an organic farm in Gyeonggi Province, South Korea. Berries were harvested three times, on July 7, 14, and 21, 2021, selecting fruit of similar size and colour at three ripening stages: S5, green; S7, pink; and S8, dark blue [18, 19] (Supplementary Figure 1). Chitosan treatments were applied only to dark blue blueberries (S8). Berries were immersed in a solution produced by dissolving 3 g chitosan powder (CAS 9012-76-4; Sigma Aldrich, St. Louis, MO, USA) in 1 L distilled water containing 1% glacial acetic acid to give a pH of about 4.0 [20]. After 5 min, treated samples and untreated controls were dried overnight at room temperature (20∼22°C). Berries were stored in polyethylene containers covered with polyethylene film and held at room temperature. After 5 and 10 d, samples were collected to analyse firmness and the soluble solids content (SSC). Fruit samples for gas chromatography-mass spectrometry (GC-MS) analysis were freeze-dried before extraction. Fruit samples for RNA isolation were kept at –80°C.
Evaluating fruit firmness and soluble solids content
The firmness of each fruit was determined using a texture analyser (CT3-4500; Brookfield Engineering Laboratories, Middleboro, MA, USA) fitted with a 3-mm flat probe. The equatorial side of each fruit was compressed by 5 mm at a speed of 2 mm/s. The maximum force was recorded and expressed in Newtons (N). Using a digital refractometer (GMK-701R; G-Won Hitech, Seoul, Korea), the SSC was determined using 50 g of blueberry juice extracted from each container and expressed as a percentage [21, 22].
Analyses of acids, individual sugars, and their derivatives by GC-MS
Approximately 60 mg of ground dried powder was macerated in 1 mL of 70% MeOH using sonication for 1 h. The slurry samples were centrifuged at 11,000 g at 4°C for 10 min. After filtration with 0.45-μm microporous membranes, 100μL of the collected supernatant was transferred into a GC vial and dried under nitrogen gas at 60°C. Dried samples were redissolved and derivatised by adding 50μL of 20 mg/mL methoxyamine hydrochloride in pyridine and incubated at 30°C for 90 min for oximation.
Next, 50μL N,O-bis(trimethylsilyl)trifluoroacetamide was added to each sample for trimethylsilylation derivatisation and 30μL of fluoranthene was added (1,000μg/ mL in pyridine) as an internal standard. The mixture was heated at 60°C for 30 min [23] and then subjected to GC-MS analysis.
GC-MS analysis
Blueberry samples were analysed using GC (Trace 1310/ISQ LT; Thermo Fisher Scientific, Waltham, MA, USA) interfaced with a quadrupole mass spectrometer (TSQ 8000; Thermo Fisher Scientific). Each 1.0-μL aliquot of derivatised sample was injected in a 40:1 split ratio into the GC-MS, which was equipped with a DB-5MS capillary column (60 m×0.25 mm×0.25μm, Agilent J & W Scientific, Folsom, CA, USA). Helium was used as the carrier gas with a constant flow rate of 1.5 mL/min. The temperature program was as follows: the initial temperature was 50°C, held for 2 min, raised to 180°C at a rate of 5°C/min, held for 8 min, increased to 210°C at a rate of 2.5°C/min, elevated to 325°C at a rate of 5°C/min, and maintained for 10 min. The temperatures of the injector, transfer line, and ion source were set to 300, 310, and 270°C, respectively. The mass range (35–650 m/z) in full-scan mode for electron impact ionisation (70 eV) was applied. The solvent delay time was set to 14 min.
Identification and quantification of metabolites
Tentative identification of each metabolite was positively confirmed by comparing the retention time and mass spectral data with those of the NIST/EPA/NIH Mass Spectral Library (version 2.0 d; National Institute of Standards and Technology, Gaithersburg, MD, USA). All metabolites were tentative identified by comparing mass fragments with the standard mass spectra on the commercial NIST database and achieving more than 70% similarity. The concentrations of the metabolites were expressed as mg/kg dry weight (DW) as internal standard equivalents obtained by normalizing the metabolite peak area to that of the internal standard and multiplying by the concentration of the internal standard (fluoranthene).
Isolation of total RNA and cDNA synthesis
Approximately 100 mg of frozen fruit powder was extracted using the Ribospintrademark Seed/Fruit RNA mini kit (GeneAll Biotechnology, Seoul, Korea) [4]. The RNA was collected after adding 30μL of nuclease-free water after DNase treatment I (GeneAll Biotechnology). Collected RNA samples were stored at –80°C until analysis. The RNA concentrations of samples were measured by spectrophotometry (NanoDrop 2000; Thermo Fisher Scientific). The integrity of RNA samples was evaluated via electrophoresis using 2% agarose gels (Supplementary Figure 2). First-strand cDNA was synthesised from 2μg of each treated total RNA sample using the RevertAid First Strand cDNA Synthesis Kit (Thermo Fisher Scientific). The cDNA was diluted 10-fold with diethylpyrocarbonate-treated water and stored at –20°C until analysis by real-time quantitative polymerase chain reaction (RT-qPCR).
Confirmation of specific genes and analysis of gene expression
Specific gene primers were designed using the National Centre for Biotechnology Information (NCBI) primer blast tool (https://www.ncbi.nlm.nih.gov/). The VcINV, VcSPS, and VcADR genes were confirmed by their PCR products. Partial VcINV, and VcSPS coding sequences were designed based on previous research [4] (Supplementary Figure 3). The VcADR transcript was from an original sequence in a blueberry database (https://www.vaccinium.org/crop/blueberry). After electrophoresis and gel purification, VcADR was confirmed by sequencing (Supplementary Figure 4) and deposited in the NCBI archive (acc. no. OK318879) (Supplementary Table 1).
Gene expression was analysed using RT-qPCR. The qPCR reactions were performed with the Mx3005P qPCR System (Agilent Technologies, Santa Clara, CA, USA) using SolGenttrademark 2× Real-Time Smart mix (SolGent, Daejeon, Korea) [24, 25], in a total reaction volume of 10μL, including 2μL of cDNA template according to the manufacturer’s instructions. The glyceraldehyde-3-phosphate dehydrogenase (GAPDH) gene was used as an internal control [26]. The thermal cycling parameters were 95°C for 10 min with 40 cycles of 95°C for 30 s, 55°C for 30 s, and 72°C for 1 min. The 2–ΔΔCT method was used to normalise and calibrate transcript values relative to GAPDH as previously described [4, 26]. For each experiment, three independent replicates of the qPCR assays were performed.
Statistical analyses
Experiments were performed in triplicate and means, and standard deviations were determined. Comparisons among cultivars, firmness, SSC, organic acids, sugars, sugar derivatives, and genes were evaluated using the SAS 9.4 (TS1M2) statistical software (SAS Institute, Cary, NC, USA). Figures 1to 5 were created with SigmaPlot 12.0 (Systat Software, San Jose, CA, USA). Data in lines with different letters differed significantly according to Duncan’s multiple range test at p < 0.05. Figure 6 was created using MetaboAnalyst 5.0.
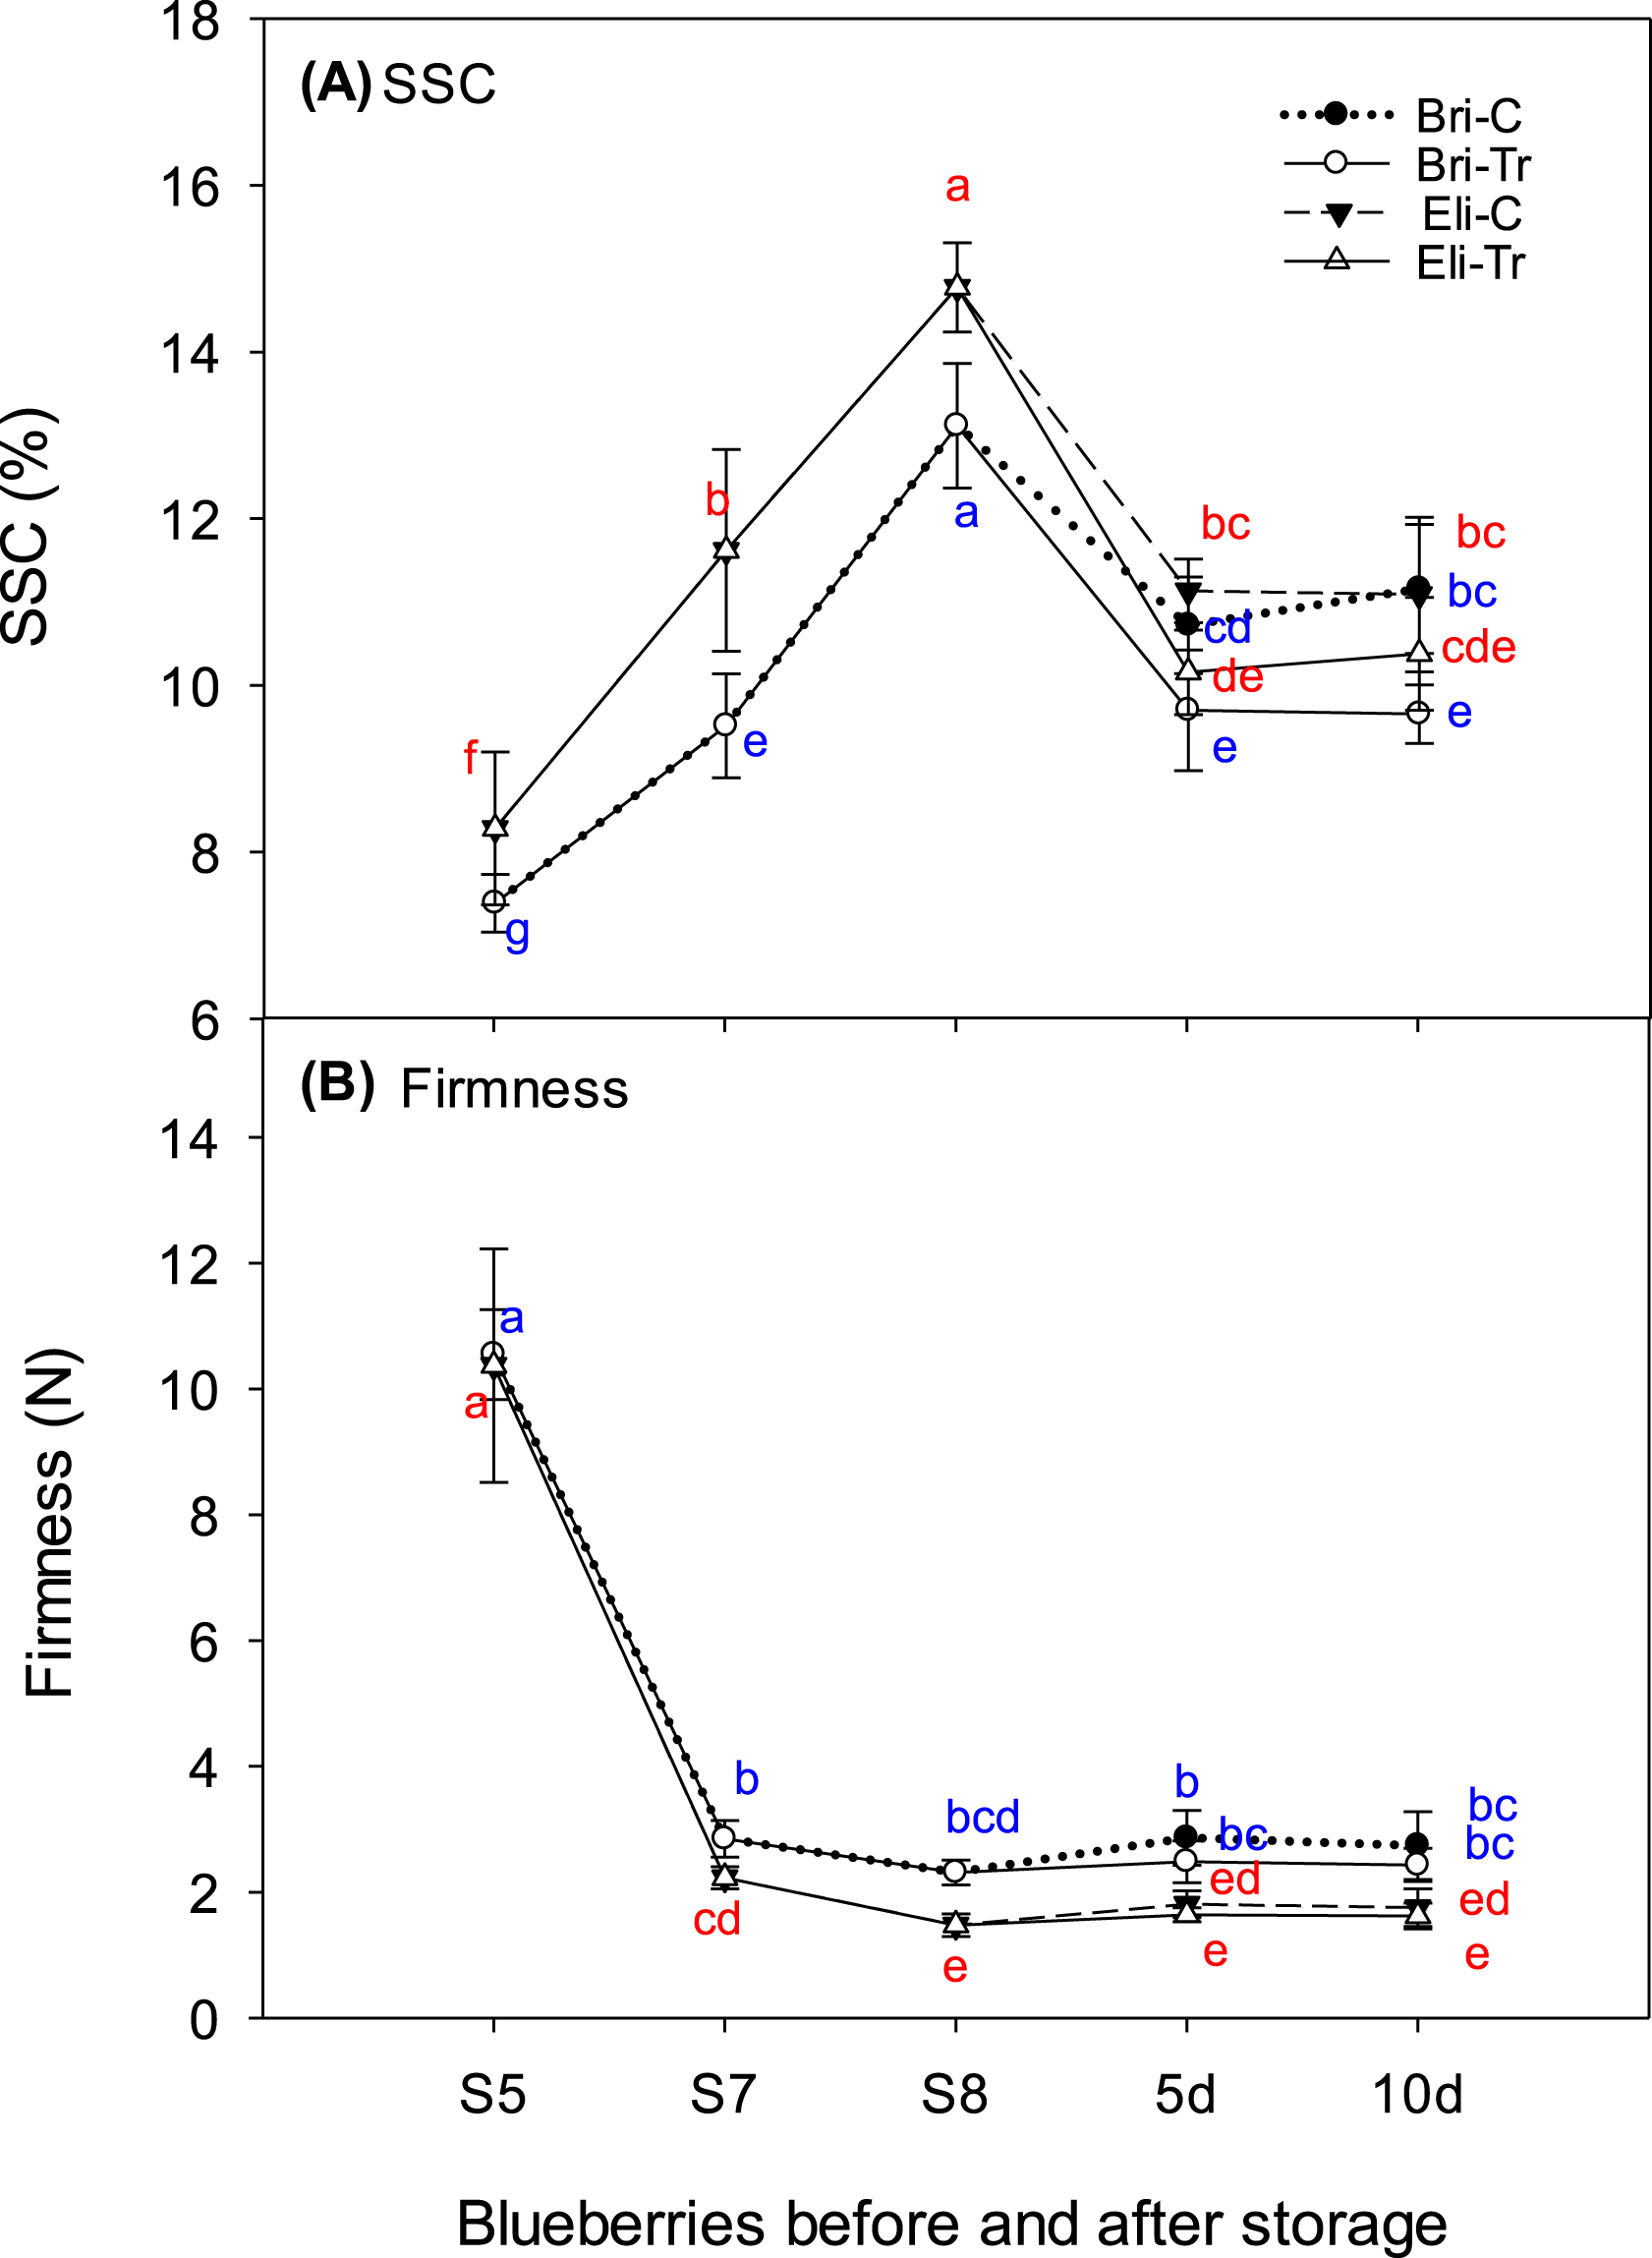
Changes in soluble solids content (SSC) (A) and firmness (B) of Brigitta and Elizabeth blueberry cultivar fruit during ripening and after chitosan treatment. The y-axis shows the percentage of SSC (%) and firmness value (N). The x-axis shows blueberry fruit sampled at three ripening stages (S5, green; S7, pink; and S8, dark blue) and after 5 and 10 d of chitosan treatment for dark blue blueberries. Bri-C, Brigitta-control; Bri-Tr, Brigitta treated with chitosan; Eli-C, Elizabeth-control; and Eli-Tr, Elizabeth treated with chitosan. Data in lines with different letters differed significantly according to Duncan’s multiple range test at p < 0.05. Values are expressed as the means±standard deviations of three samples.

Changes in citric acid (A), malic acid (B), phosphoric acid (C), and linoleic acid (D) concentrations in the fruit of two blueberry cultivars in fluoranthene equivalents. The y-axis shows fluoranthene equivalents (mg/kg dry weight). The x-axis shows blueberry fruit sampled at three ripening stages (S5, green; S7, pink; and S8, dark blue) and after 5 and 10 d of chitosan treatment for dark blue blueberries. Bri-C, Brigitta-control; Bri-Tr, Brigitta treated with chitosan; Eli-C, Elizabeth-control; and Eli-Tr, Elizabeth treated with chitosan. Data in lines with different letters differed significantly according to Duncan’s multiple range test at p < 0.05. Values are expressed as the means±standard deviations of three samples.

Changes in glucose (A), fructose (B), mannose (C), and sucrose (D) concentrations in the fruit of two blueberry cultivars in fluoranthene equivalents. The y-axis shows the fluoranthene equivalents (mg/kg DW). The x-axis shows blueberry fruit sampled at three ripening stages (S5, green; S7, pink; and S8, dark blue) and after 5 and 10 d of chitosan treatment for dark blue blueberries. Bri-C, Brigitta-control; Bri-Tr, Brigitta treated with chitosan; Eli-C, Elizabeth-control; and Eli-Tr, Elizabeth treated with chitosan. Data in lines with different letters differed significantly according to Duncan’s multiple range test at p < 0.05. Values are expressed as the means±standard deviations of three samples.
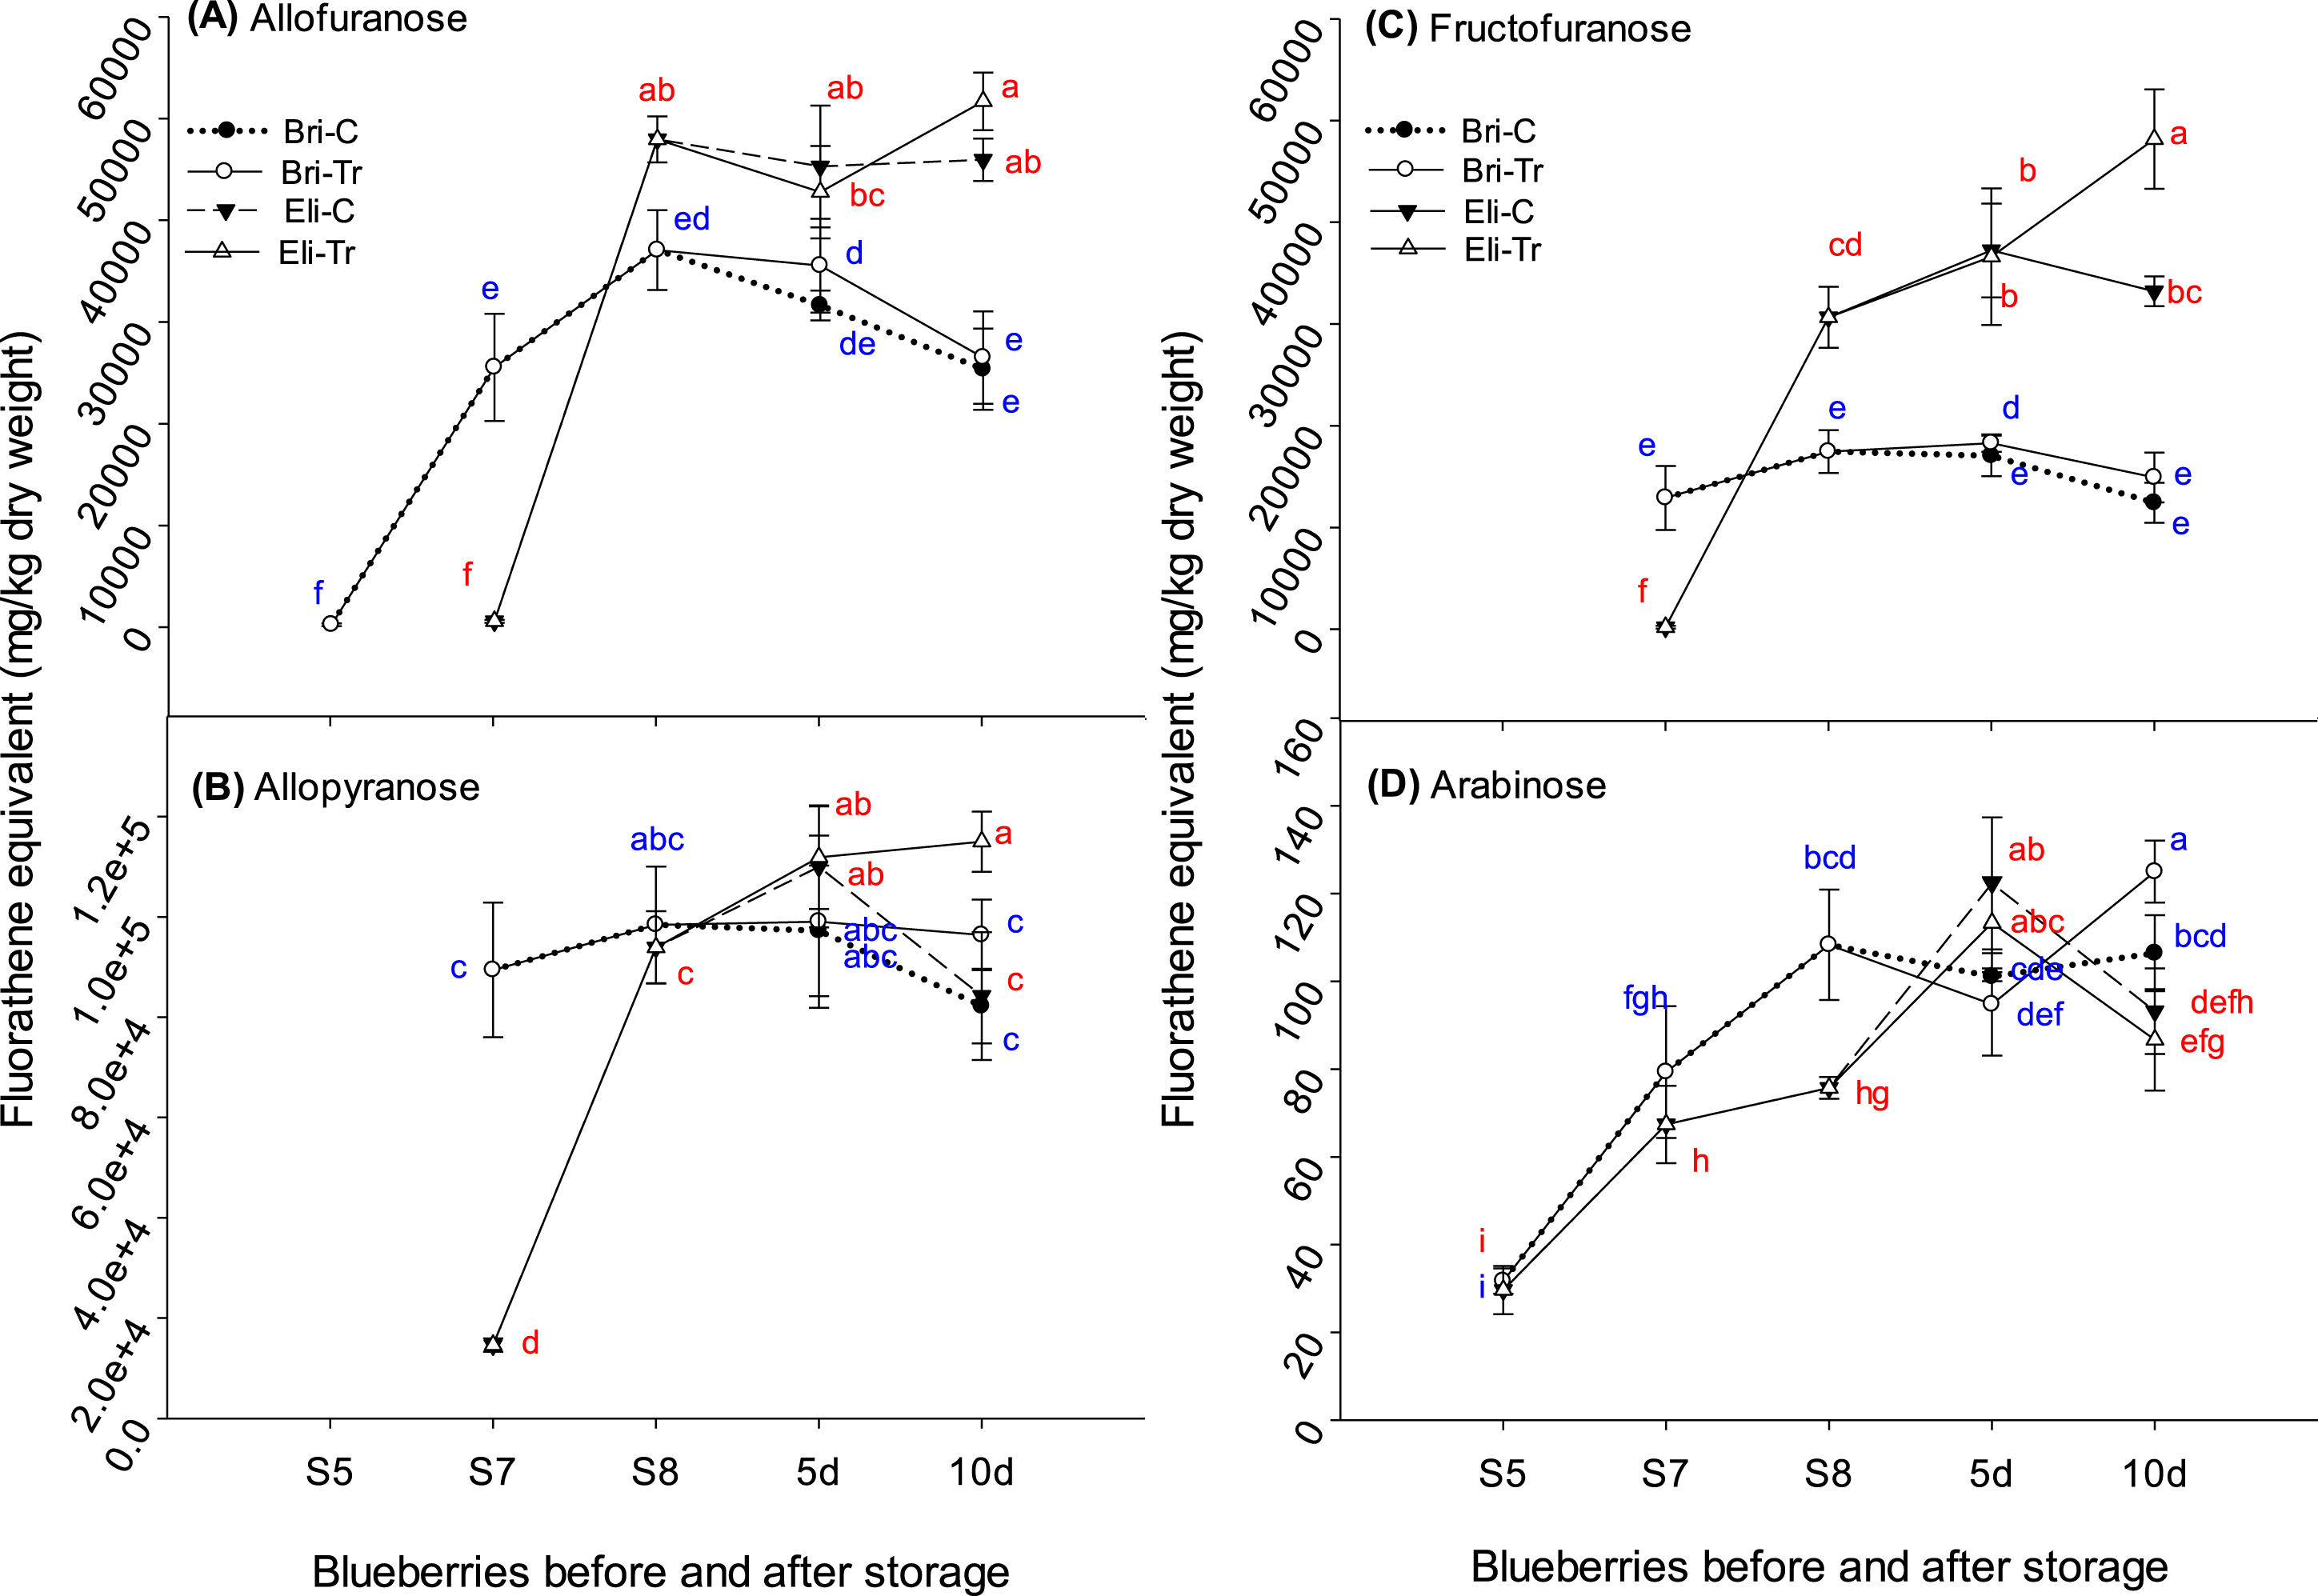
Changes in the allofuranose (A), allopyranose (B), fructofuranose (C), and arabinose (D) concentrations in the fruit of two blueberry cultivars in fluoranthene equivalents. The y-axis shows fluoranthene equivalents (mg/kg DW). The x-axis shows the blueberry fruit samples sampled at three ripening stages (S5, green; S7, pink; and S8, dark blue) and after 5 and 10 d of chitosan treatment for dark blue blueberries. Bri-C, Brigitta-control; Bri-Tr, Brigitta treated with chitosan; Eli-C, Elizabeth-control; and Eli-Tr, Elizabeth treated with chitosan. Data in lines with different letters differed significantly according to Duncan’s multiple range test at p < 0.05. Values are expressed as the means±standard deviations of three samples.
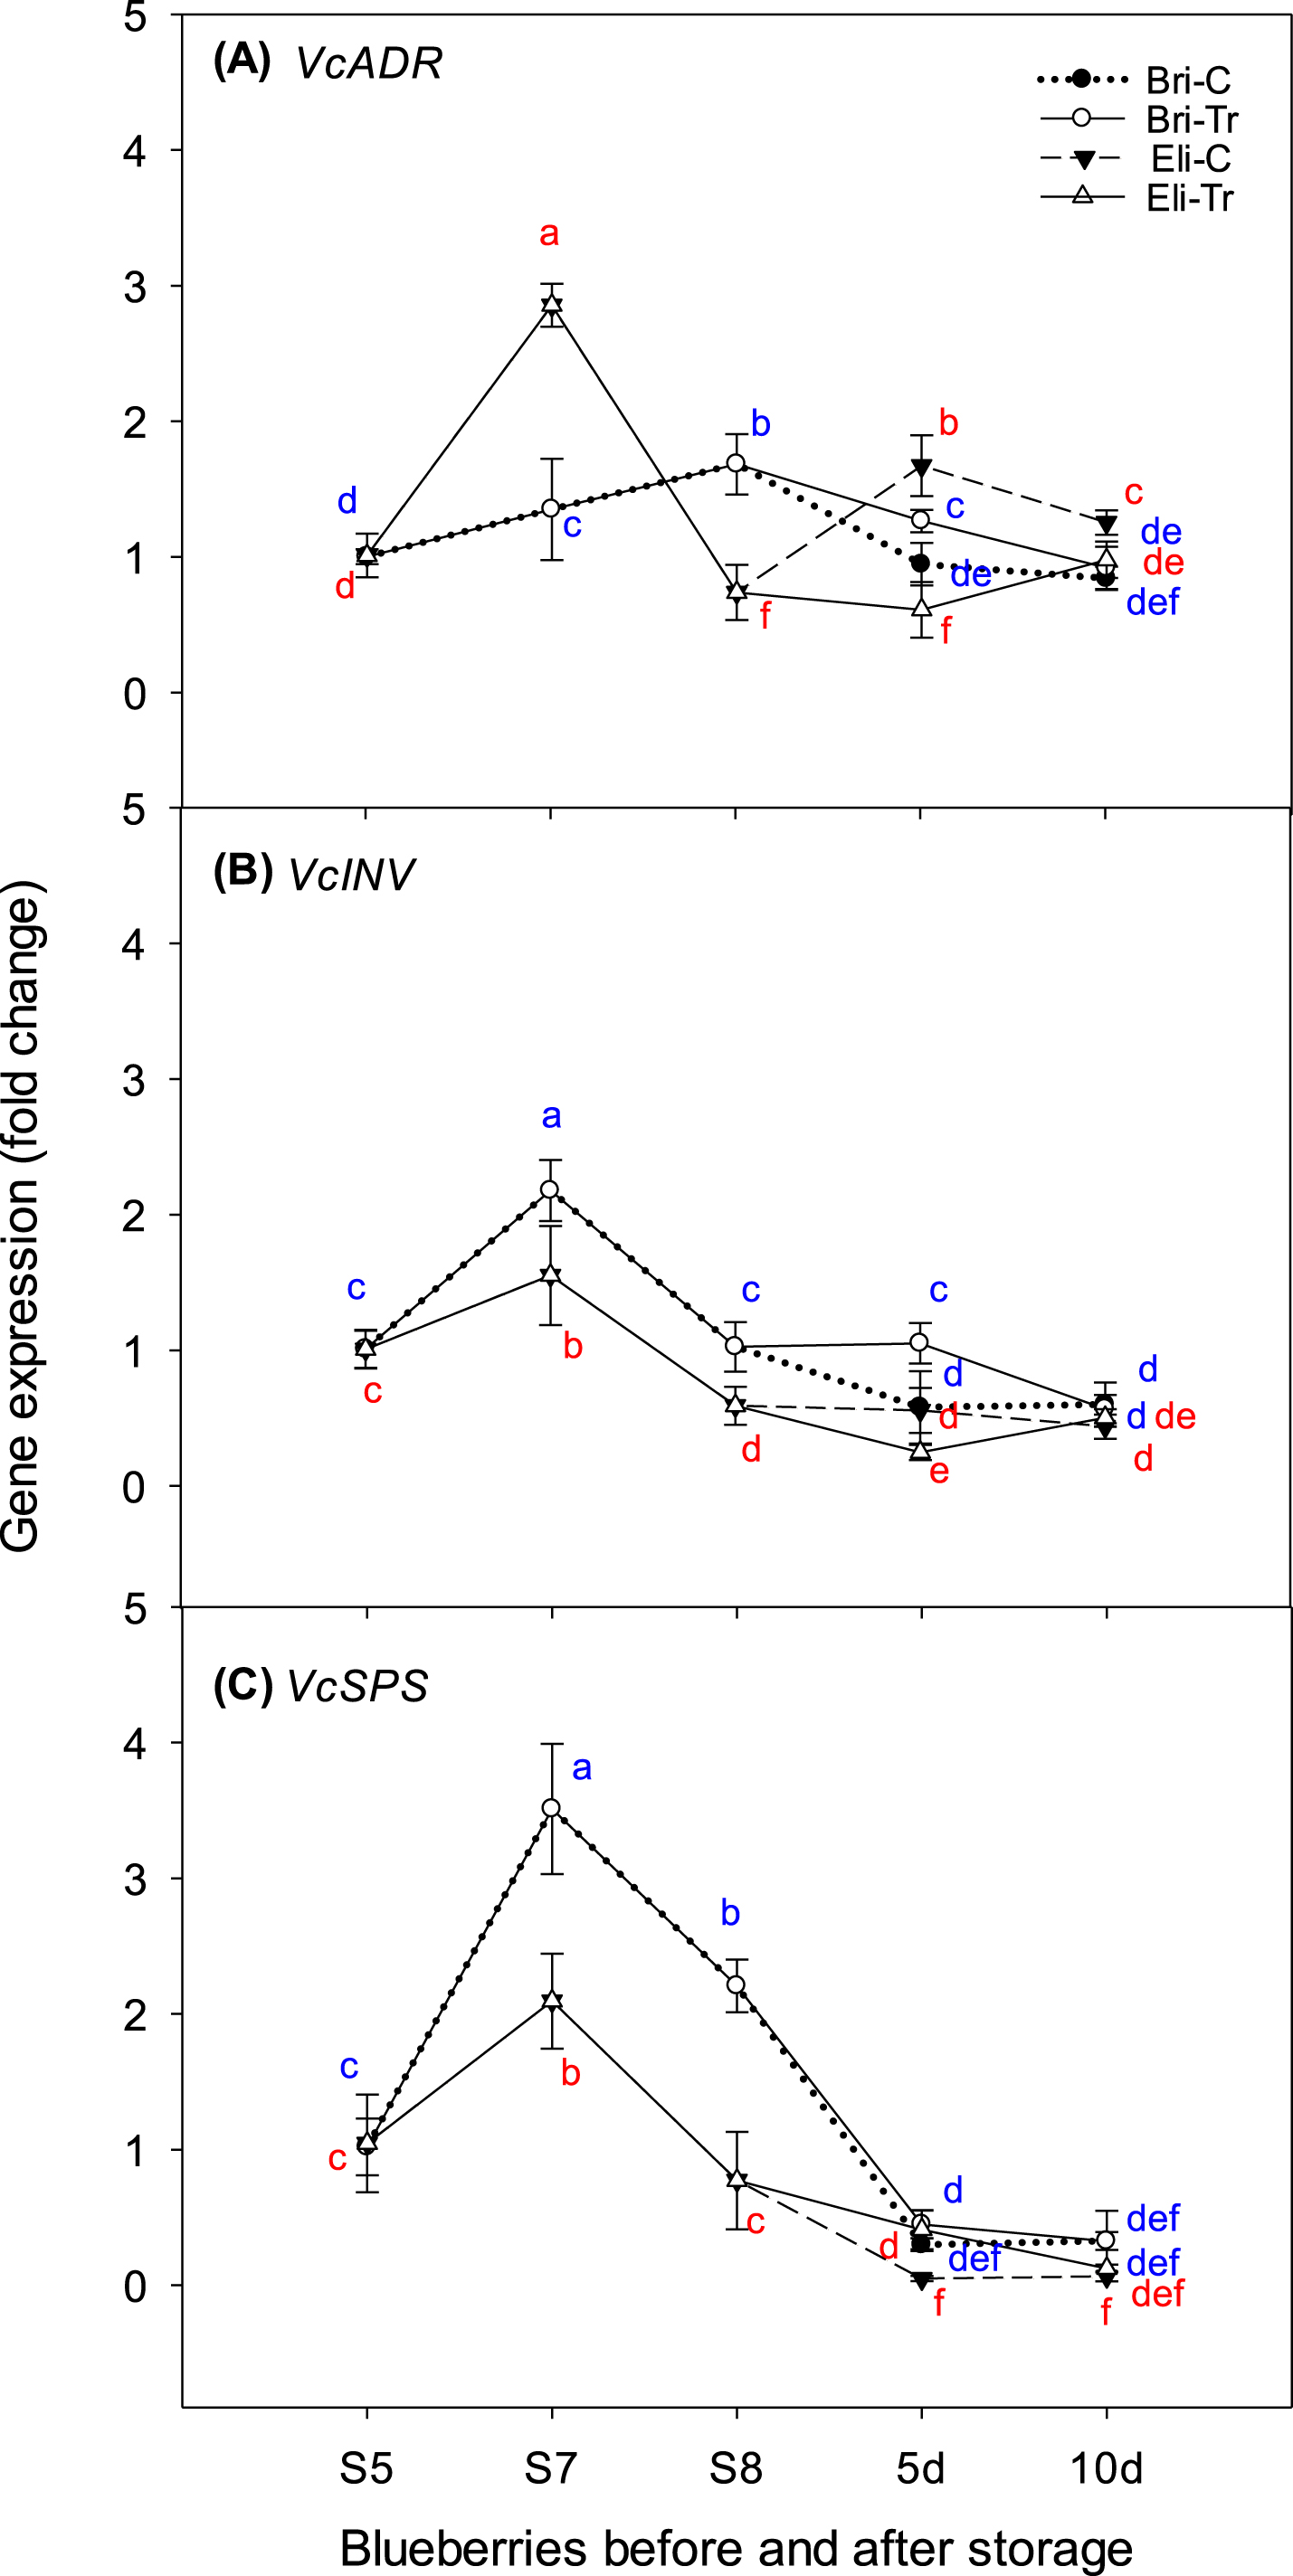
Changes in expression of VcADR (A), VcINV (B), and VcSPS (C) of two blueberry cultivars (Brigitta and Elizabeth) during ripening and after chitosan treatment. The y-axis shows the gene expression. The x-axis shows blueberry fruit sampled at three ripening stages (green, pink, and dark blue) and after 5 and 10 d of chitosan treatments for dark blue blueberries. Bri-C, Brigitta-control; Bri-Tr, Brigitta treated with chitosan; Eli-C, Elizabeth-control; and Eli-Tr, Elizabeth treated with chitosan. Data in lines with different letters differed significantly according to Duncan’s multiple range test at p < 0.05 Values are expressed as the means±standard deviations of three samples.
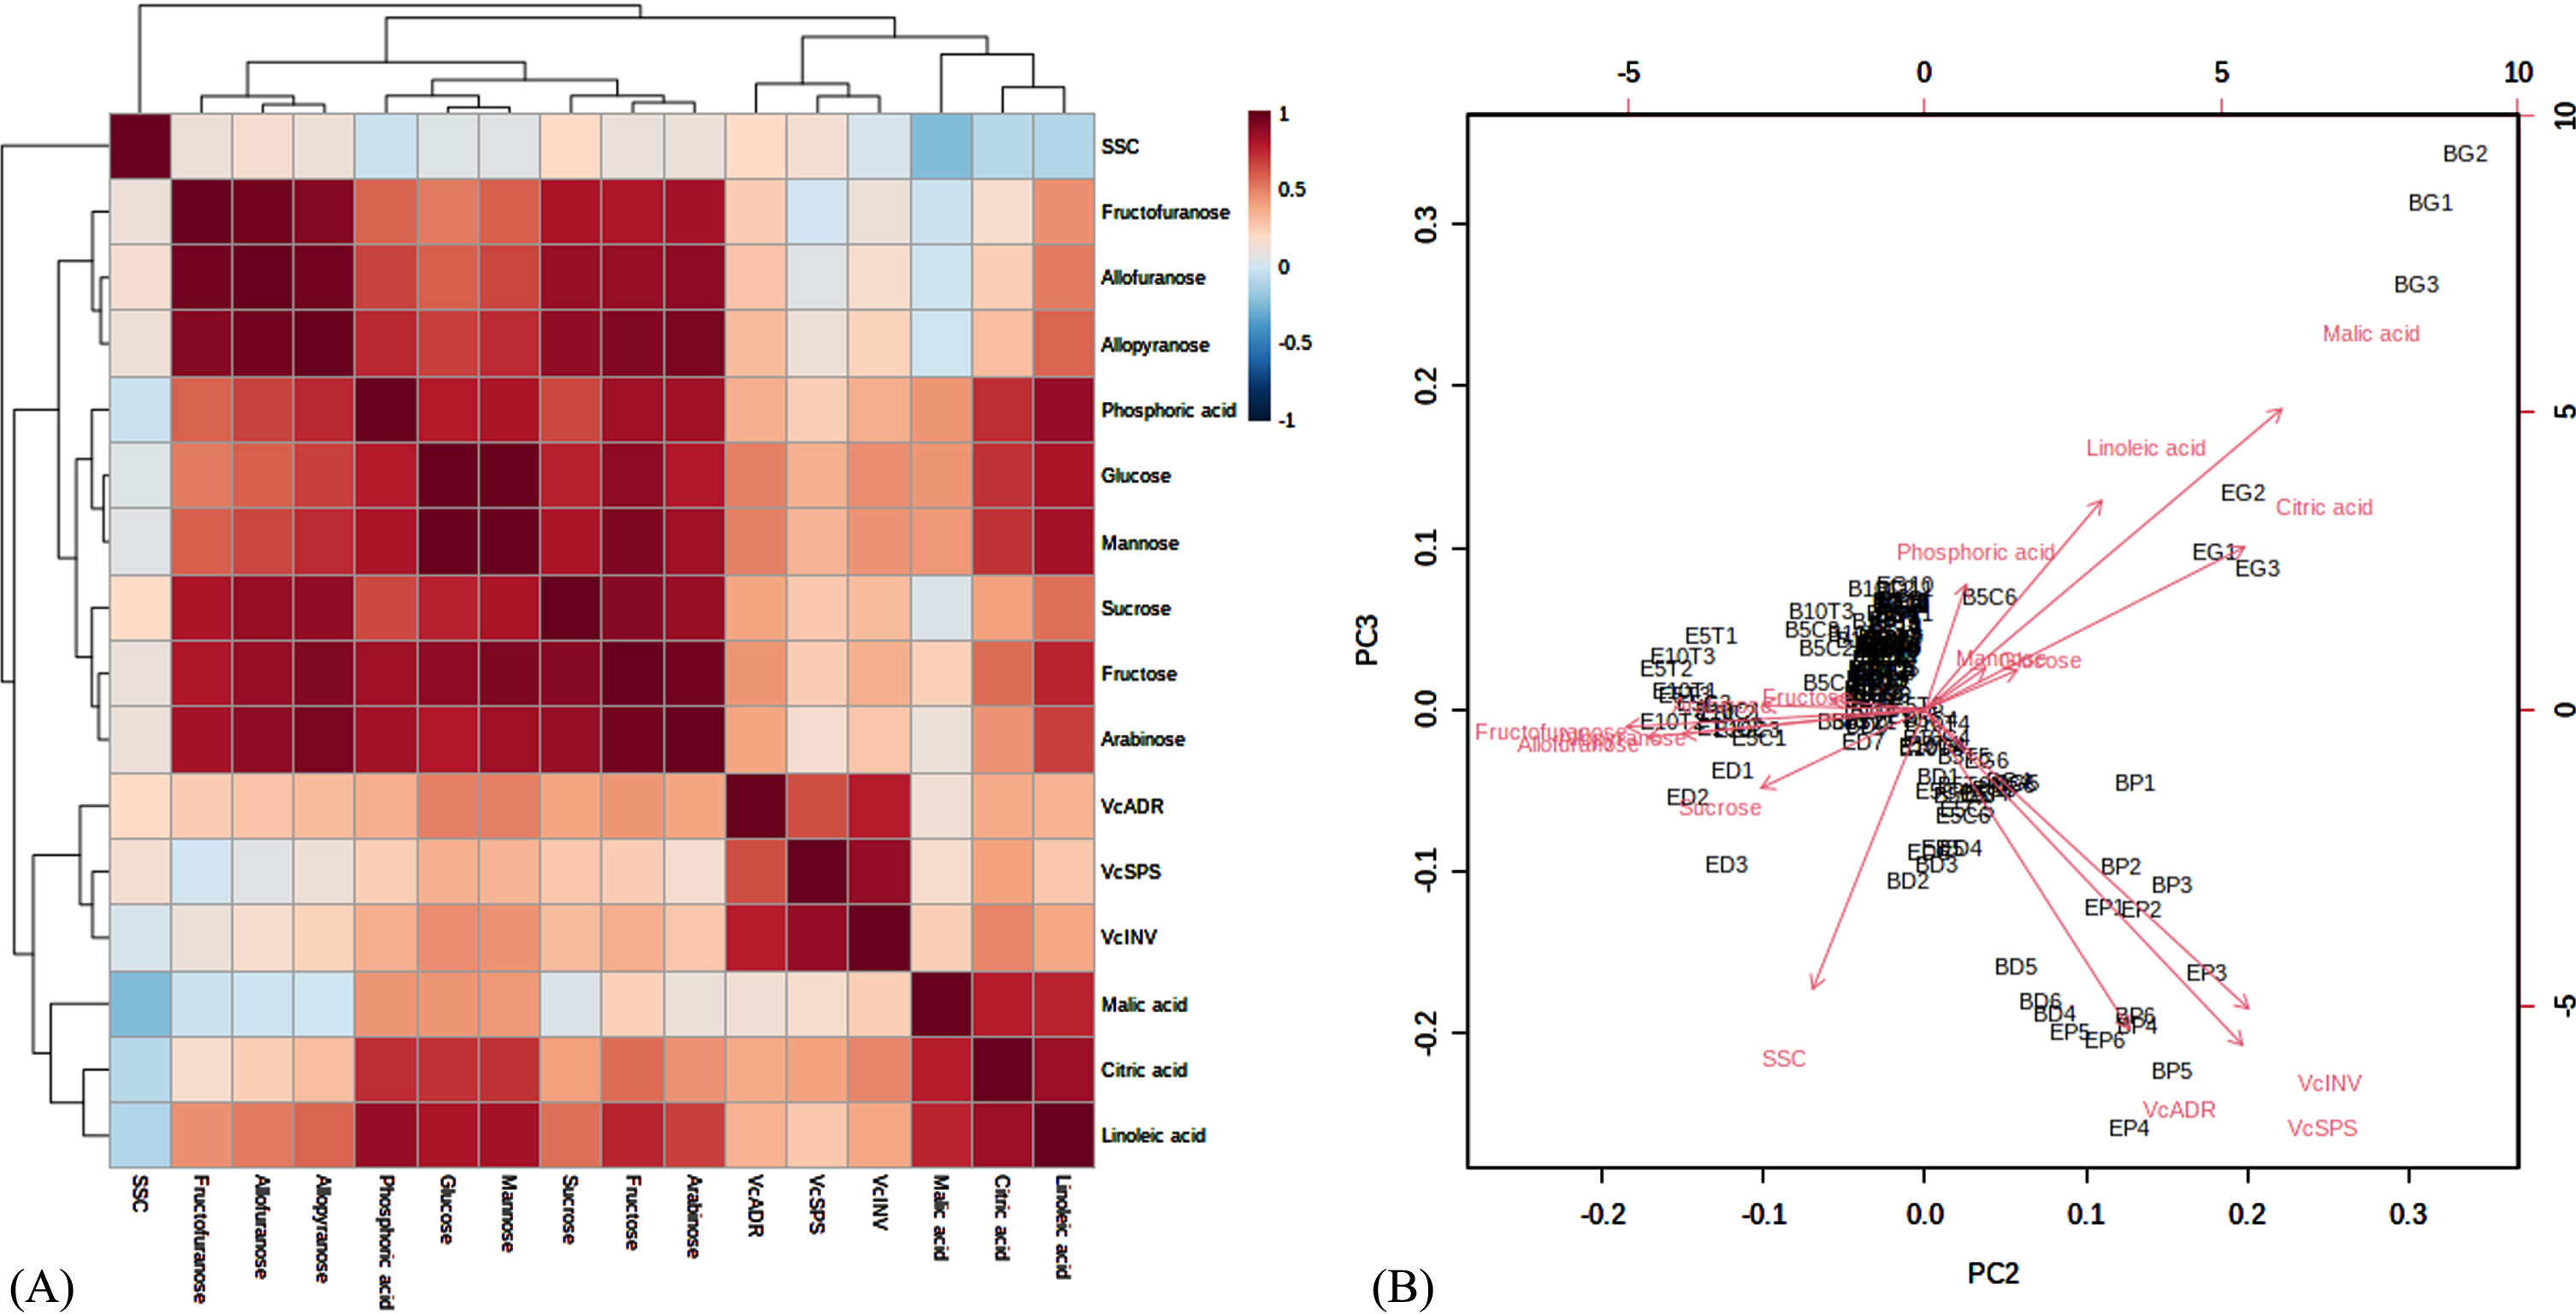
Correlation (A), principal component analysis (B) for SSC, sugars, acids, and gene expression levels before and after storage. Abbreviations: E-G, Elizabeth fruit at the green stage; E-P, Elizabeth fruit at the pink stage; E-D, Elizabeth fruit at the dark blue stage; E5C, control Elizabeth fruit after 5 d; E5T, Elizabeth fruit after 5 d, treated with chitosan; E10C, control Elizabeth after 10 d; E10T, Elizabeth after 10 d, treated with chitosan. Similar abbreviations were used for the Brigitta cultivar (B). The figures were created using MetaboAnalyst 5.0. Values are expressed as the means±standard deviations of three samples.
Effects of ripening and chitosan treatments on firmness and SSC in blueberries
The SSC percentage increased when the fruit was ripe, but decreased during storage in both cultivars (Fig. 1A).
In Brigitta, the SSC increased to 7.3, 9.5, and 13. 2% in the green, pink, and dark blue stages, respectively, and to 8.3, 11.6, and 14.7% in Elizabeth. After the chitosan treatments of blueberries at S8, no significant changes were observed in the SSC in Elizabeth during storage, while the control and treated fruit differed after 10 d in Brigitta.
The firmness declined sharply from green to dark blue fruit, and significant differences were observed between treated and control samples during storage for both cultivars (Fig. 1B). The firmness of Elizabeth was lower than that of Brigitta. The firmness of Elizabeth decreased from 10.4 N in green to 2.2 N in pink and 1.5 N in dark blue, reaching 1.4 N during storage, while the firmness of Brigitta decreased from 10.6 N to 2.9 N in pink and 2.3 N in dark blue, reaching 2.4–2.8 N during storage. No significant differences were observed in firmness between chitosan-treated and control fruit in either cultivar.
Effects of the ripening and chitosan treatments on the primary metabolites in blueberries
Figure 2 presents the decreases in concentrations of targeted organic acids during the ripening stages.
After postharvest treatment, the citric acid concentration in both cultivars decreased compared to S8 (initial sample), except for the control samples after 5 d in Elizabeth (Fig. 2A). The citric acid concentration declined from 180,217 mg/kg DW at S5 to 79,707 mg/kg DW at S8 and was unchanged at approximately 45,000 mg/kg DW in Brigitta during storage. After 5 d of treatment, the citric acid concentration of Elizabeth treated with chitosan (176,88 mg/kg DW) was lower than that of the control (37,269 mg/kg DW); after 10 d of storage, no significant changes were observed in their citric acid concentrations. The malic acid concentration did not change in either cultivar during storage compared to samples at S8: that in Brigitta dropped from 15,572 mg/kg DW at S5 to 2,502 mg/kg DW at S7 and was stable at 450∼500 mg/kg DW in all treatments during storage. The malic acid content in Elizabeth decreased from 5,481 mg/kg DW at S5 to 902 mg/kg DW at S7, with no changes at S8 or in postharvest treatment samples (Fig. 2B). The linoleic acid concentration decreased during fruit ripening in both cultivars (Fig. 2C): from 710 mg/kg DW at S5 to 318 mg/kg DW at S8 for Brigitta and from 330 mg/kg DW at S5 to 134 mg/kg DW at S8 for Elizabeth. However, after 10 d of storage, linoleic acid concentration was higher in Brigitta control samples than in chitosan-treated samples (348 mg/kg DW in control; 262 mg/kg DW in chitosan-treated sample). This trend was opposite to Elizabeth (151 mg/kg DW in control, 250 mg/kg DW in chitosan-treated fruit). Phosphoric acid concentration differed between Elizabeth and Brigitta during ripening (Fig. 2D): it increased from S7 to S8 in Brigitta (from 453 to 551 mg/kg DW), but was unchanged from S7 (227 mg/kg DW) to S8 (169 mg/kg DW) in Elizabeth. After storage, phosphoric acid concentration was higher in the control sample (720 mg/kg DW) than in chitosan-treated fruit (540 mg/kg DW) after 10 d of storage in Brigitta.
The changes in blueberry sugar concentration were dependent on the cultivar and specific individual sugars. Before storage, the glucose and mannose concentrations at the three ripening stages displayed the same trends in both cultivars. In Elizabeth, the initial sugar concentrations increased from S5 (glucose, 1,850 mg/kg DW; mannose, 13,052 mg/kg DW) to S7 (glucose, 18,129 mg/kg DW; mannose, 72,807 mg/kg DW), and then decreased at S8 (glucose, 6,448 mg/kg DW; mannose, 34,229 mg/kg DW) (Fig. 3A, C). In comparison, Brigitta decreased slightly from S5 (glucose, 14,113 mg/kg DW; mannose, 58,913 mg/kg DW) to S8 (glucose, 10,395 mg/kg DW; mannose, 45,870 mg/kg DW). While the increase in the fructose concentration during ripening peaked at S7 for both cultivars (Elizabeth, 109,542 mg/kg DW; Brigitta, 134,851 mg/kg DW) (Fig. 3C), the sucrose concentration peaked at S8 in Elizabeth (36,521 mg/kg DW) and at S7 in Brigitta (29,226 mg/kg DW) (Fig. 3D).
After 10 d storage, the glucose, mannose, and fructose concentrations in the chitosan-treated samples were higher than in the control in Elizabeth, while these sugars did not change during storage in Brigitta. In control and chitosan-treated Elizabeth samples, the fluoranthene equivalent concentrations were 3,990 mg/kg DW (control) and 7,590 mg/kg DW (chitosan treated sample) for glucose, 26,941 mg/kg DW (control) and 36,088 mg/kg DW (chitosan treated) for mannose, and 92,595 mg/kg DW (control) and 121,175 mg/kg DW (chitosan treated sample) for fructose. During storage, the sucrose concentration decreased in both cultivars. However, the magnitude of this decrease was dependent on the treatments and cultivar (Fig. 3D). After storage, no differences were observed between the chitosan-treated samples and control in Brigitta, but this was not the case in Elizabeth. In Elizabeth, fruit samples at S8 had a peak sucrose concentration of 36,521 mg/kg DW, while after 5 and 10 d storage, the sucrose concentration was higher in chitosan-treated fruit than in the control (35,335 vs. 23,870 mg/kg DW after 5 days and 25,150 vs. 15,168 mg/kg DW after 10 d, respectively).
Similarly, the concentrations of sugar derivatives increased during ripening (Fig. 4), peaking at S8. The respective allofuranose, allopyranose, fructofuranose, and arabinose concentrations in Elizabeth and Brigitta were 47,961 and 37,077 mg/kg DW (Fig. 4A), 93,914 and 98,398 mg/kg DW (Fig. 4B), 30,650 and 17,463 mg/kg DW (Fig. 4C), and 67 and 108 mg/kg DW (Fig. 4D). After storage, the allofuranose and arabinose did not change in either cultivar. In Elizabeth, the allopyranose concentration was higher in the chitosan-treated sample (115,000 mg/kg DW) after 10 d than in the control (84,201 mg/kg DW). The fructofuranose concentration was higher in chitosan-treated fruit (48,174 mg/kg DW) than in the control (33,222 mg/kg DW) after 10 d storage.
Effects of ripening and chitosan treatments on gene expression levels in blueberries
Figure 5 presents the expression levels of targeted genes related to sugar accumulation. Most transcripts reached a peak at S7 when the fruit turned red in Elizabeth; the expression of these genes decreased when the fruit turned dark blue and the SSC was the highest. However, this trend was not observed for VcADR in Brigitta (Fig. 5A). After peaking at 2.9-fold (VcADR), 2.1-fold (VcSPS), and 1.6-fold (VcINV) at S7, gene expression in Elizabeth decreased at S8 and during storage. The difference between the control and chitosan-treated samples depended on the cultivar and targeted genes. VcADR and VcINV expression were both higher in treated fruit than the control in Brigitta, but they were much lower in Elizabeth after 5 d of storage. In Brigitta, VcADR expression was reduced by 0.9- and 1.3-fold in the control and treated samples, respectively, whereas VcINV expression decreased by 0.6- and 1.1-fold, respectively. In Elizabeth, VcADR expression was reduced by 1.7- and 0.6-fold in the control and chitosan-treated fruit, respectively, whereas VcINV expression was decreased by 0.6- and 0.3-fold, respectively. After 10 d of storage, no changes were observed in VcSPS and VcINV between the control and chitosan treatments in either cultivar. However, in Elizabeth VcADR changed more in the control (1.3-fold) than in chitosan-treatment samples (0.9-fold) after 10 d of storage.
Correlation, principal components analysis, and heat map of primary metabolites and genes
Figure 6 and Supplementary Table 2 present the correlation and principal components analysis (PCA) results of the targeted primary metabolites and genes.
Strong correlations were observed among the groups of sugars and their derivatives, acids, and genes (Fig. 6A). The strongest positive correlations were between the mannose and glucose concentrations, the sucrose and fructose concentrations and targeted sugar derivatives, the citric acid and malic acid concentrations, and the targeted genes (Fig. 6B). SSC was positively correlated with VcADR and sucrose (P≤0.05) and sucrose was tightly correlated with the targeted gene (Supplementary Table 2).
Discussion
Both before and after harvest, sugar metabolism in blueberries undergoes significant changes, which include the degradation and synthesis of sugars and acid metabolites, depending on cultivars and postharvest storage conditions [4]. Ripening and postharvest chitosan treatment affected the fruit quality, sugar metabolites, and gene expression, and positive correlations were observed among the soluble solids content, sucrose, and VcADR and targeted genes (Fig. 6; Supplementary Table 2), supporting our hypothesis about sucrose metabolic enzymes in highbush blueberries before and after storage. For this study, we selected Elizabeth and Brigitta because they are two cultivars of the same size that can be cultivated under the same conditions and harvested at the same time, but they differ in taste. At full development (S8), dark blue Elizabeth fruit are sweeter than Brigitta fruit (Fig. 1). The decreases in firmness and acid concentrations with the increase in SSC and individual sugars and sugar derivatives in this study were similar to reported trends [2, 27]. However, the levels of sugar metabolites throughout sucrose metabolism and VcINV, VcSPS, and VcADR expression of the two cultivars during ripening and after the chitosan treatments were interesting.
Soluble sugar (e.g., glucose, fructose, and sucrose) accumulation or degradation determines fruit sweetness [28]. The sucrose-metabolising enzymes in the fruit, including sucrose phosphate synthase, are essential for determining the soluble sugar concentration of the fruits of many species [29]. The sucrose concentration in Elizabeth peaked at S8, but that in Brigitta decreased at this stage, influenced by the carbohydrate sink strength and the type of sink tissue [30]. As peaches ripen, sucrose degradation leads to increased glucose and fructose concentrations [31]. In postharvest strawberries, an exogenous sucrose treatment significantly delayed the decrease in sucrose concentration and increased fructose and glucose concentrations [32]. In the present study, the dramatic increase in glucose and mannose concentrations observed in Elizabeth did not occur in Brigitta. The higher fluoranthene equivalent concentration in the sucrose peak of Elizabeth after chitosan treatment for 5 and 10 d in this study was similar to results in mangoes [10]. The chitosan-induced decrease in citric acid concentration in this study was identical to that in a previous study of Ponkan fruit: a chitosan-coating treatment significantly delayed citric acid degradation [33]. In Elizabeth, chitosan increased the glucose, allofuranose, fructofuranose, and allopyranose concentrations by delaying ripening during storage [34]. This did not occur in Brigitta.
During ripening, fruit softening is related to the accumulation of arabinose in water-soluble pectins [22]. During ripening, the increases of compounds shown in Fig. 4, together with the tight correlations between sugars and their derivatives (Fig. 6), indicate that sugar metabolism induced higher concentration of their products in Elizabeth than in Brigitta. We hypothesised that the increase in the sucrose concentration depends on the activation or inhibition of invertase, sucrose phosphate synthase, and aldose reductase. We observed close correlations between targeted genes and sugars (Supplementary Table 2; Fig. 6A).
Hubbard reported that invertase and sucrose phosphate synthase are related to the sucrose concentration in melon fruit [35]. Invertase is the main sucrose-hydrolysing enzyme associated with quality and sugar accumulation during strawberry ripening [36]. In the present study, the opposite changes between the sucrose concentration (Fig. 3D) and VcINV (Fig. 5B) in Elizabeth are consistent with a previous study that reported a negative correlation between the sucrose and invertase concentrations [37]. When blueberries ripen, sugar metabolism continues after harvest [2]; in the present study, the sucrose concentration increased from the pink to dark blue stages in Elizabeth, but it decreased in Brigitta. The expression of the three target genes was always higher in Brigitta than in Elizabeth. Our previous research also demonstrated that the inhibition of VcSPS and VcINV increased sugar accumulation in blueberries [4]. Aldose reductase is involved in sugar metabolism in plants. In peach, abscisic acid, oxidative stress, and cold and salt stress treatments induced AKR [9]. High expression of the tomato SlAKR4B gene was detected in senescent leaves and ripening fruit [38]. The present study is the first to investigate the expression of AKR genes in blueberries and revealed significant correlations with SSC. The difference in the expression of VcADR (OK318879) may have caused the differences in sucrose accumulation in the two blueberry cultivars studied. The up-regulation of VcADR led to a decrease in the sucrose concentration, which caused a decline in sugar accumulation. The effects of chitosan on the three genes were more evident after 5 d in Elizabeth. We hypothesise that chitosan induces the inhibition of VcADR and VcINV, and the activation of VcSPS, which leads to changes in the sucrose concentration, which determines the sweetness of blueberries; however, future studies should confirm this hypothesis.
Conclusion
The changes in sucrose and VcADR affect sugar metabolism in highbush blueberries. The effects of sugar metabolism during ripening and postharvest chitosan treatment were more significant in the Elizabeth than in the Brigitta cultivars. Down-regulation of the three targeted genes induced sugar accumulation in highbush blueberries during ripening. Chitosan inhibited the expression of VcADR and induced higher sugar concentrations after storage. The stimulation or degradation of sucrose determined the levels of sugar metabolites in the two blueberry cultivars studied. Aldose reductase might be an essential enzyme in blueberry sugar metabolism and an increase in sucrose stimulated sugar accumulation in blueberries. These findings add to the body of research on the mechanism of sugar accumulation in fruit during maturation and after postharvest treatments in blueberries.
Declaration of competing interest
The authors declare no conflict of interest related to this study.
Funding
This work was supported by the National Research Foundation of Korea (grant number. 2020R1I1A1A01066341).
Author’s contributions
CTTN designed the whole research, conducted experiments, and wrote the manuscript. SOY conducted the experiments in part with critical technical assistance, WSC supported technically for GC-MS.
