
Abstract
With the development of technology and the widespread collection of data, high-dimensional data analysis has become a research hotspot in many fields. Traditional parameter methods often face problems such as dimensional disasters in high-dimensional data analysis. Non parametric methods have broad application prospects in high-dimensional data because they do not rely on specific parameter distribution assumptions. The Bayesian rule is more suitable for dealing with noise and outliers in high-dimensional data because it takes uncertainty into account. Therefore, it is of great significance to combine non parametric methods with Bayesian methods for application research in high-dimensional data analysis. In this paper, the nonparametric Bayesian method was applied to the analysis of high-dimensional data, and the Dirichlet process Mixture model was used to cluster high-dimensional data. The regression analysis of high-dimensional data was carried out through the prediction model of nonparametric Bayesian regression. In this paper, the nonparametric Bayesian method based on Bayesian sparse linear model was used for feature selection of high-dimensional data. In order to determine the superiority of nonparametric Bayesian methods in high-dimensional data analysis, this paper conducted experiments on nonparametric Bayesian methods and traditional parametric methods in high-dimensional data analysis from five aspects of cluster analysis, classification analysis, regression analysis, feature selection and anomaly detection, and evaluated them through multiple indicators. This article explored the application of non parametric Bayesian methods in high-dimensional data analysis from these aspects through simulation experiments. The experimental results show that the clustering accuracy of the non parametric Bayesian clustering algorithm was 0.93, and the accuracy of the non parametric Bayesian classification algorithm was between 0.93 and 0.99; the coefficient of determination of nonparametric Bayesian regression algorithm was 0.98; the F1 values of non parametric Bayesian methods in anomaly detection ranged from 0.86 to 0.91, which was superior to traditional methods. Non parametric Bayesian methods have broad application prospects in high-dimensional data analysis, and can be applied in multiple fields such as clustering, classification, regression, etc.
Keywords
Introduction
With the continuous progress of science and technology, human genome sequencing data, stock trading data, satellite remote sensing images, multimedia images, massive text data, etc., all present massive high-dimensional data, which pose great challenges to statistical models and analysis. When dealing with high-dimensional data, the biggest problem is dimension expansion, that is, “Curse of dimensionality”. Under a certain approximation accuracy, the sample size required for multivariate function estimation increases exponentially with the increase of sample size. Secondly, because high-dimensional data is often accompanied by sparse redundancy, multicollinearity and other characteristics, existing statistical analysis methods, such as covariance matrix, test statistics, statistical models, etc., cannot meet the practical application requirements. For high-dimensional data, traditional analysis methods cannot effectively mine its true structure, and may also lead to incorrect analysis. In addition, due to the high dimensionality of the data, the computational complexity of data processing is also significant. In high-dimensional data analysis, non parametric Bayesian methods have attracted much attention due to their flexibility in complex models and the full utilization of prior knowledge. Compared to traditional frequency theory methods, non parametric Bayesian methods can provide greater degrees of freedom, making the model more flexible; meanwhile, by introducing appropriate prior distributions, non parametric Bayesian methods can handle a large amount of missing or abnormal data, improving the robustness of the model. Studying the application of non parametric Bayesian methods in high-dimensional data analysis can not only promote the development of statistics and machine learning methods, but also better understand and utilize high-dimensional data, providing more effective methods and technical support for solving practical problems.
The high-dimensional data created by high-throughput technology requires visualization tools that display data structures and patterns in an intuitive form. Moon Kevin R. introduced a visualization method that uses the Information geometry distance between data points to capture local and global nonlinear structures. Moon Kevin R. compared this method with other tools on various artificial and biological datasets and found that it consistently preserves a series of data patterns, including continuous progression, branching, and clustering, better than other tools [1]. Chemical science is generating an unprecedented large number of high-dimensional datasets, including chemical structures and related properties. However, there is currently no algorithm to visualize these data while preserving global and local features at a sufficient level of detail to allow human inspection and interpretation. Probst Daniel proposed a new Data and information visualization method to solve this problem. This method can represent millions of data points and any high-dimensional data set as a two-dimensional tree [2]. For a long time, developing algorithms for solving high-dimensional partial differential equations has been an extremely difficult task due to the problem known as the “curse of dimensionality”. Han Jiequn introduced a deep learning based method that can handle general high-dimensional parabolic partial differential equations [3]. The dimensionality reduction technology aims to map high-dimensional data onto a lower dimensional data space in order to seek a compact representation of the data, which is beneficial for further processing of the data. With the rapid development of multimedia and computer technology, the dimension of data is exploding, making data analysis in research fields such as machine learning and image processing increasingly difficult. To explore the practicality of these dimensionality reduction technologies, Liu Jing introduced traditional dimensionality reduction technologies and recent dimensionality reduction technologies, and analyzed the performance of typical dimensionality reduction technologies. He pointed out the remaining problems in dimensionality reduction technology and analyzed future research directions that are worth paying attention to [4]. These scholars still lack the analysis of high-dimensional data.
When the possibility is unavailable or difficult to handle, approximate Bayesian calculations are usually used, but forward models can be used to simulate data under different parameter settings. Despite recent interest in approximate Bayesian computing, high-dimensional data and expensive simulations are still bottlenecks in some applications. There is also no consensus on how to best evaluate the performance of these methods without understanding the true posterior. Izbicki Rafael demonstrated how non parametric conditional density estimation frameworks can help solve important challenges in approximate Bayesian calculations [5]. Kowal Daniel R. developed a complete Bayesian framework for scalar regression functions, which has many predictive factors. The function data response is modeled using an unknown basis function for non framework modeling, resulting in a flexible data adaptive basis function. He combined contraction priors to effectively remove unimportant scalar covariates from the model and reduce sensitivity to the number of basis functions [6]. However, these scholars have not conducted research on the application of non parametric Bayesian methods in high-dimensional data analysis, only exploring them from a shallow perspective.
In order to solve the problems that traditional parametric methods face in high-dimensional data, such as difficulty in model selection and dimension disaster, this paper uses nonparametric Bayesian methods to adjust model complexity to overcome these challenges. This paper compares the performance of nonparametric Bayesian methods and traditional parametric methods in five aspects: clustering, classification, regression, feature selection and anomaly detection. The experimental results show that non parametric Bayesian methods perform better on most indicators, but their runtime is relatively long. Therefore, in specific applications, it is necessary to weigh the advantages and disadvantages of various methods based on requirements and choose the most suitable method.
Application methods of non parametric Bayesian methods in high-dimensional data
Non parametric Bayesian method
Bayesian methods, as an effective means of dealing with uncertain problems, have broad application prospects in the field of probability statistics. This type of method is usually used to establish observation data that conforms to certain distribution characteristics and add it to actual observation data. It uses Bayesian theory to derive the maximum posterior distribution of parameters, and then uses reasoning to obtain the expected value when the maximum posterior distribution of parameters reaches its maximum. This expected value is used as the optimal parameter, and the optimal representation model is obtained. The Bayesian method can be widely applied in the field of probability and statistics, and its biggest advantage is that it can directly use the size of probability to judge and analyze uncertain problems. However, its drawback is that traditional Bayesian models (parameterized Bayesian models) rely too heavily on the estimation of model parameters, and their representation ability largely depends on the estimation of model parameters. In parameterized Bayesian models, the prior information of parameters often depends on human experience selection, but such prior assumptions cannot accurately characterize the characteristics of unknown factors. When facing unknown factors, it is difficult to choose the optimal prior distribution. A parameterized model in an infinite dimensional parameter space can be used to describe prior information, resulting in a series of non parametric Bayesian models.
Non parametric Bayesian estimation is a new estimation method that combines the advantages of Bayesian and non parametric methods. The parameters in the non parametric representation model can be flexibly changed, with no limit on the number of parameters and can be changed according to the size of the data. Introducing non parametric features that are not limited by numerical limitations into the model can greatly enhance the model’s expressive power and interpret any signal. By using Bayesian learning technology, it can directly learn the number of features of the model from the observed data, so that it can better interpret and characterize the actual data. Due to its various advantages, it has received increasing attention in recent years. For complex models with large amounts of data, non parametric Bayesian methods can effectively overcome the difficulty of parameter setting. At the same time, it has also corrected the defects of “overfitting” and “incomplete fitting” in conventional parameter Bayesian models. Non parametric Bayes aims to provide a number of parameters that can describe complex distributions and signals, so that they only have a small portion in the infinite dimensional parameter space, and this small portion would also grow with the growth of the data.
The essence of non parametric Bayesian modeling method is to use non parametric modeling methods within the framework of Bayesian theory, by adjusting the dimensionality of the parameter space to enhance its expressive power. It is combined with actual observation to achieve learning and selection of the optimal parameters. The non Bayesian model is a statistical model that does not need to set parameter conditions in advance. Its characteristic is that the parameter conditions are set on the width distribution, and the traditional width distribution is replaced by the width distribution. It can directly learn the characteristic parameters of the width distribution according to the sample data, and has strong flexibility and applicability.
Challenges of high-dimensional data
In high-dimensional data analysis, the number of variables is usually much greater than the number of samples. In this case, traditional statistical learning methods may fail. For example, in linear regression, when the number of variables is greater than the number of samples, the model cannot be solved. In addition, high-dimensional data typically has features such as sparsity and low dimensional structure, which traditional parameter models find difficult to model simultaneously [7, 8]. Non parametric Bayesian method is a Bayesian method that can adaptively learn model complexity. The traditional Bayesian method controls the complexity of the model by setting a prior distribution, but usually requires selecting appropriate prior distribution parameters. The non parametric Bayesian square rule can adaptively learn the complexity of the model without making assumptions about prior distributions. This method can avoid overfitting and underfitting problems and usually performs well when dealing with complex data.
Cluster analysis
Cluster analysis is the process of dividing data into different groups or clusters, and non parametric Bayesian methods play an important role in cluster analysis, especially in high-dimensional datasets. Traditional clustering methods such as k-means and Hierarchical clustering usually need to specify the number of clusters or distance threshold, but this is often difficult in high-dimensional data. Non parametric Bayesian methods such as Dirichlet process Mixture model and infinite Mixture model can automatically determine the number of clusters, and can effectively process high-dimensional data [9, 10].
Dirichlet process Mixture model is a nonparametric Bayesian method for clustering analysis. It uses the Dirichlet process as a prior distribution to automatically determine the number of clusters and can effectively process high-dimensional data [11, 12]. The formula of the Mixture model of the Dirichlet process is as follows:
Among them,
Classification analysis is the process of dividing data into different categories or labels, and non parametric Bayesian methods are also widely used in classification analysis. Traditional classification methods such as support vector machine (SVM) and decision tree usually need to determine the feature space or decision boundary in advance, while non parametric Bayesian method can flexibly model the feature space and automatically learn the decision boundary. For example, the infinite hybrid Naive Bayes classifier based on Dirichlet process can effectively classify high-dimensional data and has good generalization ability.
Regression analysis
Regression analysis is the process of establishing a relational model between input variables and output variables. Non parametric Bayesian methods are also widely used in regression analysis. Traditional regression methods such as linear regression and ridge regression typically require assumptions about model parameters, while non parametric Bayesian methods can flexibly model model model parameters. For example, nonparametric Bayesian regression based on Gaussian process can flexibly model high-dimensional data and provide uncertainty estimates for prediction.
In high-dimensional data regression, nonparametric Bayesian regression based on Gaussian process can flexibly model model parameters and handle complex nonlinear relationships [13, 14]. The prediction model of non parametric Bayesian regression is as follows:
Among them,
Feature selection is the process of selecting the most relevant or representative features from high-dimensional data. Non parametric Bayesian methods also have important applications in feature selection [15]. Traditional feature selection methods such as Chi-squared test and mutual information usually need to make assumptions or set thresholds for features. Non parametric Bayesian methods can automatically select features through model learning, and can deal with noise and redundant features in high-dimensional data. For example, the feature selection method based on Bayesian sparse linear model can automatically select the most relevant features from high-dimensional data, and has a certain degree of sparsity.
In high-dimensional data feature selection, the nonparametric Bayesian method based on Bayesian sparse linear model can automatically select the most relevant features from high-dimensional data, and has a certain degree of sparsity. The model of this method is as follows:
In the formulas,
Anomaly detection is the process of identifying data points that do not match normal patterns, and non parametric Bayesian methods are also widely used in anomaly detection. Traditional anomaly detection methods such as distance based or density based methods typically require modeling of normal patterns. Non parametric Bayesian methods can flexibly model normal patterns and identify unknown abnormal patterns. For example, a clustering method based on the Dirichlet process can treat unclassified data points as outliers, thereby achieving anomaly detection [16].
The application of nonparametric Bayesian method in high-dimensional data analysis involves cluster analysis, classification analysis, regression analysis, feature selection, anomaly detection and other aspects. These methods can overcome the limitations of traditional methods that require specifying parameters or assuming distributions, and can flexibly model and analyze high-dimensional data [17]. This article aims to explore the application of non parametric Bayesian methods in high-dimensional data analysis, as shown in Fig. 1, which is the overall framework of this article.
Overall framework.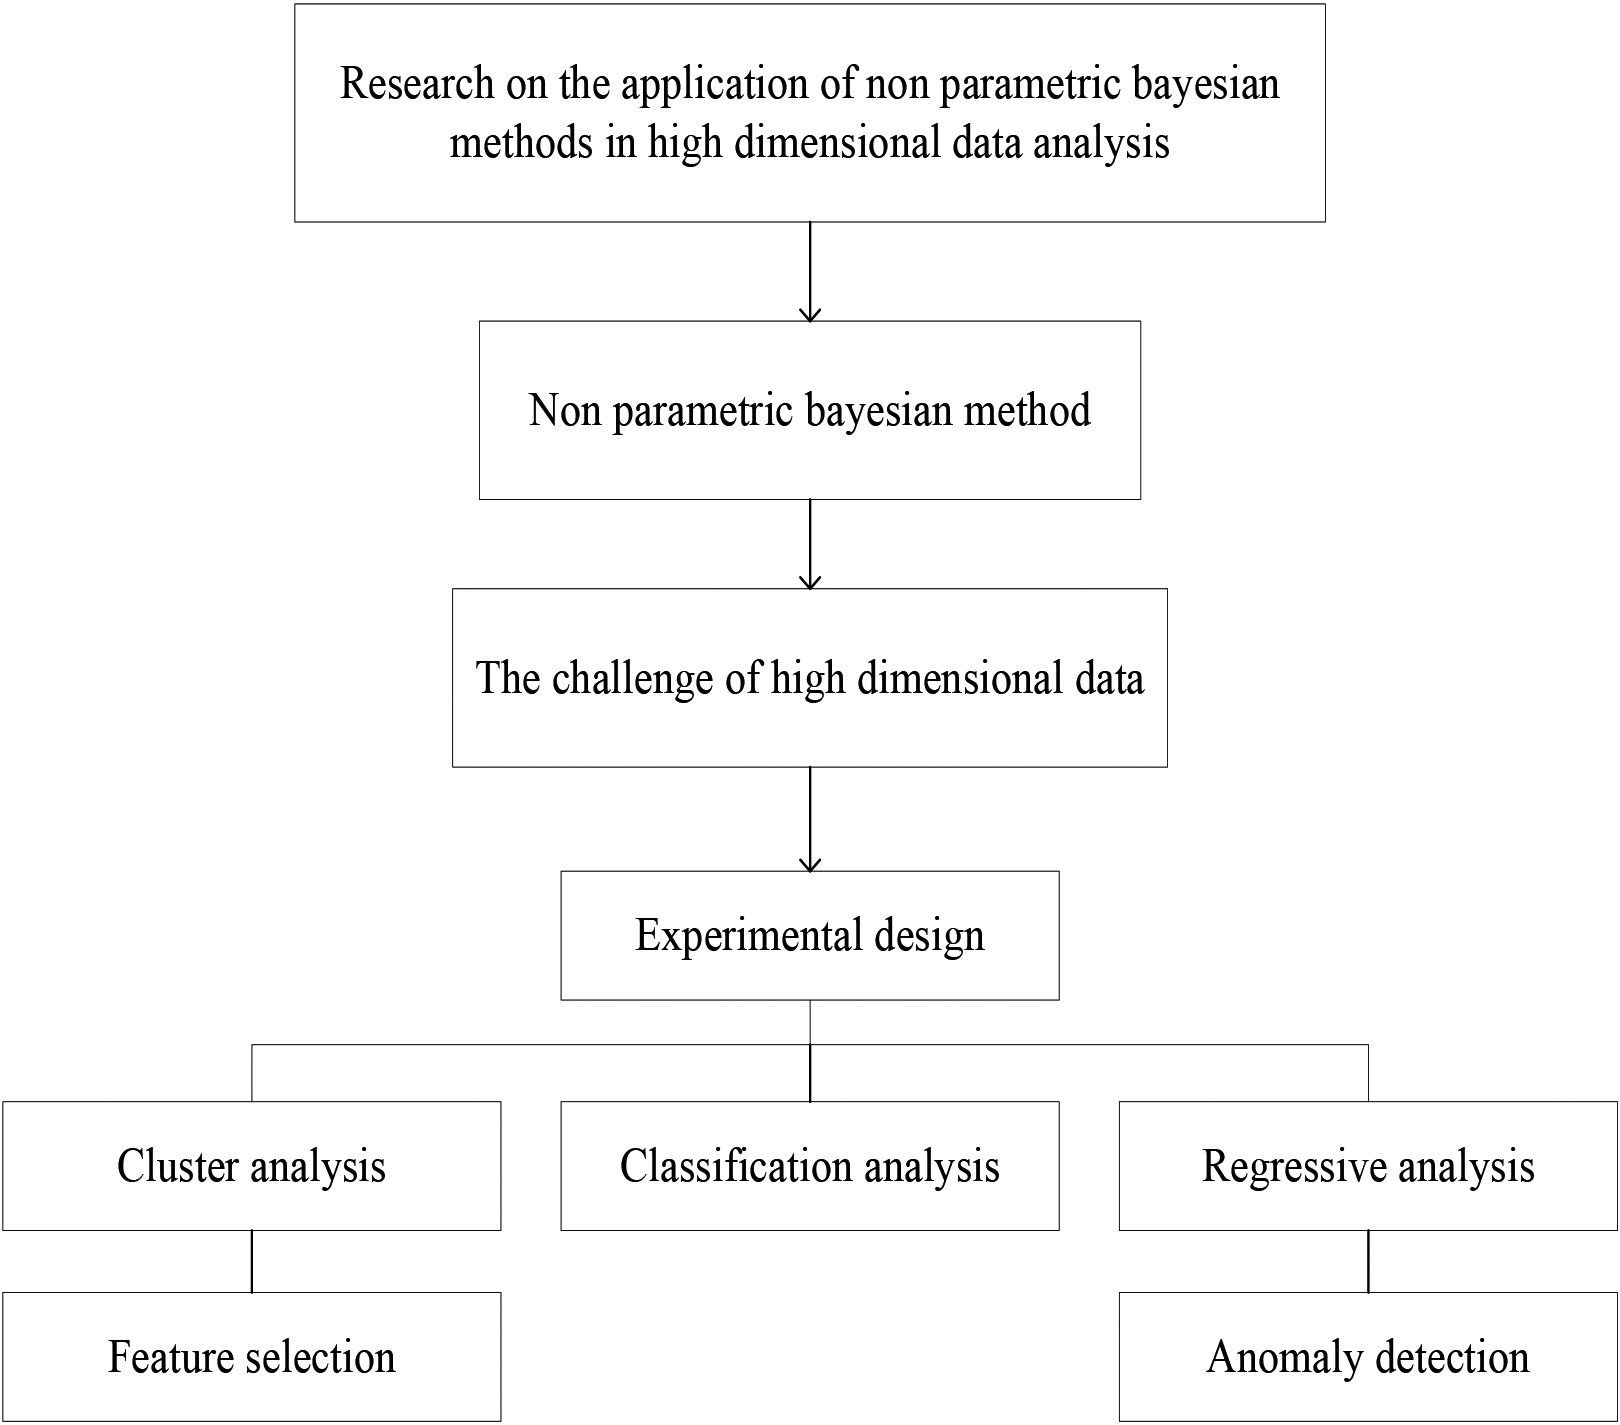
Experimental design
With the development of technology and the widespread collection of data, high-dimensional data analysis is becoming increasingly important. Traditional parameterized models have some limitations in dealing with high-dimensional data, such as the need to manually select appropriate model structures and the tendency to overfit. In order to solve these problems, non parametric Bayesian methods have emerged. Non parametric Bayesian methods do not require prior determination of model structure, but instead adaptively adjust model complexity through data, improving the flexibility and adaptability of the model. At the same time, by using Probability theory and Bayesian statistics, nonparametric Bayesian methods can also better deal with uncertainty and noise.
This article aims to compare the effectiveness of non parametric Bayesian methods and traditional parameterization methods in high-dimensional data analysis. Specifically, in the experiment, this paper would design five groups of contrast experiments to compare the performance differences in clustering analysis, classification analysis, regression analysis, feature selection and anomaly detection.
To ensure the repeatability and fairness of the experiment, this article adopts the method of random data generation. This article generates high-dimensional data with different dimensions and densities, and adds a certain proportion of noise and outliers to it. The data generation process follows the following principles: the sample size is moderate and can reflect the performance differences of various methods. The number of dimensions is rich, including different situations such as low dimensionality, high dimensionality, density, and sparsity. The sample distribution is in line with actual scenarios, such as generating data that conforms to Gaussian distribution in clustering analysis. The appropriate number of noise and outliers can verify the robustness of various methods.
For the three sets of experiments of cluster analysis, classification analysis, and regression analysis, this article divides the dataset into two parts: a training set and a testing set to verify the predictive ability of various algorithms for new data. This article adopts a 5-fold cross validation method to evenly divide the dataset into five subsets. Each subset serves as a test set, while the other four subsets serve as training sets. For each subset, it runs the algorithm on the training set, then makes predictions on the test set, and evaluates the prediction performance with corresponding indicators. For the two experiments of feature selection and anomaly detection, this paper does not divide the training set and test set. On the contrary, this article directly runs the algorithm on the entire dataset and compares the results with the true values to calculate various indicators. The results of ten tests are used as the performance of the algorithm on this dataset.
Experimental results
Cluster analysis comparison
Cluster analysis is a unsupervised learning method, which is mainly used to classify similar data points. In high-dimensional data analysis, clustering analysis can help discover internal structures and patterns in the data, thereby better understanding and processing the data. The traditional K-means clustering algorithm is a parameterized method that requires specifying the number of clusters k and assuming that the distribution of each category is Gaussian. The non parametric Bayesian clustering algorithm does not need to specify the number of clusters in advance, and it determines the number and distribution of each category by learning the distribution of the data itself. Therefore, the non parametric Bayesian clustering algorithm has good adaptability when the data structure is unknown.
This article generated 1000 samples, each containing a high-dimensional dataset of 1000 dimensions. The dataset is divided into 10 categories, each containing 100 samples. Cluster accuracy, contour coefficient, and runtime can be used as comparison indicators. The comparison of clustering analysis is shown in Fig. 2. Figure 2(a) shows the non parametric Bayesian clustering algorithm, and Fig. 2(b) shows the traditional K-means clustering algorithm. The horizontal axis of the graph represents the number of tests, and the vertical axis represents the numerical value of the indicator. Table 1 shows the mean values of clustering analysis indicators.
Cluster analysis index mean
Cluster analysis index mean
Cluster analysis comparison. (a) shows the non parametric Bayesian clustering algorithm. (b) shows the traditional K-means clustering algorithm.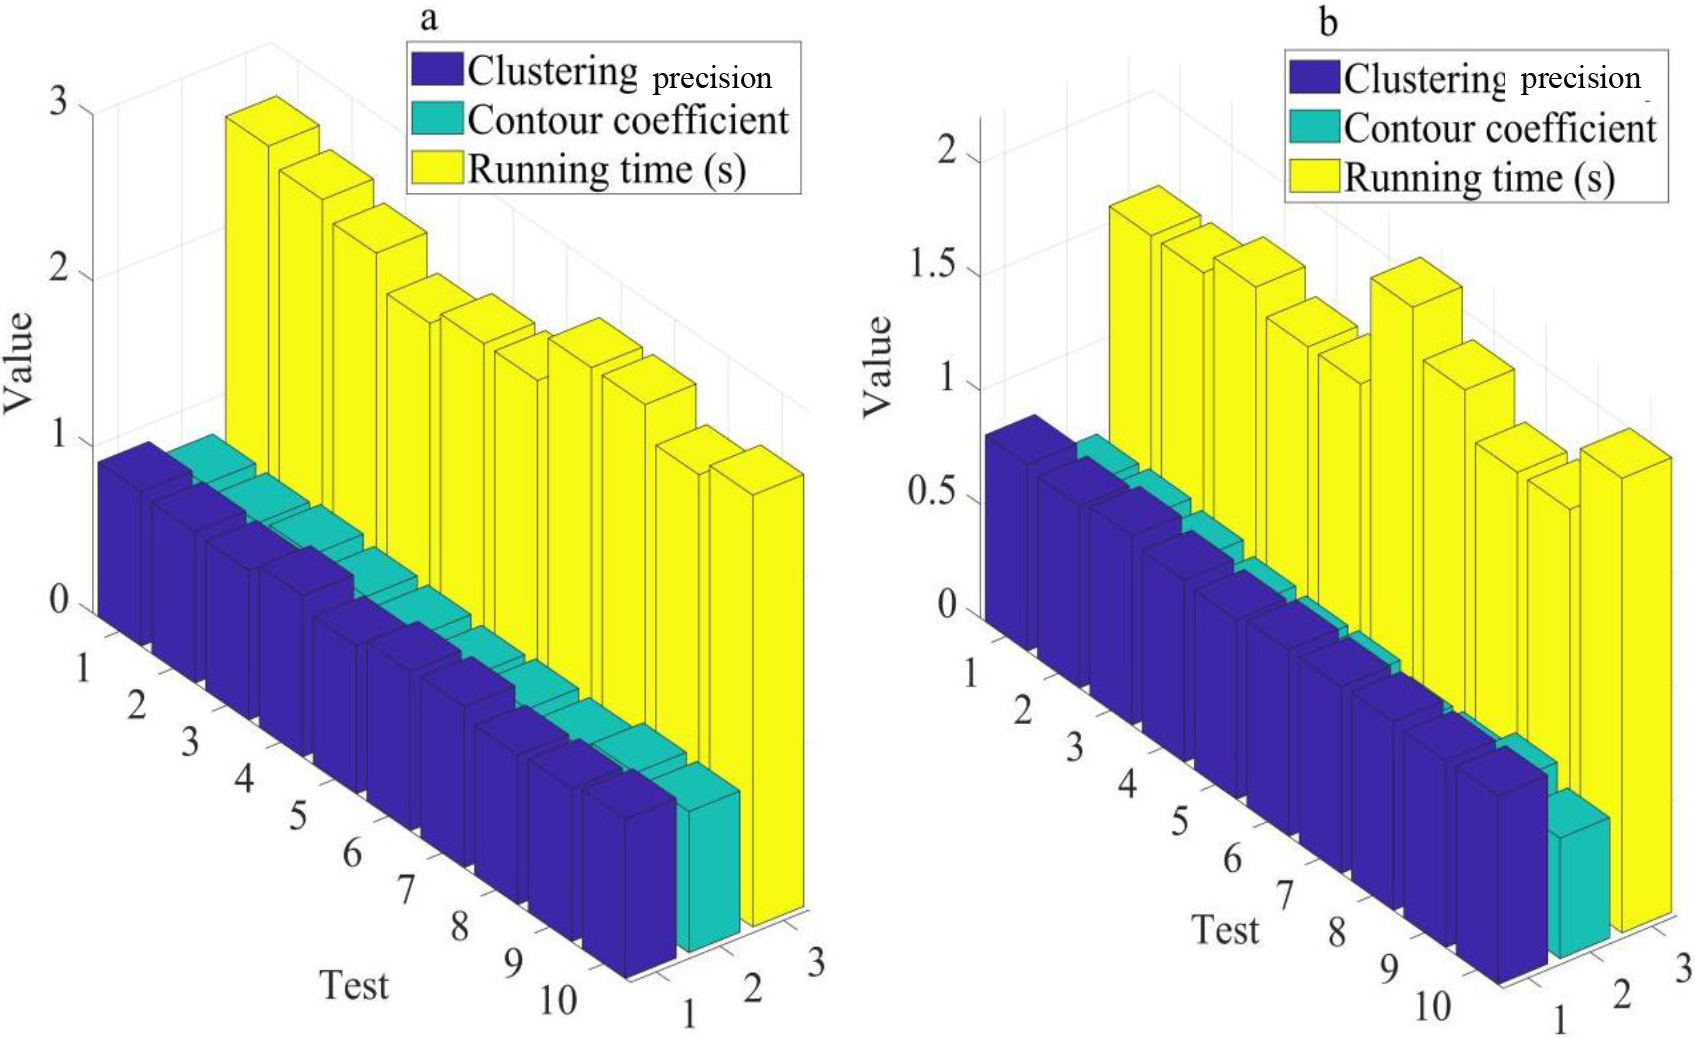
The clustering accuracy of the non parametric Bayesian clustering algorithm was 0.93, the contour coefficient was 0.82, and the running time was 2.5 seconds; the traditional K-means clustering algorithm had a clustering accuracy of 0.82, a contour coefficient of 0.58, and a running time of 1.8 seconds. The non parametric Bayesian clustering algorithm has significant advantages in clustering accuracy and contour coefficients compared to traditional K-means clustering algorithms, but its running time is slightly longer. Therefore, non parametric Bayesian clustering algorithms have certain advantages in high-dimensional data analysis.
Classification analysis is a supervised learning method that uses data sets of known categories to predict new data categories. In high-dimensional data analysis, classification analysis can be used to identify different features and attribute labels of the data. The traditional support vector machine classification algorithm is a parametric method, which determines the hyperplane by minimizing the classification error, and needs to specify parameters such as kernel function and hyperparameters. Non parametric Bayesian classification algorithms, on the other hand, do not need to specify hyperparameters and kernel functions in advance, nor do they need to know the distribution of data, so they have better robustness and generalization ability.
This article generated 1000 samples, each containing a high-dimensional dataset of 1000 dimensions. Among them, 50% are positive examples and 50% were negative examples. This article uses Gaussian distribution for generation, which uses accuracy, recall, and F1 value as comparative indicators. As shown in Fig. 3, the classification analysis comparison is presented. Figure 3(a) shows the non parametric Bayesian clustering algorithm, and Fig. 3(b) shows the traditional SVM classification algorithm. The horizontal axis represents the test indicators, and the vertical axis represents the numerical values of the test indicators.
In ten tests, the accuracy of the non parametric Bayesian classification algorithm was between 0.93 and 0.99; the recall was between 0.95 and 0.99; the F1 value was between 0.93 and 0.99; the accuracy of traditional SVM classification algorithms was between 0.89 and 0.95; the recall was between 0.9 and 0.95; the F1 value was between 0.9 and 0.94. The non parametric Bayesian classification algorithm performs slightly better than traditional SVM algorithms in terms of accuracy, recall, and F1 value.
Regression analysis comparison
Regression analysis is a statistical method used to study the relationship between variables. In high-dimensional data analysis, regression analysis can be used to predict a specific variable value and explore linear or nonlinear relationships between variables. The traditional linear regression algorithm is a parametric method, which determines the coefficients of the linear regression model by minimizing the residual sum of squares. The non parametric Bayesian regression algorithm does not need to assume the functional form and model structure of the regression equation in advance, and it is self-learning from the data.
Mean value of regression analysis indicators
Mean value of regression analysis indicators
Classification analysis comparison. (a) shows the non parametric Bayesian clustering algorithm. (b) shows the traditional SVM classification algorithm.
This article generated 1000 samples using a linear model and added a certain level of noise to simulate actual scenarios. Mean squared error (MSE), Mean absolute error (MAE) and Coefficient of determination (
The MSE of the non parametric Bayesian regression algorithm was 0.06; MAE was 0.04; R2 was 0.98. The MSE of traditional linear regression algorithms was 0.10; MAE was 0.08; R2 was 0.85. The non parametric Bayesian regression algorithm has significant advantages over traditional linear regression algorithms in all indicators.
Feature selection is a method to select the most useful feature subset for model construction to improve model performance and reduce over fitting. In high-dimensional data analysis, feature selection can be used to reduce computational costs and improve the performance of classification or regression models. Non parametric Bayesian method is a feature selection method based on Bayesian network, which considers the correlation between features and the relationship between them and target variables. The traditional Chi-squared test test method mainly calculates the chi square value between each feature and the target variable, and selects features with high chi square value.
This article generated 1000 samples, each containing a high-dimensional dataset of 1000 dimensions, of which 50% were positive examples and 50% were negative examples, using a Gaussian distribution for generation. The traditional Chi-squared test and non parametric Bayesian feature selection methods can be used to select features, and the remaining dimensions can be input into the linear regression model as training data. The performance of these two methods can be compared using three indicators: the number of selected dimensions, classification accuracy, and runtime. As shown in Fig. 5, feature selection is compared. Figure 5(a) shows the nonparametric Bayesian clustering algorithm, and Fig. 5(b) shows the traditional Chi-squared test test method. The horizontal axis of the graph represents the number of tests, and the vertical axis represents the numerical value of the indicator. Table 3 shows the average value of feature selection indicators.
Average value of feature selection index
Average value of feature selection index
Regression analysis comparison. (a) shows the non parametric Bayesian clustering algorithm. (b) shows the traditional linear regression algorithm.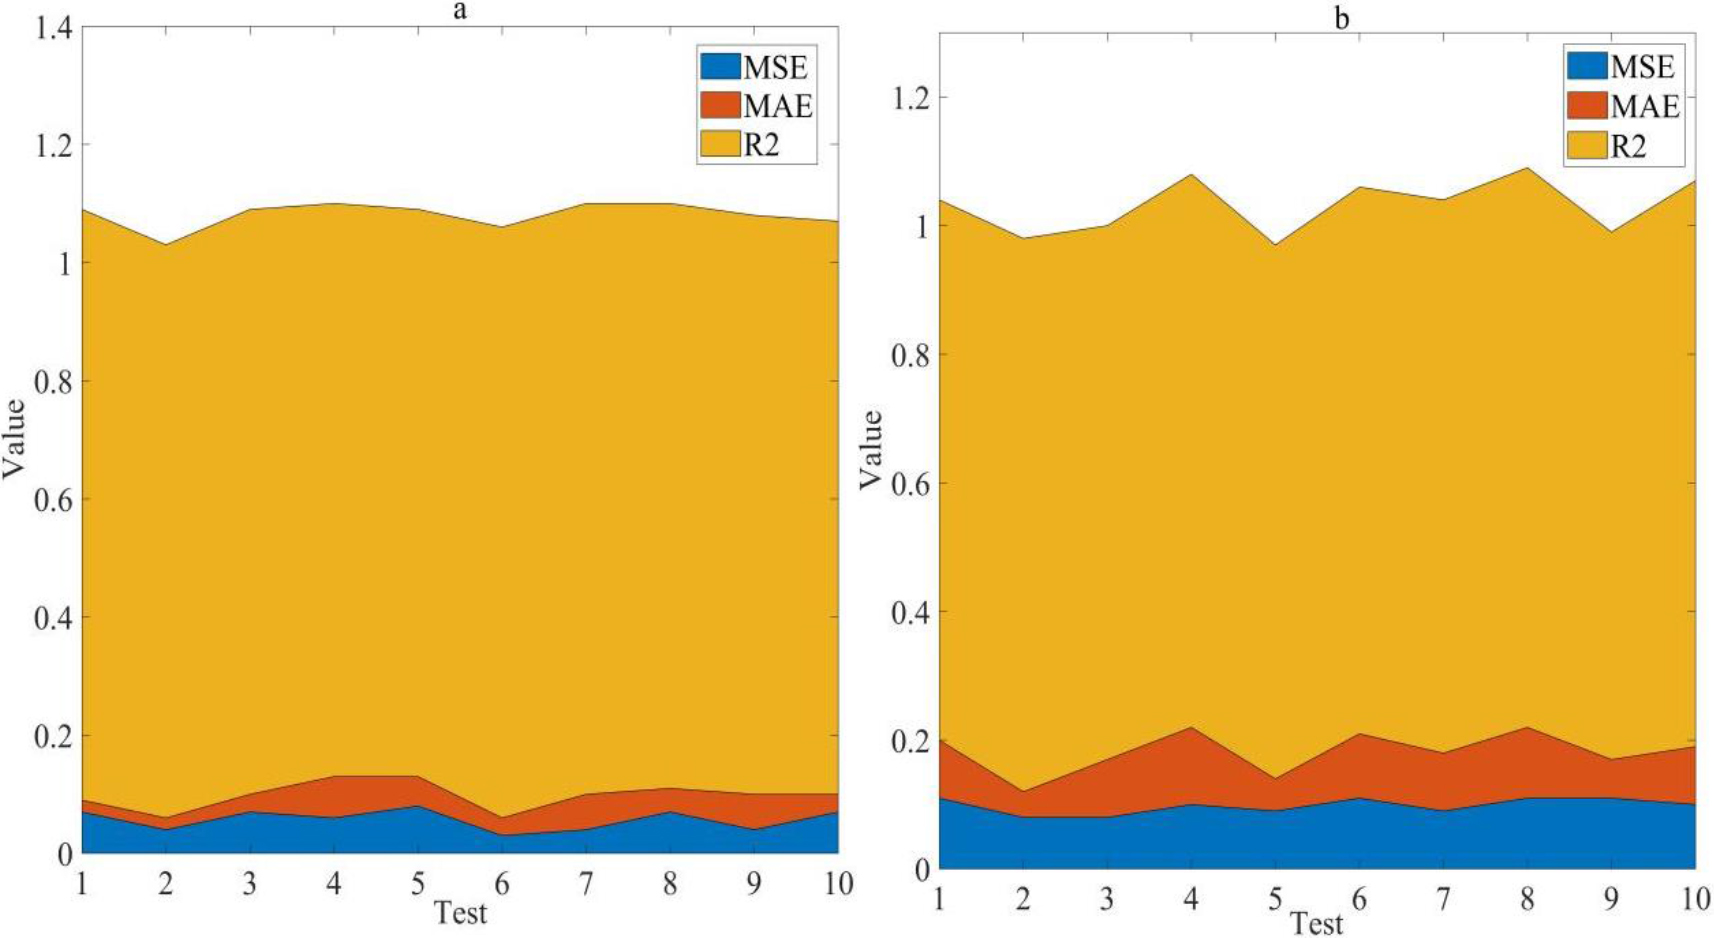
Comparison of feature selection. (a) shows the non parametric Bayesian clustering algorithm. (b) is the traditional Chi-squared test method.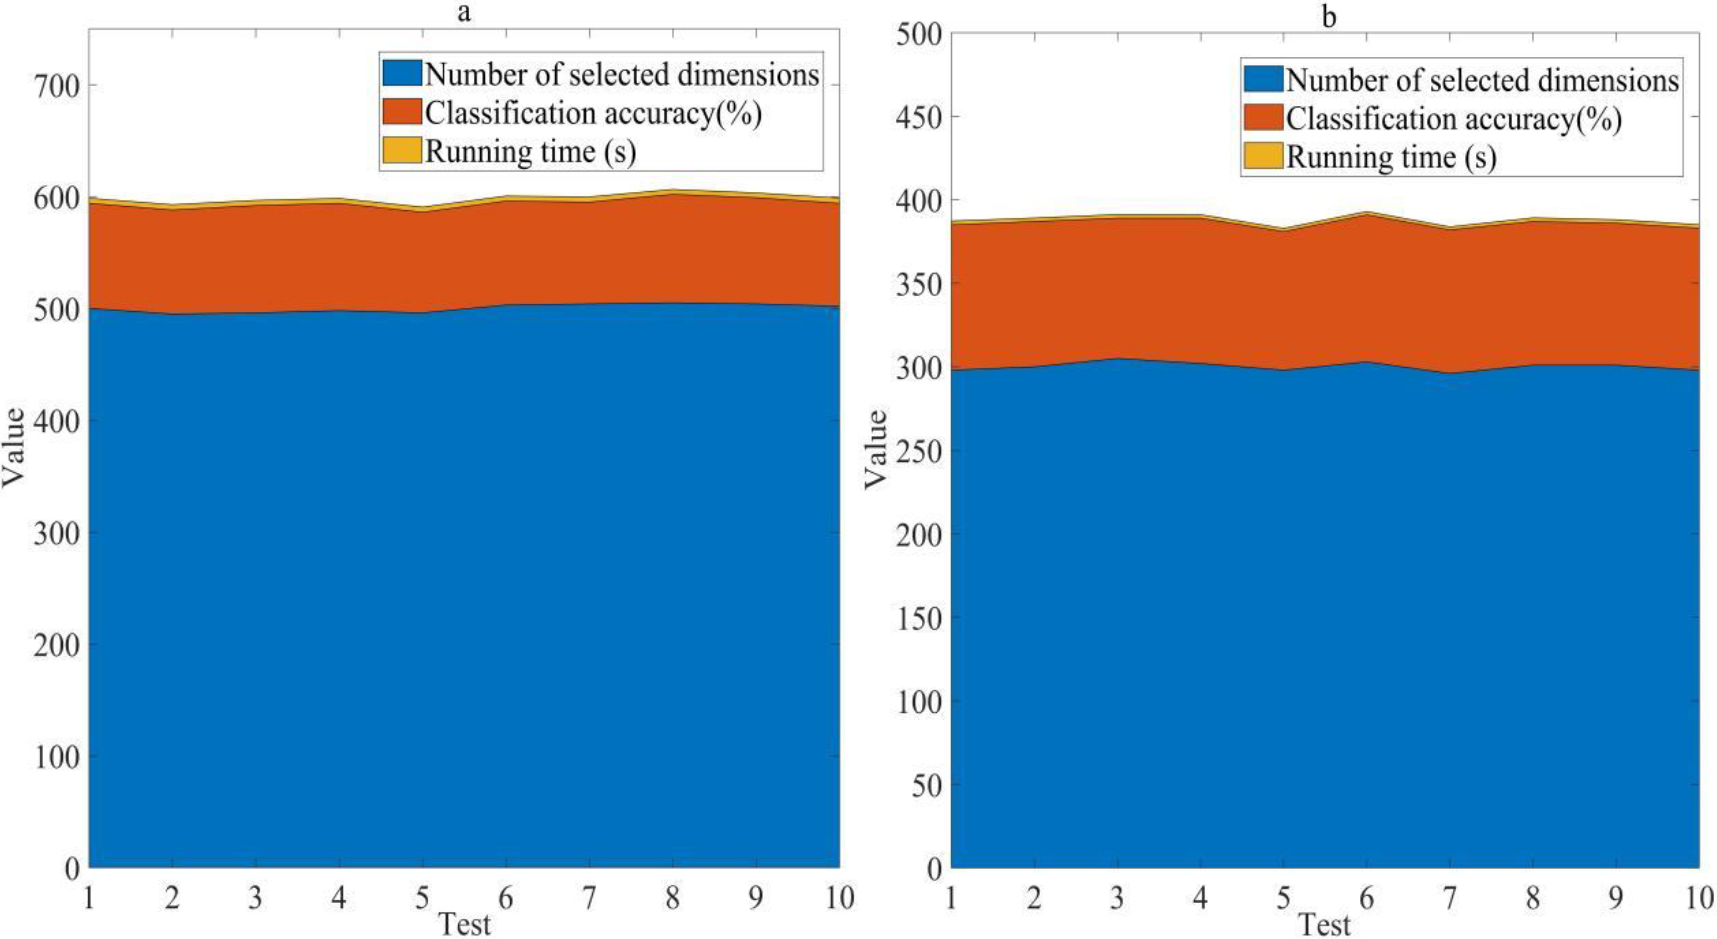
The non parametric Bayesian method selected 500 dimensions, with a classification accuracy of 94% and a running time of 4.6 seconds; the traditional Chi-squared test test selected 300 dimensions, with classification accuracy of 86% and running time of 2.1s. Compared with the traditional Chi-squared test, the nonparametric Bayesian method performs better in the number of selected dimensions and classification accuracy, but its running time is also longer.
Anomaly detection is a technique used to identify anomalies and unusual patterns or events in data. In high-dimensional data analysis, anomaly detection can be used to detect issues such as missing values, erroneous values, noise, outliers, and fraud. Non parametric Bayesian method is an anomaly detection method based on Statistical model. It can detect data points that are extremely inconsistent with the model by establishing a data distribution model. The traditional method based on distance measurement regards data points as points in Euclidean space, calculates the distance between them and other points, and determines whether they are abnormal points by setting a threshold.
This article generated 1000 samples, each containing a dataset of 1000 dimensions, with 50 samples selected as outliers. Non parametric Bayesian methods and traditional distance based methods can be used for outlier detection, and their performance in precision, recall, and F1 values can be compared. Figure 6 shows the comparison of anomaly detection, Fig. 6(a) shows the non parametric Bayesian clustering algorithm, and Fig. 6(b) shows the traditional distance metric based method. The horizontal axis represents the test indicators, and the vertical axis represents the numerical values of the test indicators.
Comparison of anomaly detection. (a) shows the non parametric Bayesian clustering algorithm. (b) shows the traditional distance metric based method.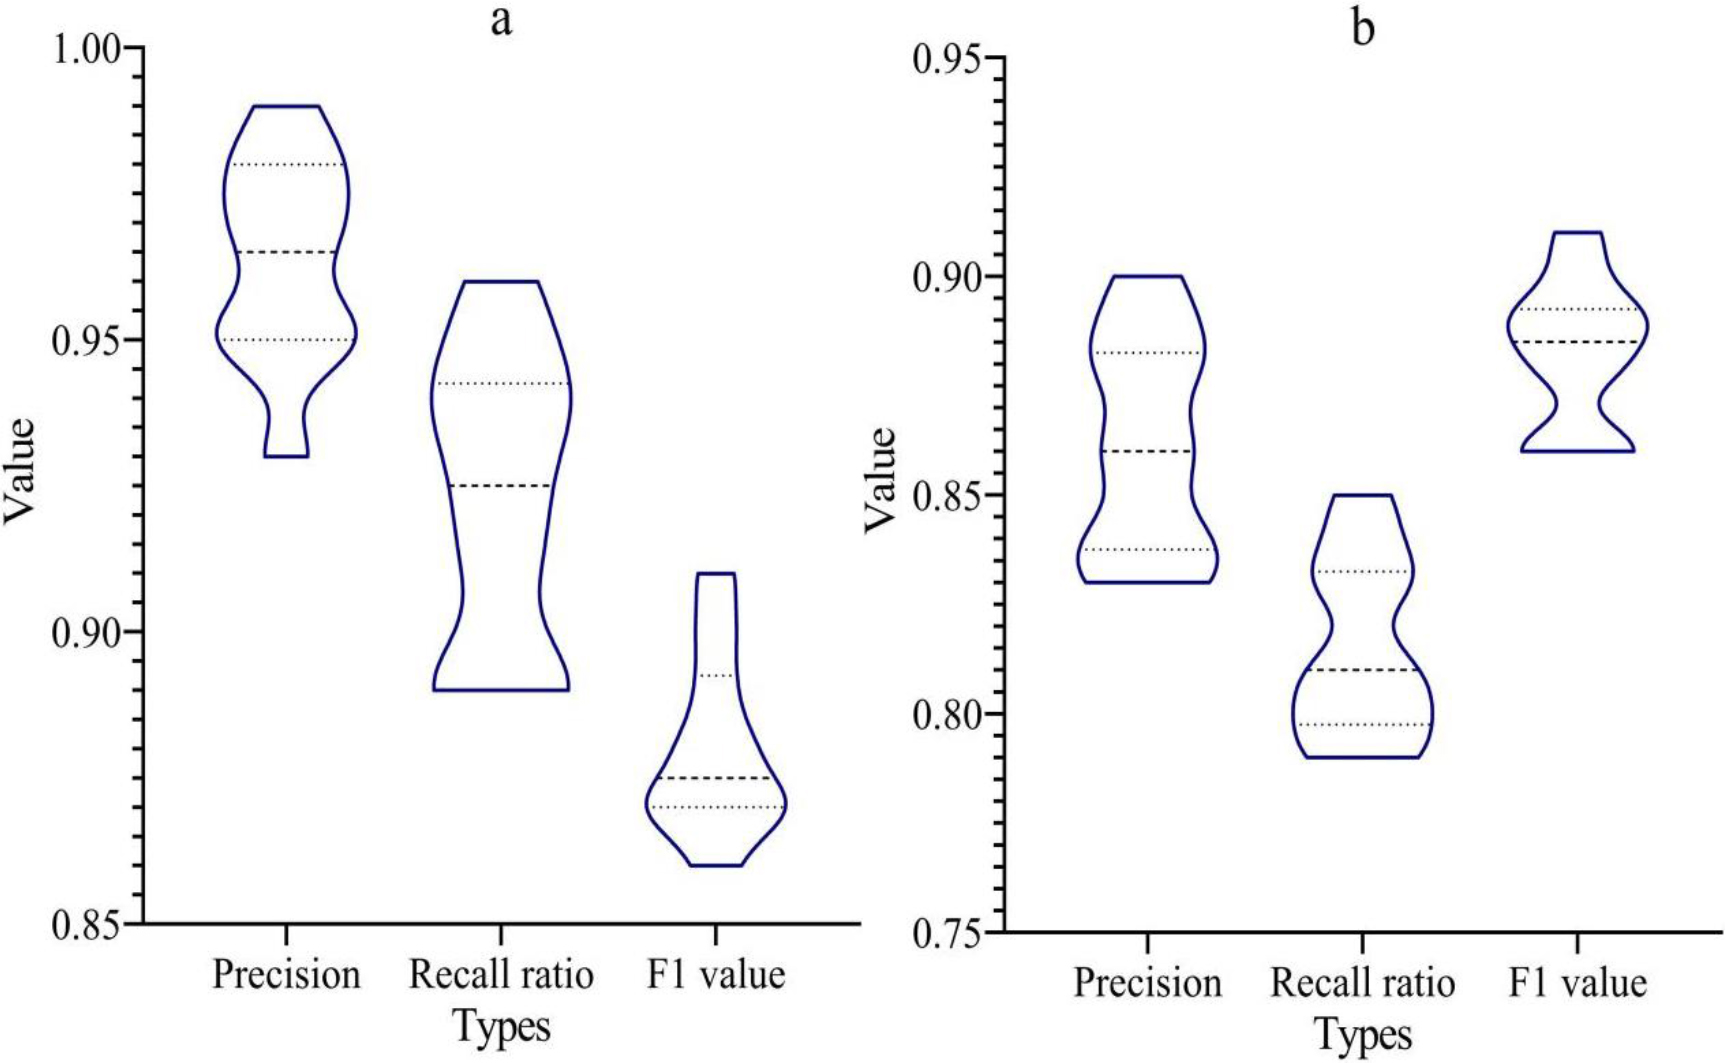
The precision of the non parametric Bayesian method was between 0.93 and 0.99, the recall was between 0.89 and 0.96, and the F1 value was between 0.86 and 0.91; the precision of traditional distance measurement based methods ranged from 0.83 to 0.9, recall from 0.79 to 0.85, and F1 values from 0.86 to 0.91. Non parametric Bayesian methods perform better in precision and recall compared to traditional distance based methods.
In summary, this article designed a series of experiments to compare the performance of non parametric Bayesian methods and traditional parameterization methods in high-dimensional data analysis. The experimental results show that the nonparametric Bayesian method has better performance in clustering accuracy, classification accuracy, regression accuracy and feature selection effect, but its running time is relatively long. Therefore, in practical applications, it is necessary to weigh the advantages and disadvantages of various methods based on specific needs and choose the most suitable method.
This article compared the effectiveness of non parametric Bayesian methods and traditional parameterization methods in high-dimensional data analysis through experimental design and result analysis. The experimental results showed that the nonparametric Bayesian method had certain advantages in clustering analysis, classification analysis, regression analysis, feature selection and anomaly detection. In clustering analysis, non parametric Bayesian clustering algorithms have significant advantages in clustering accuracy and contour coefficients compared to traditional K-means algorithms. In classification analysis, the non parametric Bayesian classification algorithm is slightly better than traditional support vector machine classification algorithms in terms of accuracy, recall, and F1 value. In regression analysis, the nonparametric Bayesian regression algorithm is obviously superior to the traditional linear regression algorithm in MSE, MAE and Coefficient of determination. In feature selection, the nonparametric Bayesian method performs better in the number of selected dimensions and classification accuracy. In anomaly detection, non parametric Bayesian methods perform better in precision and recall. Overall, non parametric Bayesian methods exhibit better performance in high-dimensional data analysis, especially in areas such as unknown data structures, adaptive adjustment of model complexity, and processing of uncertainty and noise. However, the running time of non parametric Bayesian methods is relatively long, and it is necessary to weigh their advantages and disadvantages in practical applications and choose a suitable method. In summary, non parametric Bayesian methods provide a flexible, adaptive, and effective tool for high-dimensional data analysis, which can help better understand and process complex high-dimensional data. Further exploration and improvement of the performance of non parametric Bayesian methods would be of great significance in future research and applications. With the popularization of the Internet and the continuous advancement of data sharing, there would be more high-dimensional data available for analysis and utilization in the future. In this case, non parametric Bayesian methods would become one of the important tools to extract useful information from complex data, identify potential patterns, and make more accurate and reliable predictions.