
Abstract
Major issues found in large scale wireless sensor networks are energy consumption of sensor nodes, redundant data transmission by neighbouring nodes, outlier generation due to unwanted event sensing and node failure. To address these issues, a novel Energy Efficient Routing and Fault Tolerant Data Aggregation (EERFTDA) algorithm is proposed. The key aspects of the proposed algorithm are reliable data aggregation and transmission by eliminating outlier and redundant data using locality sensitive hashing. Another advantage of the proposed algorithm is the bottleneck problem near sink nodes is overcome by the election of relay nodes based on residual energy. The performance of proposed algorithm is analyzed and compared with Data Routing for In-Network Aggregation (DRINA) algorithm for QoS parameters like delay, packet delivery ratio, energy efficiency and aggregation accuracy. The results indicate that EERFTDA provides improved aggregation accuracy and energy efficiency.
Introduction
A large set of autonomous low-cost, low-power and multifunctional wireless sensor nodes form a self-organized distribution system (without any complex structure) referred as Wireless Sensor Networks (WSNs). These sensor nodes coordinate, monitor, sense and collect environmental conditions automatically. They have a wide range of applications in the areas such as environmental monitoring, domestics, meteorology, agriculture, space, health, and military field surveillance [11,12,24,25]. Despite its wide range of applications, there are many challenges in wireless sensor networks such as high energy consumption, scheduling, target localization, fault diagnosis, security, etc. Energy efficiency is considered to be the most important issue among them. The sensor nodes in WSN spend maximum time in sleep mode in order to save power and increase its lifetime. The limited energy resources to the sensor node make them an ideal target for battery drain attacks. Hence, energy is considered to be an asset and it need to be constantly measured and conserved. Routing, data aggregation, network coding, sleep scheduling, green energy-aware security (GEAS), etc., are prominent techniques for improving energy efficiency in WSN [16]. The hierarchical routing is the most commonly used routing technique. Based on the structure, this routing is classified into tree-based and cluster-based routing. The cluster-based routing uses the data aggregation protocols and is prominently used for energy conservation algorithms.
Data aggregation is the process of gathering and aggregating data from multiple sensors to reduce the number of transmissions. It involves fusion of data from multiple sensors at intermediate nodes and transmission of aggregated data to the sink node. The data aggregation is done at the cluster heads and/or the relay nodes based on the application of the network. The commonly used data aggregation mechanisms are SUM, MAX, MIN, COUNT, AVG, etc [4]. Some of the other data aggregation mechanisms include detection and elimination of outlier and redundant data [19]. The data aggregation protocols are classified based on structure and structure-free networks. In structured-based data aggregation protocols, a tree or cluster-based structure is built during network initialization phase for efficient data gathering. These structures perform well in stable environment. However, there are certain drawbacks in structured aggregation techniques such as: (i) Nodes may move or fail unpredictably in a more practical environment; (ii) The construction and maintenance overhead of structure may offset the data aggregation benefits for dynamic situations; (iii) waiting small period at intermediate nodes, causes smaller number of aggregations and a long period results in higher latency. Comparatively, structure free aggregation is preferred, which rarely spends energy on building any structure. The advantages of structure free solutions are controlled average delay, limited maintenance overhead, and better robustness even if there are node failures. The structure free solutions gain better performance during low aggregation efficiency or high network density condition [6]. The challenges in structure free aggregation are: Routing decisions for efficient packet aggregation should be in progress due to lack of pre-constructed structure; Nodes are unaware of their upstream nodes, hence could not openly wait on data from any node without forwarding its own data [13,22]. The proposed EERFTDA algorithm combines the advantages of both structured and structure free data aggregation.
In addition to the need for energy efficient data aggregation, most of the applications in WSN require real-time data mining. Real time data mining is limited by the presence of Outliers and redundant data. Identifying the outliers and providing fault tolerance in the network are considered to be important issues in wireless sensor networks. Outliers are the measurements that deviate from the normal pattern of data sensed by the nodes in a network [5]. The major sources of outliers are compromised sensor nodes, exhausted batteries, imperfect sensing devices, harsh environments, unwanted event sensing, etc., [3,19]. Some of the prominent outlier detection techniques are based on statistical, clustering, classification, spectral decomposition, near neighbour, etc. The most commonly used outlier detection techniques are Kernel density estimation, Locality sensitive hashing, Rough set theory, Support vector machine, etc. [19]. In the proposed algorithm, Locality sensitive hashing is used for detecting the outlier data and redundant data.
The proposed algorithm EERFTDA works in four phases during which the nodes temporarily form a cluster, on sensing an event. Data aggregation is performed by cluster head by eliminating the outlier and redundant data and the data is transmitted to the sink node. The performance of the algorithm is analyzed and compared with Data Routing for In-Network Aggregation (DRINA) algorithm for QoS parameters like delay, packet delivery ratio, energy efficiency and aggregation accuracy. Section 2 summarizes the related work; Section 3 explains the proposed algorithm; Section 4 describes the performance evaluation; and Section 5 concludes the paper.
Related work
In this section, prominent research work focussing on data aggregation is presented. In [21], a novel Data Routing for In-Network Aggregation, (DRINA) which involves limited number of messages to set up a routing tree, higher number of overlapping routes, high aggregation rate, and reliable data aggregation and transmission is proposed. The aggregation quality provided by the DRINA routing tree is best when compared to other algorithms. However, DRINA algorithm requires, on average, 25 percent more control messages than the Shortest Path Tree (SPT) algorithm.
In [9], the authors have proposed techniques for data aggregation without explicit structures. Two corresponding mechanisms namely, Data-Aware Anycast at the MAC layer for spatial convergence and Randomized Waiting at the application layer for temporal convergence are modelled. On combining these mechanisms together, there are more contention losses. In [23], an efficient structure-free algorithm is proposed accompanied with a real-time routing, RAG to save energy by data aggregation. Two mechanisms were utilized for temporal and spatial convergence of packets as follows: A Judiciously Waiting policy and A Real-time Data-aware Anycasting policy at the MAC layer processing the routing decisions for efficient aggregation of data as there is no pre-constructed structure. However, the miss ratio increases on increasing the data rate.
In [22], the authors have designed a novel structure-free Real-time Data Aggregation protocol, RDAG, using a Real-time Data-aware Routing policy and a Judiciously Waiting policy for spatial and temporal convergence of packets. Energy is conserved in this protocol by considering spatial and temporal convergence of packets without incurring the overhead of constructing a structure while meeting the desired level of timeliness. But when traffic increases, the miss ratio and contention increases; resulting in longer queuing delays and congestion at intermediate nodes. In [6], a structure-free and energy-balanced (SFEB) data aggregation protocol is proposed, featuring both efficient data gathering and balanced energy consumption, due to its two-phase aggregation process and the dynamic aggregator selection mechanism. The data aggregation was scheduled among the aggregator neighbours and energy balance mechanism was suggested; though there is delay and additional overhead in SFEB-CL.
In [19], the authors presented a fault-tolerant data aggregation scheme to avoid the false data sent by malfunctioning and/or compromised sensor nodes. A locality sensitive hashing was used for detecting outlier data. In [8], a completely structure free aggregation system is proposed. Fuzzy reasoning was employed to make aggregation decisions relying on a flexible and extensible set of application. In [15], a survey on energy-aware security mechanisms for WSN is presented. The sensor nodes spend maximum time in sleep mode in order to conserve energy. The limited energy nodes become an ideal target for the malicious nodes, as it would be forced to get out of the sleep mode and the lifetime of the node is reduced by the sleep-deprivation attack or denial-of-sleep. Hence the energy is considered to be an asset and is constantly measured. This leads to prevention of attacks aiming at depleting power of nodes and the energetic behaviour of the node acts as an indicator to monitor such malicious activities in the network.
In [1], energy aware routing (ERA) protocol for cluster based WSN is proposed. The data routing is facilitated by constructing a directed virtual backbone of cluster heads (CHs) routed to the sink. It is inferred that the energy consumption of the CHs remains balanced during the routing process. The simulations are performed for both random and grid node deployments and the lifetime of the network are maximized. In [2], the authors have proposed an energy efficient Distributed fault tolerant clustering and routing (DFCR) protocol. The cluster formation is based on the residual energy and the distance between the sink and the cluster head. However, for fault tolerance, only permanent failure of the cluster head is considered.
Most of the algorithms proposed in the literature focus on energy efficient algorithms to increase the lifetime of WSN. However, there is a need to focus on fault tolerant data aggregation along with energy efficient design. Hence the proposed algorithm focuses on energy efficient fault tolerant design by using clustering and data aggregation techniques.
Energy Efficient Routing and Fault Tolerant Data Aggregation (EERFTDA)
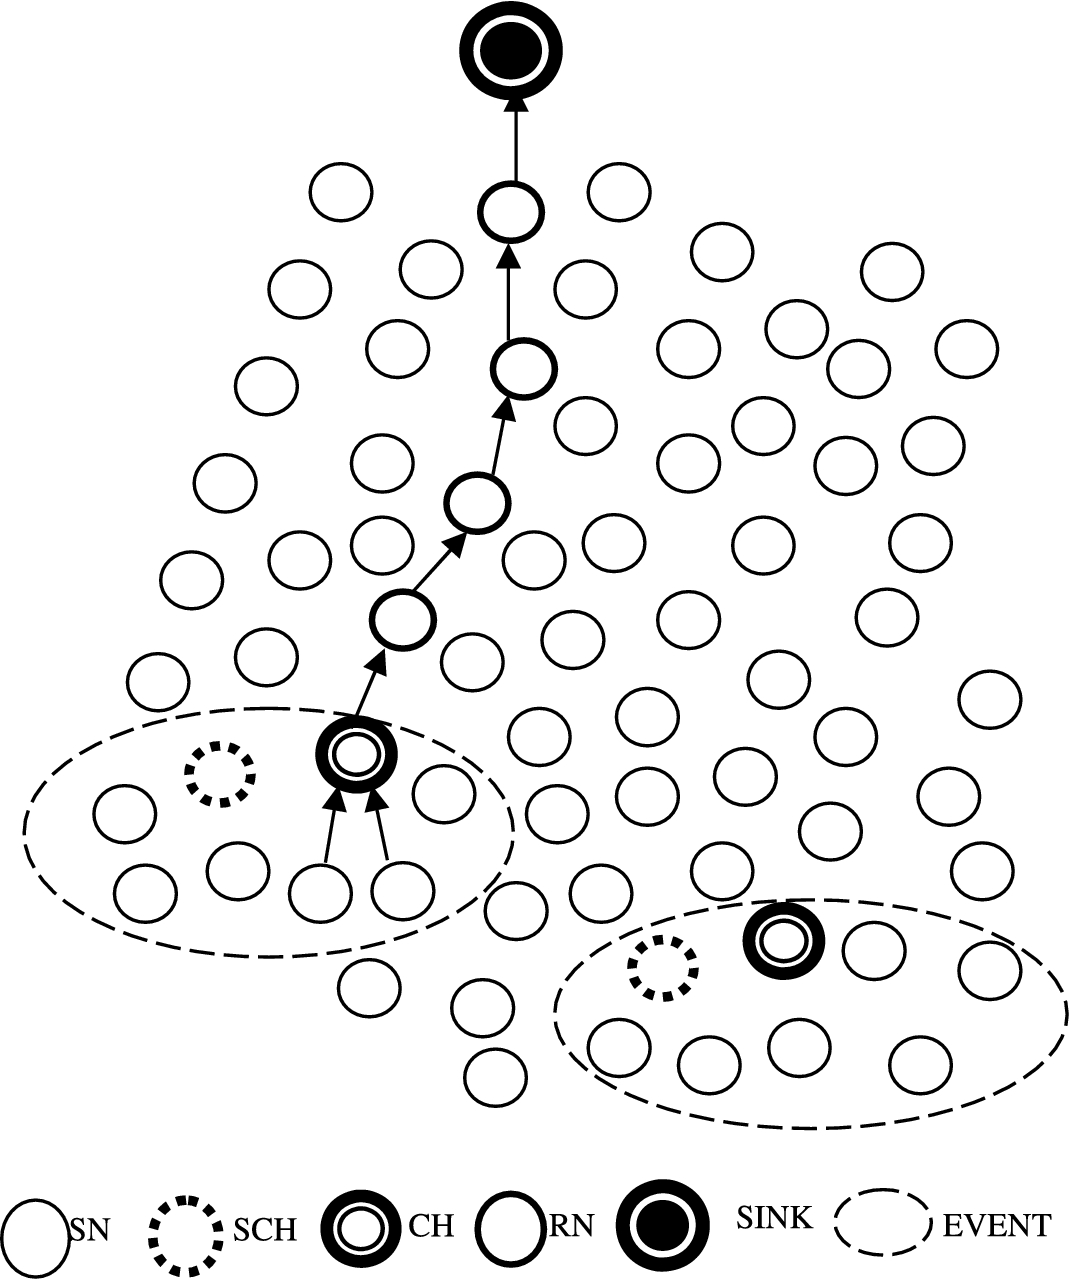
The key aspect of the proposed algorithm is to perform reliable data aggregation and transmission by eliminating the outlier and redundant data. The EERFTDA algorithm considers the following functions of the nodes during the cluster formation and route establishment as shown in Fig. 1.
Sensor Node (SN): This node detects the event and reports the collected data to the cluster head.
Cluster-Head (CH): This node performs data aggregation by eliminating the outlier and redundant data using the locality sensitive hashing technique.
Secondary Cluster-Head (SCH): This node supports the primary head in case of network congestion or failure.
Sink: It receives all the data sent from a set of cluster-head and relay nodes.
Relay: This node helps to forward data towards the sink.
Cluster formation and route establishment in EERFTDA.
The DRINA algorithm includes three phases namely, building hop tree, cluster formation and route establishment and maintenance to implement data transfer in large scale WSNs. In this paper, the proposed algorithm considers election of secondary cluster head election apart from the cluster head election; data aggregation using outlier and redundant data elimination; election of relay nodes based on residual energy of neighbouring nodes, due to which the proposed EERFTDA algorithm is efficient. The proposed algorithm EERFTDA works in four phases. In Phase 1, the hop tree is built. In Phase 2, clusters are formed and the cluster heads are elected. In Phase 3, the Data aggregation is using the Locality Sensitive Hashing technique. In Phase 4, relay nodes are elected based on residual energy and routing is done through the energy efficient paths.
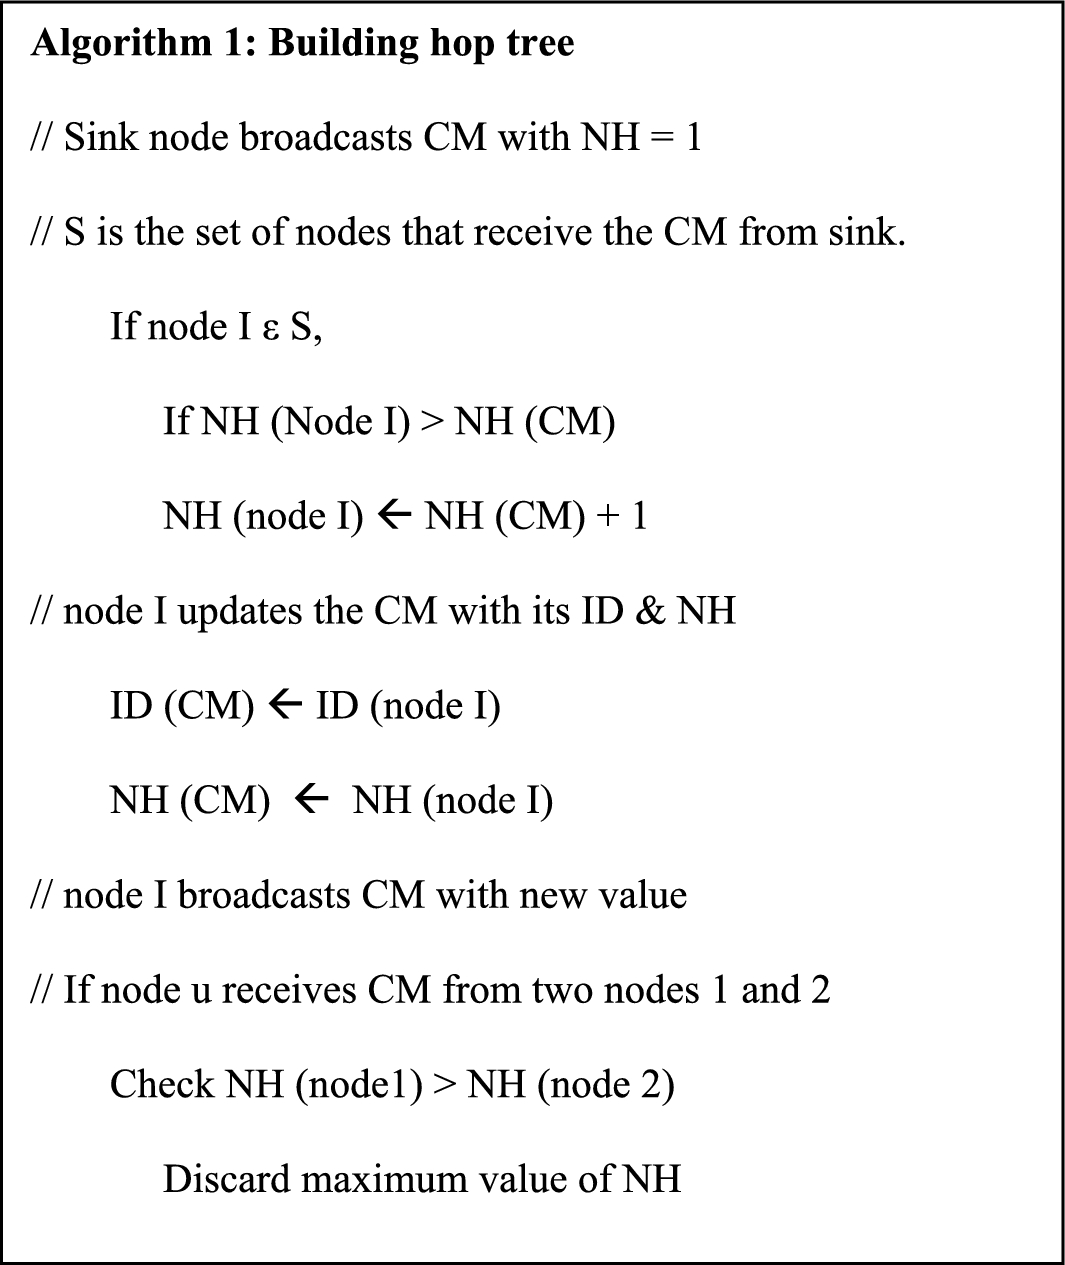
In this phase, the sink node builds the hop tree for data forwarding purposes. The distance from each node to sink is computed by hops. The sink node uses the flooding technique for route discovery and sends Configuration Message (CM) to the all the nodes in the network. The CM contains two fields namely ID and NH. The node identifier (ID) indicates the node that started or retransmitted the CM and the number of hops (NH) is the distance from the sink in hops.
Initially, all the nodes set the value of their NH field to infinity and sink node sets its NH value as 1. The sink forwards the Configuration message (CM) with its own ID and NH to its neighbouring nodes by the process of flooding. Once the node I receives the CM, from the sink or its neighbouring node, it will check for the NH value of the received packet with its own NH value. If the NH value is found to lesser than its own value, then it will increment the NH value in the received CM with 1 and update this value in its field. Node I would update the CM packet with its own ID and NH value and forwards the CM packet to its neighbours.
If node u receives the CM packet from two of its neighbour nodes 1 and 2, it would first check the NH values of the received packets with its own NH value. If the received NH is lesser, then it would check the NH value between the nodes 1 and 2. If the node 1 NH value is found to be lesser than node 2 NH value, then it would discard the CM from node 2 and accepts the CM from node 1. These steps are repeated until the whole network is configured. The algorithm 1 describes the process of building the hop tree as shown in Fig. 2.
Building hop tree.
All the nodes in the network store the smallest value of NH, which is the smallest distance to the sink. Since the network is not partitioned completely into clusters, before the first event takes place, there is no pre-defined route established between the sink and the nodes. Once the first event takes place, the cluster is formed (discussed in Section 3.2) among those nodes detecting the event and a new route is established to the sink node via the relay nodes.
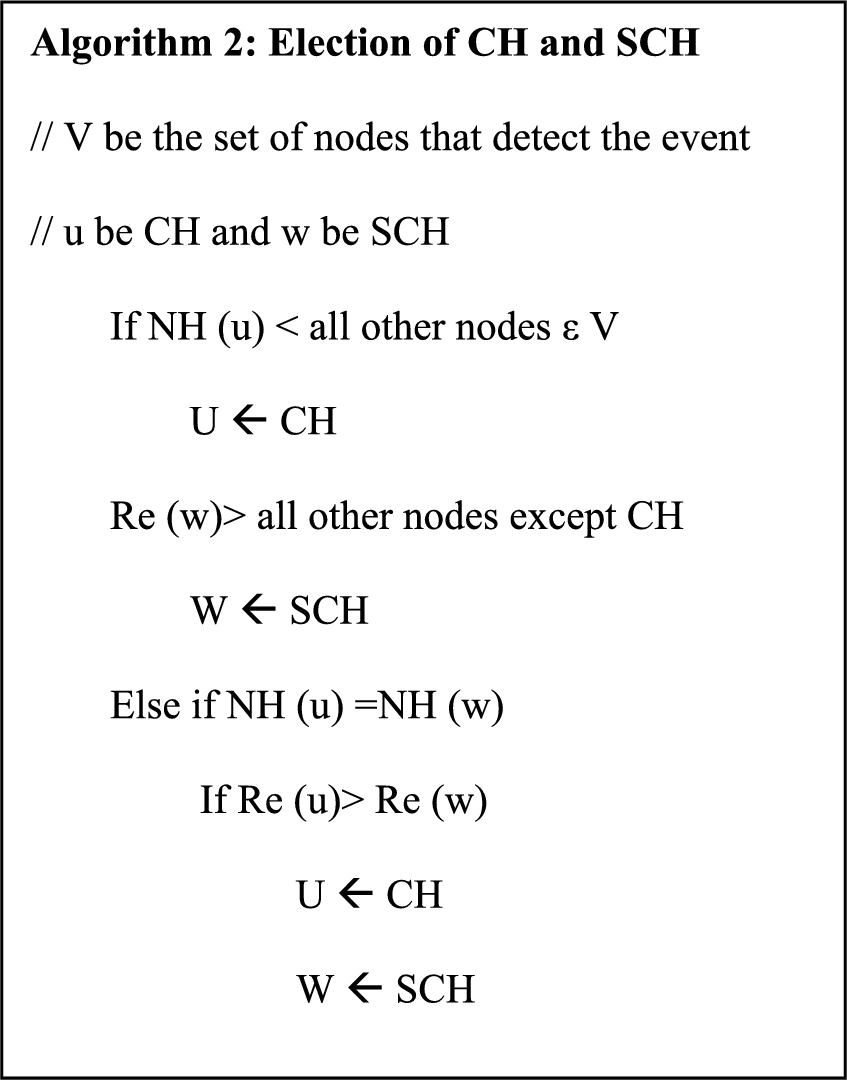
In EERFTDA, the network is not partitioned initially as done in cluster based approaches. The clusters are formed between nodes that detect the same event. This reduces the energy consumed for partitioning the whole network into clusters. The nodes are considered homogeneous; hence all the nodes will be detecting the same event at different time instances. Let the event refer to sensing of temperature. If a set of nodes detect the event at the same time then, they can be grouped as a cluster. All the nodes in the formed cluster runs for leader election algorithm as described in Fig. 3. A cluster-head (CH) is elected among them on the basis of NH value and secondary cluster-head (SCH) is elected on the basis of residual energy. The role of the SCH is to self – initiate in case of any load congestion or failure of primary CH.
The CH is elected on the basis of number of hops to the sink and if two nodes are having same NH value, then the node having highest residual energy will be elected as CH and the other node will be elected as SCH. If only one node is having minimum NH and all the other nodes are having same NH, the node with the minimum NH will be elected as CH and the node having highest residual energy among other nodes will be elected as SCH. The SCH also senses the event and sends the data to the CH. All the nodes in the cluster would send the data to the CH and sets time out to receive an acknowledgement. If the acknowledgment from the CH is received, then the nodes understand that the CH is alive; else the elected SCH realizes that the CH is either in traffic due to congestion or failed due to loss of energy and self-initiates itself as the CH. The algorithm 2 describes the election of primary and secondary cluster-heads as shown in Fig. 3.
Election of CH and SCH.
Data aggregation in EERFTDA is done at the CH or SCH (in case of CH failure) by eliminating the outliers and redundant data using the Locality Sensitive Hashing (LSH) technique. The nodes send their LSH codes to the cluster head. The CH performs LSH algorithm and eliminates outlier generated due to sensor failure, unwanted event sensing, etc. Thus the elimination of outlier data and redundant data is one form of data aggregation due to which reduced number of transmissions from cluster head to sink node is achieved [14].
LSH belongs to the family of min-hash functions that is used to find the similar entries in large data sets by finding out the approximate near matches efficiently [19]. LSH technique uses the distance metrics to find the similarity between data. In EERFTDA, the cosine distance and hamming distance are used for finding the similarity and detecting the outlier data. The output of the LSH algorithm determines whether there is a K-near neighbour for a data point or not. To make use of LSH technique on sensor node data sets, data sets are converted in the form of vectors [19].
Random Hyper Plane (RHP) projection is one form of LSH algorithm that is used for finding the similarity between the vector data sets. RHP generates a family of hash functions by projecting the collected data in a d-dimensional space to a Hamming cube, whose coordinates are in the form of 0s and 1s bits. Let x and y be the data sets in the vector form. RHP generates a family of hash function by taking dot product with the data vector ‘x’ and random vector ‘f’. A common seed is used to produce a spherically symmetric random vector ‘f’ of unit length from a d-dimensional space. A hash function as
Using n random vectors
To explain LSH using RHP, similarity calculation between two temperature data sets x and y are considered. The RHP bitmaps are formed by taking dot product with the random vector f using the equation (1). The temperature data sets x and y along with the random vector is shown in the Fig. 4.
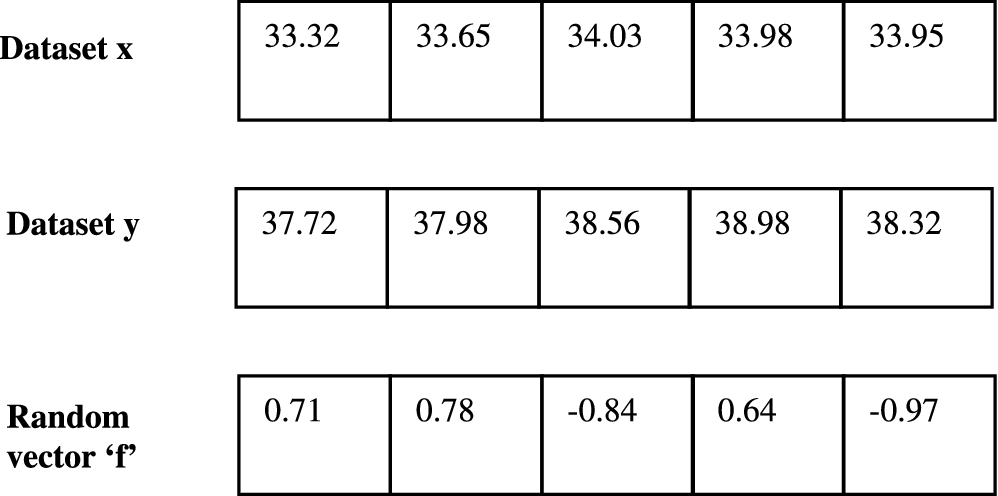
Temperature data sets x and y.
The data sets x and y are mapped into RHP bitmaps by taking dot product with the random vector and the resulting vector is in the form of 0s and 1s. The RHP bitmaps of the data sets x and y are termed as
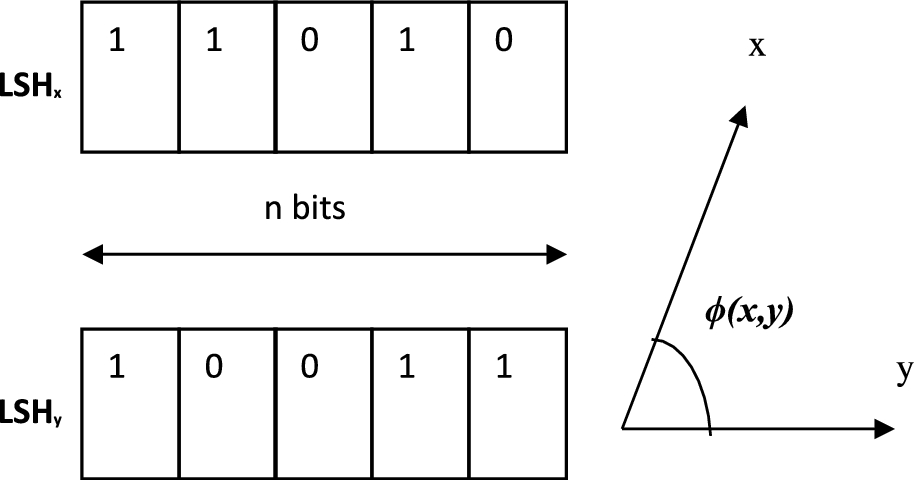
Angle estimation using RHP bitmaps.
The Hamming distance is the number of bits that differ in the RHP encodings of the data sets x and y (
Using the equation (5), the angle between the data sets is estimated using the Hamming distance and given by the equation (7):
A similarity threshold is set by the cluster head and the cosine distance is compared with the threshold. The similarity threshold is set by each cluster head based on the minimum support count assigned by the base station. If the cosine distance is found to be lesser then the support count, then the data from the node is marked as local outlier. The local outliers are those affected by the events in the neighbouring clusters. The local outlier of one cluster would be a normal data of the other cluster. Hence, the CHs of the neighbouring clusters exchange their local outliers. If the local outlier of one cluster does not have minimum support count of its neighbouring cluster, then the local outlier is considered to be global outlier and it is eliminated [19,20].
The data aggregation is done by the cluster head by eliminating the outlier data and the redundant data. The Cluster head eliminates the global outliers based on the threshold value. In order to eliminate redundant data, the CH checks if two or more nodes are having the same LSH code. If it is found to be the same, the CH will ask for data from only one node, thus eliminating the redundant data. In this phase, the data aggregation is performed by merging only the distinct data that lies within the desired threshold set by the CH after eliminating the redundant and outlier data for each occurrence of event. Figure 6 shows the data aggregation using LSH.
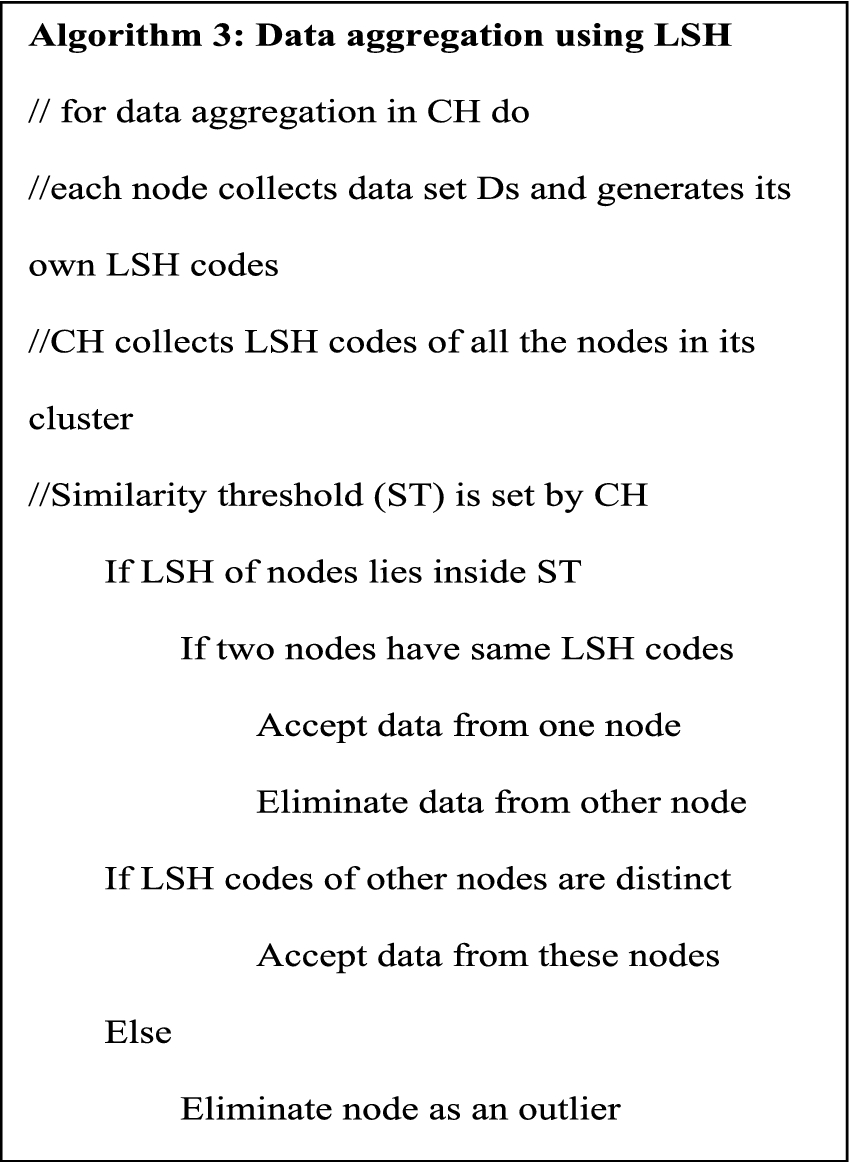
Data aggregation using LSH at CH.
In EERFTDA, the aggregated data from the CH is forwarded via relay nodes to the sink. Since the network is structure-less, there cannot be a predefined path from each node to the sink. Once the event is detected by few nodes and the data aggregation process is completed by the CH/SCH, it starts establishing new route to the sink for event dissemination.
CH sends a route request message requesting node ID and residual energy to its neighbour nodes. The neighbour nodes send route responses with their node ID and residual energy to the CH. The CH compares the residual energies of the neighbouring nodes and finds the nodes with highest residual energy. The residual energy is the remaining energy present in a node once the network operation is initiated. If there are two or more nodes having equivalent residual energies, then in order to choose the next hop node, the MAC layer of CH uses the anycast mechanism [23]. Anycasting is applied for choosing the best next hop to forward the packets, when multiple next hop choices are available.
The RTS/CTS technique is used by the MAC layer to determine the eligible next hop relay node. The RTS packet of the node contains the type of data sensed and Time-to-Deadline (TTD) of the transmitting packet. The packet’s Time-to-Deadline (TTD) is used to indicate the remaining time of the packet before its deadline and is used in routing decisions [23]. To make real-time decisions, before the CH forwards the RTS packets to its neighbour nodes, it computes the required velocity for the packet. The required velocity is the ratio of the distance between the sender and the receiver node to its TTD value. The CH sends the RTS packets to its neighbouring nodes having more residual energy, by setting a specific threshold value for TTD [7].
Once the RTS is received by these neighbouring nodes, they in turn send CTS responses to the CH. The CTS contains the neighbour node’s TTD value and type of data sensed. Since the network is homogenous, the type of data sensed would be common for all the nodes. The CTS responses belong to any of the two classes described below:
Class 1: the minimum TTD of packets in the aggregation queue is lesser than or equal to the TTD value specified in RTS packet of the forwarder node.
Class 2: the minimum TTD of packets in the aggregation queue is greater than the TTD value specified in RTS packet of the forwarder node.
The nodes that lie in Class 1 will be an efficient relay node since its TTD value is lesser than the forwarder node. This makes the aggregation queue to be less or empty. Hence highest priority is given to the nodes in Class 1. If two or more nodes in the class 1 are eligible next hop nodes, the node with a TTD value that is lesser and very much closer to the RTS specified TTD value of the CH is selected as the next hop relay node, as shown in algorithm 4 as shown in Fig. 7.
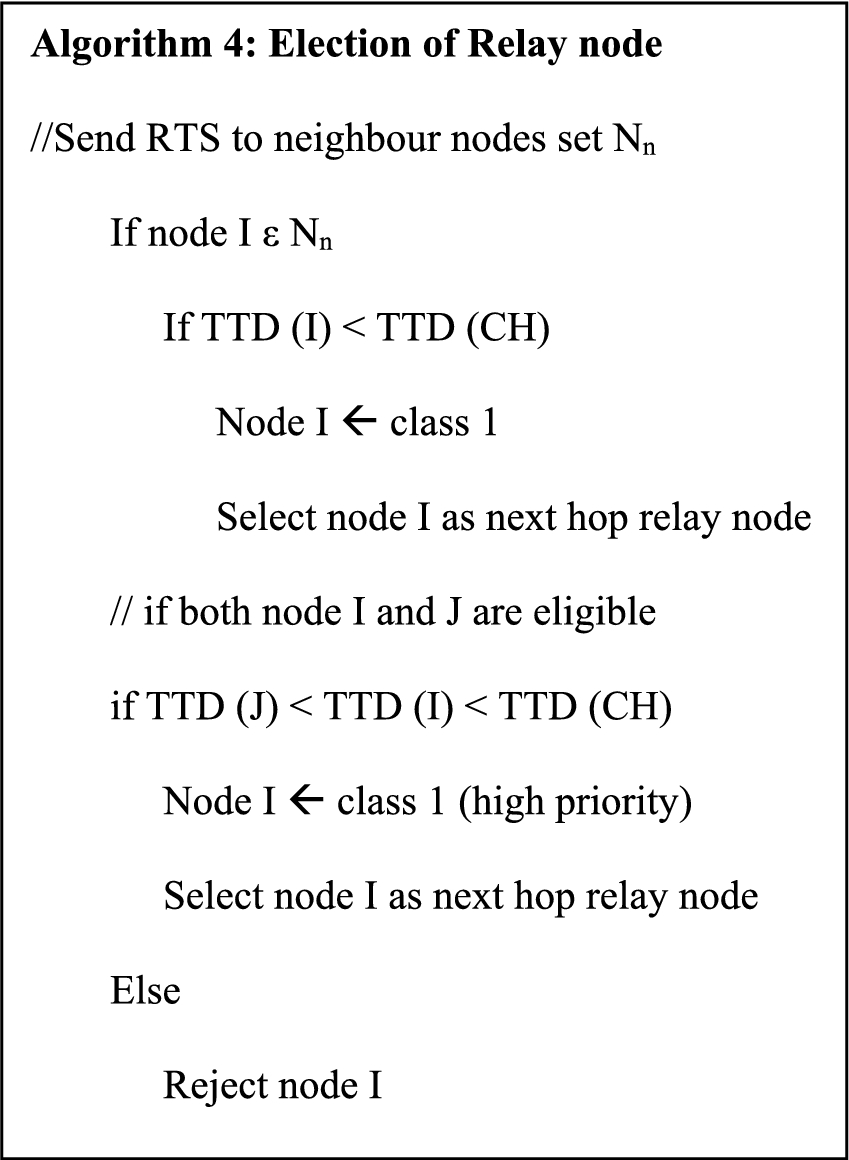
Election of relay node.
According to the bottleneck sphere theorem [23], the nodes closer to the sink have higher energy consumption. When the eligible next hop relay nodes near the sink gets failed due to energy depletion, the data will not reach the sink. Using the residual energy of the nodes near the sink, the routing decisions are taken on how to forward the packet to the sink. Once the route is established between the CH and the sink through relay nodes, the data is forwarded to the sink.
The relay nodes can act as an aggregator node if it receives data from two or more CHs in the network. Since the data is of same type, the data aggregation can be done at these nodes. Data aware anycast algorithm is the data aggregation approach used by the relay nodes for performing data aggregation when two or more events use the same relay node for routing [10,17,23] in order to improve the data aggregation efficiency.
In this section, the performance of the proposed algorithm EERFTDA is analyzed and compared with the DRINA technique [21]. This analysis and comparison is done using metrics such as transmission delay, packet delivery ratio, energy consumption and aggregation accuracy, using NS2 simulator [18]. The default simulation parameters are presented in Table 1. For each simulation set, the parameters such as transmission rate, number of nodes, number of events and event duration are varied and their impact on EERFTDA and DRINA algorithms are evaluated.
Simulation parameters
Simulation parameters
The following metrics were used for the performance evaluation:
The performance of EERFTDA is analysed by varying the transmission rate in kbps and the results are compared with DRINA for the metrics such as delay, packet delivery ratio and energy consumption. The transmission rate is varied as 100, 200, 300, 400 and 500 kbps for 1000 packets and the performance is analysed.

(a) Transmission rate vs. delay. (b) Transmission rate vs. packet delivery ratio. (c) Transmission rate vs. energy consumption.
In DRINA, the routing is done through the shortest path irrespective of the number of packets in the aggregation queue and their Time to Deadline (TTD) value. As the transmission rate increases, the contention in the queue increases, as a result the delay increases rapidly. This problem is overcome in EERFTDA by choosing the relay nodes based on the TTD value and number of packets in the aggregation queue. The node having lesser TTD value than the forwarder node is given high priority since the packets would reach the sink faster. The delay is 40% lesser in EERFTDA when compared to DRINA, as shown in Fig. 8(a).
As the transmission rate increases, there is an increase in the contention and queuing of packets in the relay nodes. In DRINA, the relay nodes are chosen based on the distance between the nodes. Hence the node has to forward the packets despite the contention in its aggregation queue leading to more packet drops. In EERFTDA, the relay nodes are chosen based on the number of packets in the queue and TTD value. Data aggregation is performed at the relay nodes using data aware anycast mechanism [23], thus reducing the number of packets to be transmitted. From the Fig. 8(b), the packet delivery ratio of DRINA is 20% lesser than EERFTDA.
The increase in the transmission rate increases the traffic in the network resulting in congestion in intermediate nodes. In DRINA, since shortest path routing is done, there are more chances for the nodes to lose energy in high traffic loads. To avoid this problem, the relays nodes are chosen based on residual energy in EERFTDA. The node having more residual energy and less TTD value is the eligible next hop relay node, thus reducing more energy consumption on transmission of data. From the Fig. 8(c), the energy consumption is 30% less in EERFTDA when compared to DRINA.
The performance of EERFTDA is analysed by varying the network size, i.e. by varying the number of nodes in the network as 20, 40, 60, 80 and 100. The performance is compared with DRINA for the metrics such as delay, packet delivery ratio, and energy consumption.
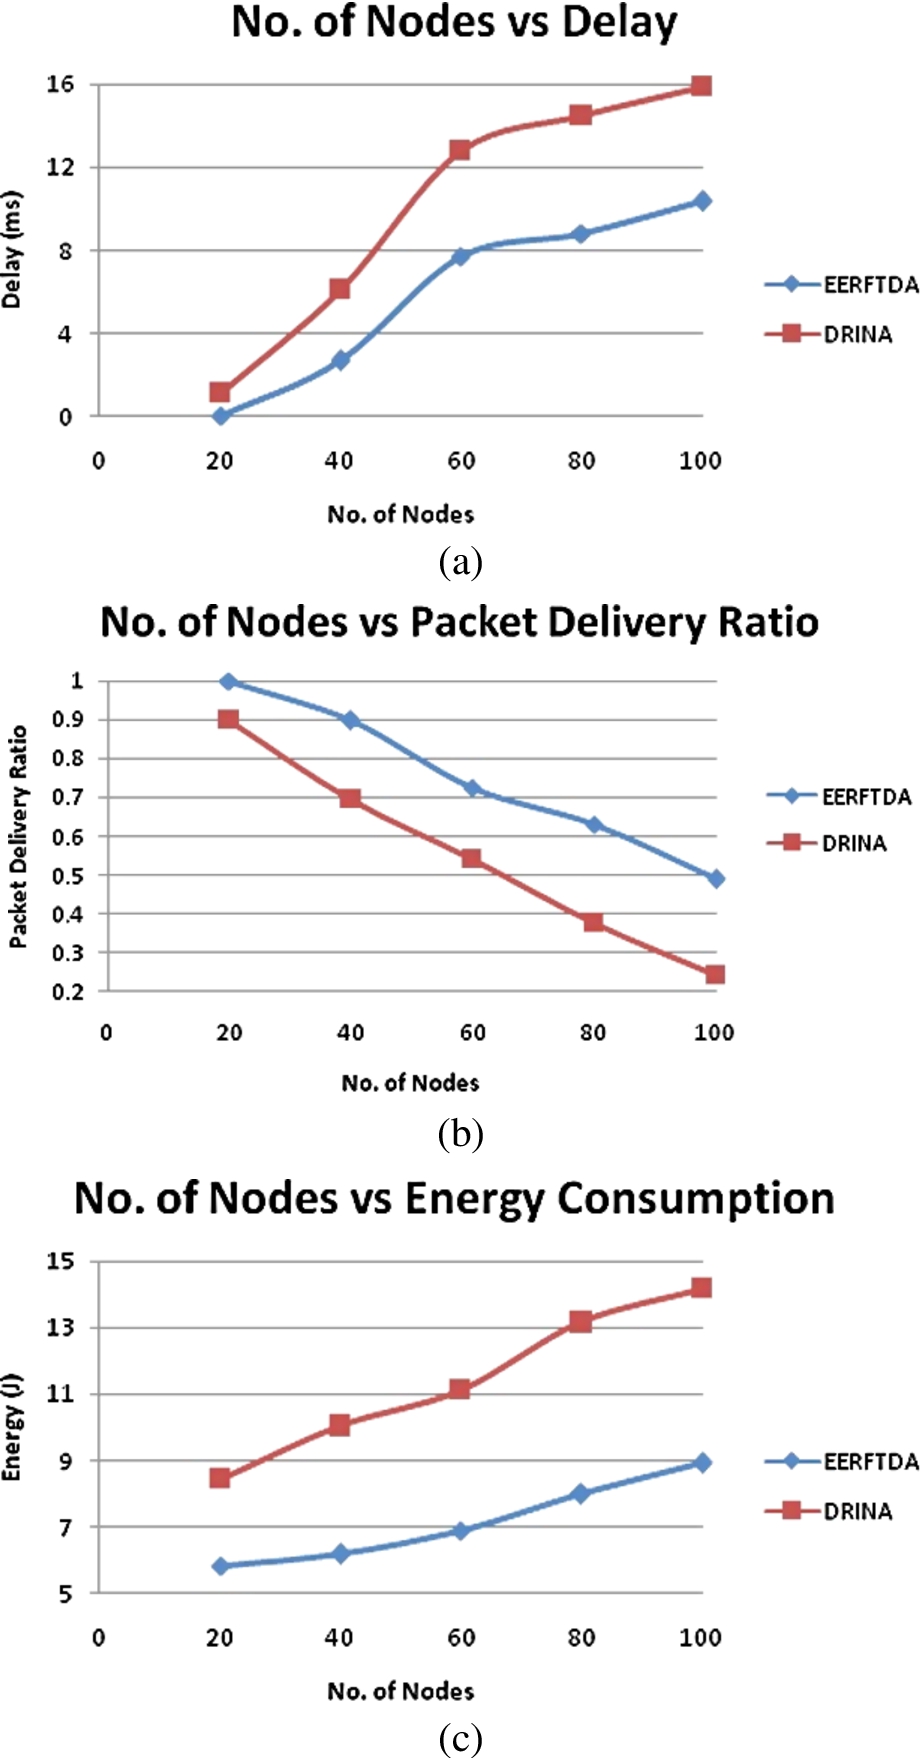
(a) Network size vs. delay. (b) Network size vs. packet delivery ratio. (c) Network size vs. energy consumption.
In DRINA, as the number of nodes in the network increases, the network becomes denser and the delay rapidly increases. In EERFTDA, though the number of nodes increases, the delay is 15% less when compared to DRINA as shown in Fig. 9(a). This is due to the election of secondary cluster head that is used to help their primary head during network congestion. Since the load is balanced between them, the data forwarding is done through many relay nodes, so that the delay is not increased to a greater extent when compared to DRINA.
As the nodes in the network increase, there are more chances for simultaneous events to occur, as a result, more clusters will be formed. The cluster heads forwards the data to the sink node via the relay nodes. The data aggregation process takes place in relay nodes based on data aware anycast. Hence one relay node may aggregate data from two or more nodes and as a result, there might be more contention in the network. This leads to decrease in packet delivery ratio. But in DRINA, since this mechanism is not used, as the network size increases, the packets tend to drop more at relay nodes and as a result, the packet delivery ratio is 25% less when compared to EERFTDA, as shown in Fig. 9(b).
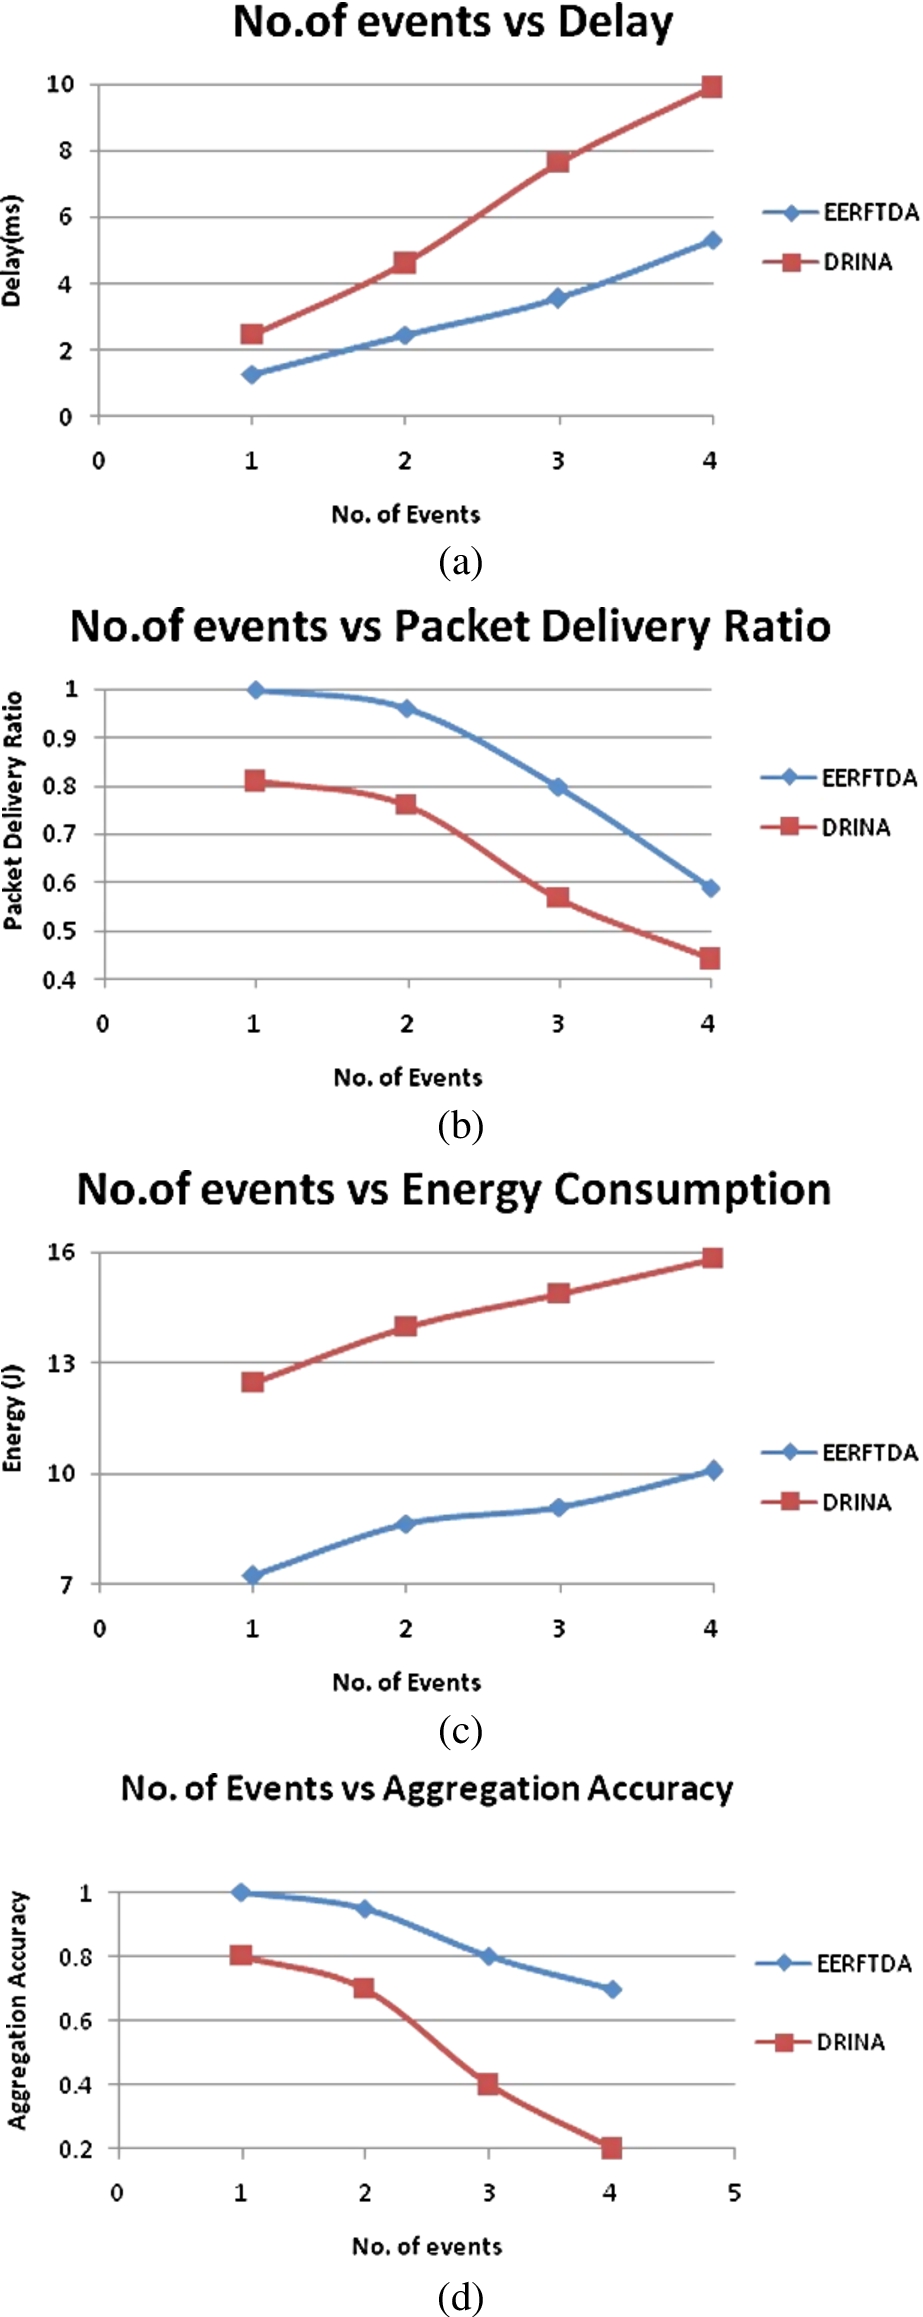
(a) Number of events vs. delay. (b) Number of events vs. packet delivery ratio. (c) Number of events vs. energy consumption. (d) Number of events vs. aggregation accuracy.
In EERFTDA, the secondary cluster heads and the relay nodes are elected based on residual energy. As the number of nodes increases, the network becomes denser. According to the bottleneck problem [23], the nodes near the sink drain out soon than the other nodes in the network. In DRINA, since shortest path routing is performed, the nodes that is very closer to the sink node drains out of energy and tends to fail. The load gets equally distributed near the sink node and the failure of nodes due to energy depletion is reduced. As shown in Fig. 9(c), the energy consumption is reduced to 40% in EERFTDA when compared to DRINA.
The number of events is varied to evaluate the behaviour of EERFTDA in networks with 1, 2, 3 and 4 events occurring simultaneously and the performance was compared with DRINA for the metrics such as delay, packet delivery ratio, energy consumption and aggregation accuracy.

(a) Duration vs. delay. (b) Duration vs. packet delivery ratio. (c) Duration vs. energy consumption.
Figure 10(a), (b), and (c) show the impact of number of events for the metrics such as delay, packet delivery ratio, and energy consumption. The clusters are formed when a few nodes detect the same event. In DRINA, aggregation is done by receiving few data packets and sending a fixed size of merged packets [21]. If the aggregation queue is having more packets, the delay increases with a decrease in delivery ratio. In EERFTDA, the delay is less due to the presence of extra aggregators as it shares the load of the primary aggregators. As the relay nodes perform data aggregation, the data from various cluster heads are getting aggregated in the relay nodes, as a result, the number of packets transmitted is also reduced. This decreases the packet drops and energy consumption. The energy consumption is 30% lesser when compared to DRINA. As the number of simultaneous events increases, there are more chances for generation of redundant and outlier data. Since there is no mechanism involved to eliminate outlier data, the aggregation accuracy is reduced in DRINA. In EERFTDA, the cluster head uses the locality sensitive hashing technique to eliminate the outlier and redundant data, the aggregation accuracy is increased to 50% when compared to DRINA as shown in Fig. 10(d).
The event duration is changed as 25, 50, 75 and 100 seconds and the performance of EERFDTA is compared with DRINA for the metrics such as delay, packet delivery ratio, energy consumption.
In DRINA, the packet is forwarded hop by hop and as the event duration increses, the delay increases. In EERFTDA, the packet is forwarded through the relay nodes having lesser TTD value. This reduces the delay in EERFTDA to 30% less compared to DRINA as shown in Fig. 11(a).
The packet delivery ratio decreases as the duration of event increases. In EERFTDA, due to the process of data aggregation both at cluster heads and relay nodes, the number of packets transmitted is reduced, as a result, the contention and queuing is reduced; reducing the packet drop. From the Fig. 11(b), the delivery ratio is 20% more in EERFTDA when compared to DRINA.
Since the events occur for more time, the redundant data are generated and are eliminated in EERFTDA; hence the number of packets transmitted is reduced, thereby the energy consumption is 40% lesser when compared to DRINA, thus maximizing the lifetime of the network.
From the results, it is observed that the proposed algorithm provides fault tolerance in the network (i) by eliminating the outlier data; (ii) by choosing an relay node based on residual energy to avoid bottleneck problem and (iii) by electing secondary CH, which will self initiate and perform the operations of CH in case of any failure.
Conclusion
An Energy Efficient Routing and fault tolerant data aggregation (EERFTDA) algorithm for WSN was proposed to provide fault tolerant data aggregation by eliminating the outliers and redundant data using locality sensitive hashing. In order to maximize the network lifetime, relay nodes were elected based on residual energy. Since all the nodes are homogenous, the relay nodes also performed data aggregation when it received data from two or more cluster-heads. In addition to election of one cluster-head per cluster, a secondary head was chosen in order to share the network load during congestion and prevent the failure of network. The simulation results were analysed by varying the transmission rate, network size, number of events and events duration for the performance metrics such as delay, delivery ratio, energy consumption and aggregation accuracy. The proposed algorithm outperformed DRINA approach in all the metrics and for different network characteristics. The aggregation accuracy was found to be 50% greater than DRINA and energy consumption is 40% lesser than DRINA. In future work, the proposed algorithm can be used for heterogeneous network and different outlier detection techniques can be analysed for improving the accuracy of data aggregation.