
Abstract
To compare the performance of the clustering algorithm on two data processing architectures, the implementations of k-means clustering algorithm on two big data architectures are given at first in this paper. Then we focus on the differences of theoretical performance of k-means algorithm on two architectures from the mathematical point of view. The theoretical analysis shows that Spark architecture is superior to the Hadoop in aspects of the average execution time and I/O time. Finally, a text data set of social networking site of users’ behaviors is employed to conduct algorithm experiments. The results show that Spark is significantly less than MapReduce in aspects of the execution time and I/O time based on k-means algorithm. The theoretical analysis and the implementation technology of the big data algorithm proposed in this paper are a good reference for the application of big data technology.
Introduction
With the coming of the era of Internet+, massive data has been produced in all aspects of social life. How to dig out its hidden enormous value has become the focus of the community, and also has risen to the national strategic level. In March 2012, the Obama administration announced that they would plan to invest $200 million to start “big data research and a development program”, which followed another major technological development-the “information superhighway” plan [15] announced in 1993. A series of data from the Big Data Report in 2012 McKinsey showed that big data industry had brought $300 billion revenues for the US health care system annually, €250 billion revenues for the European public administration annually, 60% pure profit for the retail industry, and had reduced 50% product development costs for the manufacturing industry. However, Canner thought by 2015 more than 85% of Fortune 500 companies would lose their strengths in the big data competition [11]. The market research firm IDC predicted that big data technology and services market would rise from $3.2 billion in 2010 to $16.9 billion in 2015 and achieved 40% growth rate annually [9]. From the statistics above, it is easy to find that big data is widely applied and is of great value. In terms of the concept and research status of big data, the core force that promote the big data development is the big data processing technology. Whether we can dig out the enormous scientific and economic value hidden in massive data depends on its processing technology. Therefore, the big data technology has become the hot spot and research focus [13]. The limit of traditional data processing model in memory and processing capabilities is unable to meet the actual demands. With the development of science and technology, parallel processing mechanisms e.g. MPI, PVM and MapReduce have been widely used in the past years. However, with the deep research on machine learning, there are a large number of applications that requires iterative algorithm processing. The result of this application processed by the traditional data processing architecture is not satisfactory. An open source universal parallel cloud computing platform-Spark developed by UC Berkeley AMP Lab meets the needs [24]. The Spark is the latest parallel distributed computing framework mainly based on memory computing on big data technology chain. And some issues related to memory computing have got support from the National Natural Science Foundation and related research has started. They are also supported by a lot of companies in the market, such as Alibaba, Baidu, NetEase and so on. Researchers are more concerned about the performance of data processing platform. At home and abroad, most researches have been focused on the differences between MapReduce [14] and Spark; integration of both memory computing and data mining algorithm on Spark [20]; improvement on clustering algorithm [19] binding Spark platform and so on. The decision tree research on two architectures mentioned in the literature [24] shows that the Spark is more suitable for the iterative algorithm, and there is no deep research on the performance differences of the two architectures. Meanwhile, the decision tree also points out the performance differences of the two architectures combining with k-means algorithm [21]. The most latest researches on two architectures performance differences just analyze the results by experiments. But the researches from the mathematical point of theoretical analysis are rare.
In this paper we firstly give the implementations of k-means clustering algorithm on MapReduce and Spark. Then, we focus on the theoretical performance differences of the two architectures from the mathematical point of view. Finally we use experiments to verify the validity of the theoretical analysis of big data algorithm.
Two implementations of k-means algorithm
Overview of k-means algorithm
K-means is a clustering algorithm based on distance and unsupervised learning. It has been used widely on science, industry, business and so on [17]. Its cluster similarity criterion is the distance between data objects. The data of same cluster is similar, and the data of different clusters is different. Clustering function is deviation sum of square criterion function, which is defined as:
The function of computing new center of clustering j is:
Input: data set D, the numbers of cluster k;
Output: the k sets of clustering;
Select data objects as initial center in data set D;
Repeat
For each data object
computing distance from
the data object is divided to the nearest cluster
End For
Calculating the data object average value of each clustering center used as a new clustering center until clustering center points no longer change [17,30].
From the algorithm implementation point of view, we have seen that algorithm would be inefficient when algorithm required multiple iterations in dealing with massive data. Then algorithm can’t meet the needs of practical applications. K-means parallel implementation solves the problem [17]. The following parts mainly introduced the k-means parallel implementations on MapReduce and Spark.
Parallel implementation of k-means based on MapReduce
As is discussed in Section 2.1, the key to parallel implementation of algorithm is to independently assign different samples to the nearest cluster. The Map and Reduce operations are the same in each iteration of parallel implementation k-means algorithm [2]. Firstly, we select k samples as the center randomly, and store them in the HDFS files as a global variable. Then the iteration includes three parts:
Map Function [25]:
Combine Function:
Reduce Function:
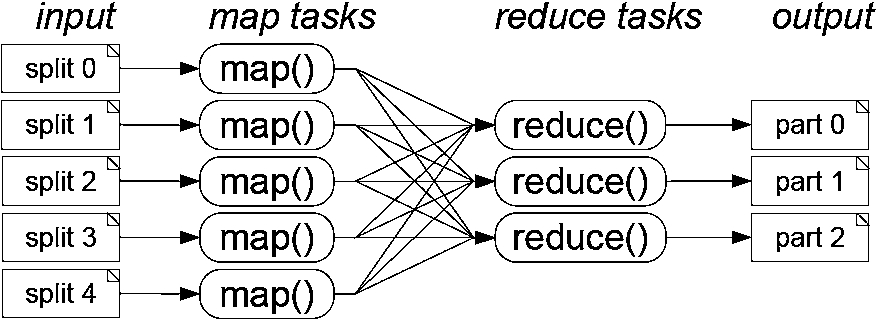
K-means algorithm implementation based on MapReduce.
The implementation of k-means algorithm based on Spark includes two parts [26]: dividing the data clustering point, computing clustering center through multiple iterations until the results converge. The implementation is mainly achieved by the Driver, Mapper, Combiner and Reducer classes [29].
Driver: It’s a underlying driver class of initial program, and it deals with data set through the related functions.
Mapper: It’s a class that determines the initial clustering center, and divides initial data set. It calculates the distance from the data object RDD to the initial clustering center, and selects the class of the nearest distance to merge. At last it reelects the new clustering center. The intermediate results generated by iteration are transformed into the new data object RDD [4].
Combiner: It’s a class to achieve the combination process of the RDD intermediate data set. Because the Map process has produced a large number of RDD intermediate results, the combination can reduce the traffic, and avoid congestion for network communication on the Spark platform.
Reducer: It’s a class that makes local results through Combiner doing Reducer, and gets the global results. It can judge the convergence of clustering center according to the clustering center threshold [6]. The implementation process is shown in Fig. 2.
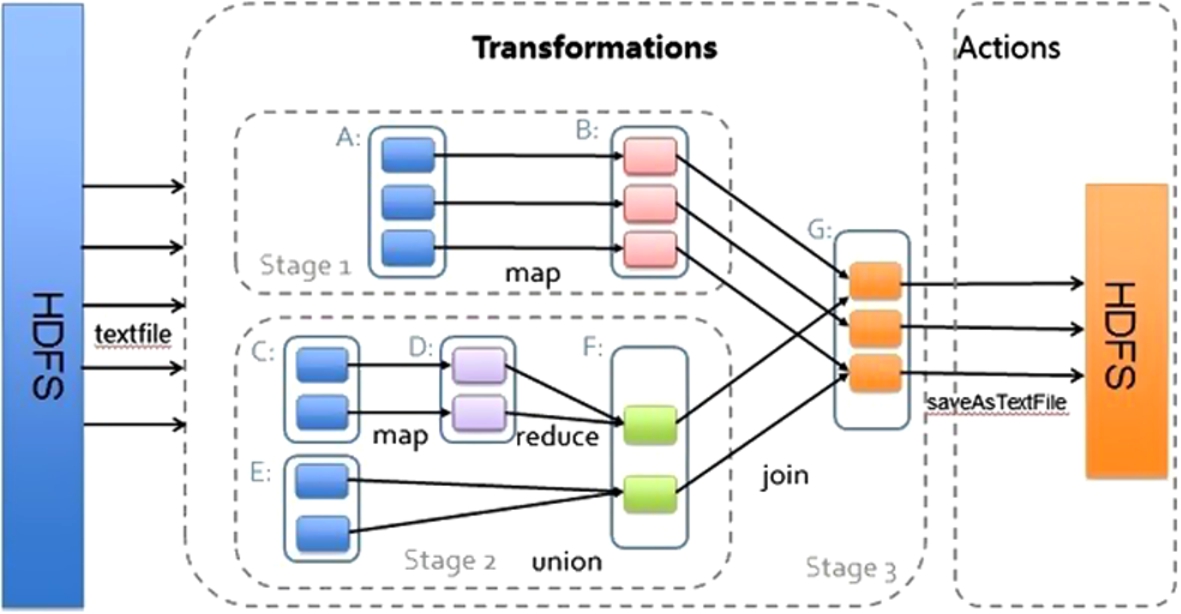
K-means algorithm implementation based on Spark.
As is discussed in Section 2, k-means algorithm implementations on two architectures were based on the Map and Reduce. The main reason for the performance differences between the two architectures is that Spark [16] is based on memory RDD [4] calculation which doesn’t need to interact with the disk, while Hadoop is based on external memory which need to interact with the disk. Then, we will analyze the theoretical performance of two architectures by execution time which is one of the standard to measure platform performance merits.
Algorithm execution time consists of computing time, communication time and system execution time. The complexity of computing time of the two architectures is similar. Communication time includes communication volume and communication mechanism. Hadoop and Spark are based on RPC mechanism, so the time difference can be ignored. In terms of communication volume, Hadoop can’t reuse the data set in iterative process, while Spark can support data set cache policy. Whether the data set reuses or not directly affects the number of iteration. We can merge this difference into the execution time. Execution time includes Map, Reduce and I/O operation time. Therefore, the difference of time consumption between the two architectures is mainly the system execution time. Specific time analysis is as follows:
The first iteration of the two architectures is to read data from HDFS. The start and end heartbeat mechanism of Hadoop are negligible relatively to total time. The second and subsequent iterative processing ideology are the same. The mainly difference is I/O time consumption. To analyze the performance differences between the two architectures conveniently, we assume that the cluster is homogeneous, and job is evenly distributed to all nodes, and no node fail during the implementation process. We need the following definitions auxiliary instructions [10]:
We assume that k-means data processing requires
We define the mainly parameters on performing MapReduce process: input data set S, intermediate output data set
The available maximum numbers of Map and Reduce are respectively M, R in MapReduce computing system. During execution process the Map number divided is X, the Reduce number of system starting is Y. The rate of data that is read from HDFS is
Hadoop Map Time: The process includes reading data from HDFS, executing Map calculation and writing the Map intermediate results back to disk. Each Map input data is
Hadoop Reduce Time: It inputs intermediate results output by Map sorting and executing Reduce calculation, and outputs the results. Each Reduce input data is
We assume that
The results have shown that the overhead and execution rate of each stage of the implementation process have a great influence on the architecture performance. In practical application, the data volume maybe reach to T level and even bigger. The difference of execution time on two architectures becomes much more obvious. Bandwidth may also become the bottleneck of the two architectures. Finally, the results have shown that Hadoop is longer than Spark in I/O consumption or total time. Using the execution time to measure the performance of two architectures, we can conclude that Spark is superior to the Hadoop.
There are many clustering algorithms now. The algorithm implementation steps are different owing to different algorithm ideas, so algorithm result-clustering effect is different. The effect of clustering algorithms varies in practical applications. To illustrate the performance differences between the two architectures, this paper analyzes clustering algorithm implementations based on two architectures from the mathematical point of view. The experiments use text data set used to test clustering algorithm to compare the performance differences between the two architectures by changing the number of iteration. Therefore, the performance differences between the two architectures can’t be illustrated by clustering effect.
Experimental environment
In the experiment we used one server and three virtual hosts produced on the Workstation VMware. We used CDH5 as Hadoop and Spark platform, and used CentOS6.5 x64 as node operating system. We use Hadoop 2.5.0-cdh5.3.2 benchmark for Hadoop and the Spark 1.2.0 benchmark for Spark [22] and JDK 1.7 benchmark for Java.
Experimental data
Experimental data used text data set of social networking site of users’ behaviors [1]. All data is displayed in.csv file format. And they are packaged separately in multiple tar.gz file.
User information format: [user id]∖t[user text], for example: 369319 zzzop. User relationship network format: [user id]∖t[crawled page count]∖t[friend count]∖t[friend id list]∖t[fans count]∖t[fans list], for example: 1.2.3..htm 1 14215 6 hamas jkaneko caol_ila manwomanfilm public_design_center Kaminogoya 4 hamas lawmn shamroy tkwshnsk.
Results and analysis
The experiment used the standard pure text data set which is used to test k-means algorithm. By changing the number of iteration and comparing average execution time and I/O time of the two architectures, we can illustrate the performance differences between the two architectures. Fig. 3 is the average execution time of k-means algorithm of the two architectures. As we can see from Fig. 3, the processing time of MapReduce increases with the number of iteration, and the processing time of Spark architecture is relatively stable. When the number of iterations is same, the processing time of MapReduce is longer than the processing time of Spark, and the average execution time of MapReduce is 50 times of Spark. The conclusion is consistent with the theoretical analysis. The experimental environment and different parameter values of the theoretical analysis are the causes of deviation.
Figure 4 is the I/O time of the k-means algorithm of the two architectures. As we can see from Fig. 4, the I/O time ratio of MapReduce and Spark increases with the number of iteration. When the number of iteration is same, the I/O time of MapReduce is longer than the I/O time of Spark. So the iterative processing time is mainly I/O time, and I/O time of MapReduce is 60 times of Spark. The conclusion is consistent with the theoretical analysis. The experimental environment and different parameter values of the theoretical analysis and the smaller experimental data set are the causes of deviation.

The average execution time comparison under two kinds of architecture.
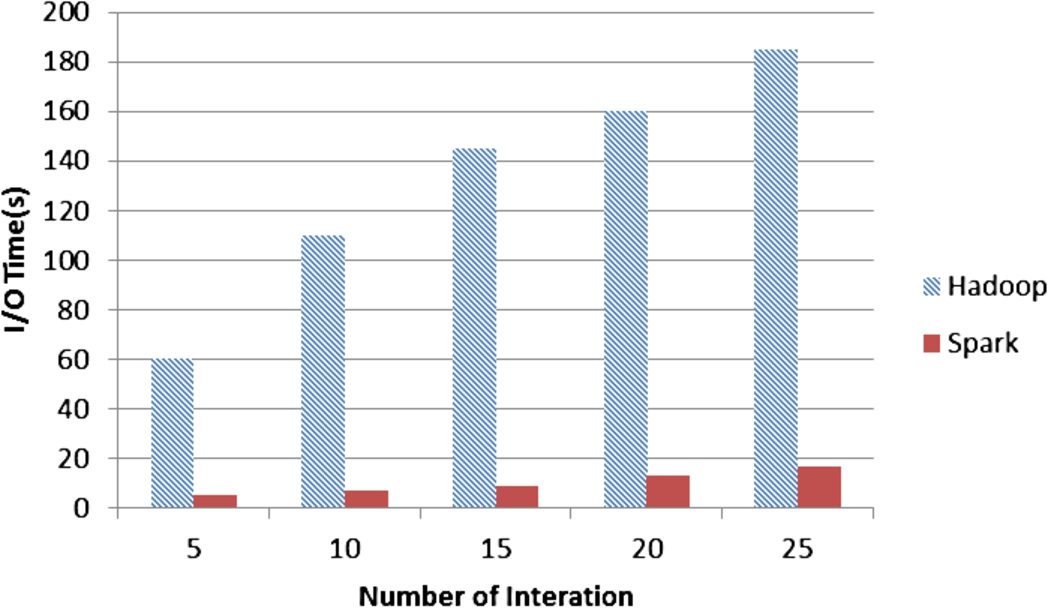
The I/O time comparison under two kinds of architecture.
In a word, as we can see from the experimental results, the execution time and I/O time of Spark are significantly less than MapReduce. So Spark performance is superior to MapReduce in terms of time consumption. Moreover, the experimental results are consistent with the theoretical analysis results of Section 3. Then, we can verify the validity of the theoretical analysis results.
In this paper we have introduced the implementation steps of k-means algorithm and its implementation on MapReduce and Spark. Then, this paper focuses on theoretical performance differences of two architectures using clustering algorithm from the mathematical point of view. Finally, with the increase of the number of iteration, MapReduce will increase significantly and Spark will change small on the execution time. That is to say, the performance of the Spark is superior to the MapReduce.
In future work, we plan to further analyze the performance differences of two architectures on scalability. MapReduce is based on external memory calculation [7,12] and Spark is based on memory calculation, so the memory consumption on processing [18,23] data can also affect the architecture performance [3,27,28]. Thus memory optimization is one of the most important directions in future research [5,8].
Footnotes
Acknowledgements
Our sincere appreciation to the anonymous reviewers for their helpful comments and suggestions. What’s more, this work is partially supported by the National Natural Science Foundation of China (Grant No. 61402183), Guangdong Natural Science Foundation (Grant No. S2012030006242), Guangdong Provincial Scientific and Technological Projects (Grant Nos. 2016A010101007, 2016B090918021, 2014B010117001, 2014A010103022, 2014A010103008, 2013B010202001 and 2013B010401021), Guangzhou Civic Science and Technology Project (Grant Nos. 201607010048 and 201604010040) and Fundamental Research Funds for the Central Universities, SCUT (No. 2015ZZ0098).