
Abstract
Many classical clustering algorithms have been fitted into MapReduce, which provides a novel solution for clustering big data. However, several iterations are required to reach an acceptable result in most of the algorithms. For each iteration, a new MapReduce job must be executed to load the dataset into main memory, which results in high I/O overhead and poor efficiency. BIRCH algorithm stores only the statistical information of objects with CF entries and CF tree to cluster big data, but with the increase of the tree nodes, the main memory will be insufficient to contain more objects. Hence, BIRCH has to reduce the tree, which will degrade the clustering quality and decelerate the whole execution efficiency. To deal with the problem, BIRCH was fitted into MapReduce called MR-BIRCH in this paper. In contrast to a great number of MapReduce-based algorithms, MR-BIRCH loads dataset only once, and the dataset is processed parallel in several machines. The complexity and scalability were analyzed to evaluate the quality of MR-BIRCH, and MR-BIRCH was compared with Python sklearn BIRCH and Apache Mahout k-means on real-world and synthetic datasets. Experimental results show, most of the time, MR-BIRCH was better or equal to sklearn BIRCH, and it was competitive to Mahout k-means.
Introduction
Clustering algorithms are considered one of the most elementary algorithms in data mining and knowledge discovery. Supposing a dataset with n objects, the purpose of clustering algorithms is to arrange the similar objects to a meaningful cluster, so that the objects in the same cluster can be referred together. As for a result, all clustering algorithms require that each cluster not be an empty set, and each object in the dataset belongs to only one single cluster [1], except for fuzzy clustering algorithms [2].
In the past decades, some clustering algorithms with their variants have been proposed. Generally, there are five categories of algorithms based on the method of data classification: (1) partitioning methods [3, 4], (2) hierarchical methods [5, 6], (3) density-based methods [7], (4) grid-based methods [8] and (5) model-based methods [9, 10]. Clustering algorithms have been extensively used in numerous domains, such as business and economy [11, 12], bioinformatics [13], computer vision [14] and document clustering [15, 16]. In recent years, large volumes of data named big data have been produced. The way of big data store, manage and efficiency of processing has been an increasing challenging issue. Most of the traditional clustering algorithms are insufficient and inaccurate for clustering big data, because all of the data as well as the statistical information needs to be stored in the main memory. Therefore, scalable and parallel clustering algorithms are necessary.
In recent years, some parallel frameworks have been proposed. MapReduce is one of the most efficient parallel frameworks, it was designed to process big data in a cluster computer system, and it can also be used in a multi-core computer system [1]. The open-source equivalent is Hadoop, which is popular for its high efficiency, scalability and fault-tolerant [17]. The two main components are HDFS and MapReduce in Hadoop, HDFS is responsible for transferring and storing data, and MapReduce provides computation service.
In this paper, A MapReduce-based BIRCH clustering algorithm termed as MR-BIRCH is proposed to address the issues mentioned above. The dataset is firstly split into several small chunks, and trees are built parallel in map phase. Due to the high scalability of MapReduce, the number of the machines can be increased to store more and finer entries in the trees. In reduce phase, k-means is chosen as a global clustering algorithm to cluster the entries. The number of entries is so small that the whole entities can be stored in main memory, thus it is not necessary to reload the entries in each iteration, which greatly reduce the I/O complexity.
Key contributions made by this paper includes: 1. BIRCH algorithm is implemented on MapReduce, so the dataset can be loaded and processed parallel. 2. In MR-BIRCH, it is not necessary to computer the size of the memory occupied by CF tree. 3. Extensive simulation is conducted on Apache Hadoop, and the results reveal MR-BIRCH is feasible for clustering synthetic and real-world dataset.
The paper is structured as: Starting with review of previous work in section 2, introducing the preliminaries in Section 3, detailing MR-BIRCH algorithms in Section 4, discussing experimental outcomes in Section 5 and finishing off with conclusion and prospective in Section 6.
Literature review
Many MapReduce-based algorithms have been widely deployed to address the issue of big data clustering. For example, Zhao et al. [18] introduced a parallel k-means clustering algorithm based on MapReduce. To start, an array with initial centers is defined as a global input variable. In map phase, each object from the chunk is allocated to the nearest centers so that to compute new centers. In reduce phase, k-means is used for clustering all the objects shuffled from the map phase to get new centers, which can be used for the next iteration. Saeed et al. [2] introduced an algorithm named mrk-means, which loads objects only once, and it is a single-pass and linear-time k-means clustering algorithm based on MapReduce. In the map phase, the centers are initiated with k-means++ algorithm, and k-means algorithm is executed only once on each chunk. In the reduce phase, the whole weighted centers are clustered with k-means++ algorithm as in the map phase. Younghoon et al. [19] proposed a density-based clustering algorithm using MapReduce named DBCURE-MR, it utilizes ellipsoidal τ-neighborhoods in clustering, and it is less sensitive to the density parameters. Surve et al. [20] implemented a MapReduce-based k-means algorithm to cluster remote sensing images. Each pixel in the image is represented with its red, green and blue proportion, and two MapReduce jobs are used. One job assigns pixels to the corresponding center, and the other job checks the error variance of the pixels. Tanvir et al. [21] used MapReduce in clustering document dataset. First, the document dataset is transformed to vector values, and then the vector values are allocated to the adjacent center. New centers are calculated and written to disk, and the centers will be loaded in the next iteration.
Yue et al. [22] saved the spatial datasets in HBase, and provided a modification of K-medoids based on MapReduce, named K-medoids++. The row key in HBase is loaded as key, and the corresponding coordinate is loaded as value, the subsequent process of map phase and reduce phase is similar to the other MapReduce-based algorithms, and the results show it is effective in clustering large spatial dataset. Siddharth et al. [23] parallelized fuzzy k-means on MapReduce. The initial centers are generated using Canopy method, and the membership values are assigned according to the distance between the objects and the centers. The new centers are calculated and transferred to the reducer, which recalculates the centers and feeds them to the mapper. The iteration will continue several times until the given condition is satisfied.
BIRCH (Balanced Iterative Reducing and Clustering using Hierarchies) is a well-known hierarchical algorithm [5], and it can deal with large volumes of data. However, with the increase of dataset size, tree threshold will be set larger automatically, and more objects will be merged into one entry. To improve the performance of BIRCH, some variants have been proposed. Siddharth et al. [24] used a variant of BIRCH named m-BIRCH in visual clustering and non-convex-clusters. It can estimate tree threshold automatically. Boris et al. [25] proposed A-BIRCH and MBD-BIRCH. A-BIRCH is suitable for the situations where the final global clustering of BIRCH can be rendered, and MBD-BIRCH is an alternative in case the number of the clusters is too large for A-BIRCH.
With the development of machine learning and deep learning, many novel approaches have been proposed in data analysis [26, 27], and some of the approaches are integrated with classical clustering algorithm to improve the clustering effectiveness, [28] demonstrated a dynamic clustering algorithm based on neural network and rough set theory, which provide all updated cluster sets when the data are generated gradually. [29] proposed a time series clustering algorithm named TSC-CNN, which is based on convolution neural networks. The algorithm aggregates partial data with a higher similarity, and the intermediate results are used as training set to train the whole network. However, most of the algorithms are serial algorithm, and it is difficult for them to use the resource of distributed system or multi-core computer system. To design a scalable parallel algorithm, distributed framework is always required. But for most of the MapReduce-based algorithms, several iterations are required to reach an acceptable result. Hence, the dataset must be loaded to the main memory many times, which requires lots of I/O operation, and hence decelerates the execution efficiency. In terms of BIRCH, it is difficult for CF tree to reflect the detail of the dataset when the dataset size is extremely large. Many variants are benefit supplements to BIRCH, but few research works has been proposed to fit BIRCH into MapReduce or other common distributed frameworks.
Preliminaries
In BIRCH, two main concepts, entry and tree, are proposed. Entry describes the statistical information of a sub cluster, and it is represented by a triple
where
Five available distance metrics, D1, D2, D3, D4 and D5, are provided to compute the distance between two sub clusters, and the experiments show that there is not distinctive performance difference among the five metrics except for D3 [5]. D2 is chosen as the distance metric in the rest of the paper. Given two entries:
CF tree is a height-balanced tree. The three parameters of a tree must be initiated, they are no-leaf node branching factor B, leaf node branching factor L and entry threshold T. That is to say, there are at most B entries in a no-leaf node and L entries in a leaf node. The diameter of each entry must be smaller than T. All the leaf nodes are linked to a list, and the entries can be visited from the head node of the list.
CF tree stores statistical information of the objects, instead of real objects in main memory. When main memory is run out of, two different strategies have been proposed to reduce the size of the tree [5]: (1) increasing the threshold value and rebuilding the tree, thus the entries will absorb more objects. As a result, the size of the tree will be smaller, and there will be free memory left to contain more objects; (2) Leaf entries with far fewer objects are judged as potential outliers, and they will be written out to disk, at the same time, when disk space is run out of, each potential outlier in the disk is verified to determine if it is a real outlier. If a potential outlier can be absorbed by a leaf node, it is not an outlier, or it will be removed as a real outlier.
BIRCH consists of four phases: (1) Loading data into main memory and building a tree, (2) If the main memory is run out of, increasing the threshold T to build a smaller tree, and exchanging the potential outliers between the main memory and the disk, (3) Clustering all the entries in the leaf nodes with an existing clustering algorithm, (4) If it is necessary, all the objects can be reloaded and redistributed to the nearest center. The phase (2) and the phase (4) are optional in BIRCH.
BIRCH can deal with only continuous attributes, which can be represented by explicit coordinates in a Euclidean space [5], and it can do nothing about categorical and mixed-type datasets. The synthetic and real-world datasets in this paper include only continuous attributes.
The divide and conquer strategy
BIRCH is fitted into MapReduce applying the divide and conquer strategy. In MR-BIRCH, whether the tree is rebuilt or not depends on the number of the entries in the leaf nodes, not the main memory size [5]. For simplicity, the outlier option is not implemented in MR-BIRCH. Fig. 1 shows the overall process flow of MR-BIRCH. At the beginning, dataset is split into several chunks according to the initial parameters, and each chunk is emitted to a machine. In map phase, an empty tree is built at the beginning, and the objects are loaded into the main memory line by line. Map function processes one line at a time and get the (key, value) pairs, then the object is inserted to the tree. As long as the number of the entries in the whole leaf nodes is no more than the specified value, the leaf entries will be fed to the reduce task for further processing, otherwise the tree will be rebuilt until the given condition is satisfied.

Process flow of MR-BIRCH.
In reduce phase, the extended k-means++ is applied on the intermediate entries. Assuming n as the number of entries in cluster C, N
i
(i = 1, 2, ⋯ , n) as the number of the objects assigned to CF
i
entry,
The entry with the maximum N
i
is selected as the first center when the selection probability is computed. Also, assuming m as the number of the entries except for the known centers, assuming D
i
(i = 1, ⋯ , m) as the distance between CF
i
and the nearest center that has been confirmed, the selection probability of CF
i
can be transformed to Equation (5):
Afterwards, k-means algorithm can be employed on the intermediate entries, so that the result of the clustering can be gotten. The details of MR-BIRCH are given in Table 1.
MR-BIRCH algorithm
MR-BIRCH includes two independent phases: map phase and reduce phase. The trees are built parallel in map phase, and the intermediate entries are clustered in reduce phase. To give time complexity analysis, the following assumptions are proposed: n as the number of the objects in the dataset, m as the number of the machines, c as the chunk size, which is the number of objects in a chunk, B as the leaf branching factor and the no-leaf branching factor, and k as the number of the clusters. When all of the n objects are allocated to the m machines uniformly, there will be at most ⌈n/m⌉ objects processed simultaneously in a machine, and the number of the chunks is ⌈n/c⌉. BIRCH rebuilds the tree when the whole available memory is occupied [5], but in MR-BIRCH, the tree will be rebuilt when the number of the leaf entries exceed ⌈c/m⌉ to ensure the number of intermediate entries in reduce phase is no more than ⌈n/m⌉. As in BIRCH, the initial threshold is set to 0, which means an entry contains only one object. Therefore, the initial height of the tree is smaller than 1 + ⌊log
B
c⌋. To insert an object into the tree, it is required to follow the path from the root node to the leaf node, and at most B entries can be examined during each node. Accordingly, the cost of inserting a new object to the tree is less than B (1 + ⌊log
B
c⌋), and the cost of building a tree is less than cB (1 + ⌊log
B
c⌋). With a new threshold, average approximately two entries will be merged into one entry [5]. If the number of the leaf entries decreases to ⌈c/2⌉ after rebuilding the tree, the height of the tree will be smaller than 1 + ⌊log
B
⌈c/2⌉⌋, and the cost of rebuild the tree is at most
The whole dataset is loaded only once in map phase, and hence the I/O cost of map phase is ⌈n/m⌉. In reduce phase, the number of the intermediate entries is ⌈n/m⌉ atmost, and it is loaded only once too. Hence, the total I/O complexity is O (⌈n/m⌉).
For space complexity, in map phase, each object in the chunk are loaded and inserted into a tree, and when the tree is rebuilt, the entries in the leaf nodes are inserted into a new tree again, and hence less data structure is required during the rebuilding process [5, 30], the space complexity in map phase is O (n), and in reduce phase, the output entries from each map is at most ⌈c/m⌉, so the space cost is at most ⌈n/m⌉ to store the intermediate data. Hence the total space complexity is O (n).
Experimental results
The experiments were composed of three subsections. First, the sensitivity of MR-BIRCH to the characteristics of the datasets was studied. Second, the scalability and speedup were evaluated. Third, the sensitivity to the parameters was investigated. Finally, the quality of MR-BIRCH was compared with that of sklearn BIRCH and Mahout k-means.
Datasets
Three real-world datasets and a set of synthetic datasets have been used. The real-world datasets are: “urbanGB”, “selfBACK” [31] and “3D_spatial_network” [32, 33]. The specification of the three real-world datasets is tabulated in Table 2. It must be mentioned that the first dimension in “3D_spatial_network” is “open street map ID”, and hence only the other three dimensions are used in the experiments.
Specification of the real-world datasets
Specification of the real-world datasets
Three synthetic datasets, DS_G, DS_S and DS_R, are generated in this experiment. The settings of the synthetic datasets are given in Table 3. The patterns of the three datasets are grid, sine and random respectively. Each dataset includes 100 clusters, and there are 100 thousand points in each cluster. Hence, the number of the points is 10 million in each dataset. The points in each cluster were generated with 2-dimensional independent normal distribution. The mean is the center of the cluster, and the variance in each dimension is 1. For DS_G, the centers of the clusters were placed on a 10 × 10 grid. The distance between the centers was
Specification of four synthetic datasets
SSE (Sum of Squared Errors) function is a well-known evaluation metric used for evaluating the quality of clustering algorithms. It is the sum of the distances between all the objects and their nearest centers. In MR-BIRCH, assuming M as the set of the objects, C as the set of the centers, and d as the distance between two entries, SSE is formally defined as Equation (6):
SSE describes the compactness of the clusters, and the lower SSE means the higher quality of the clustering algorithm.
To evaluate the performance of MR-BIRCH, a Hadoop distributed experiment environment of 6 virtual machines with VMware workstation 15.5.2. 6 was constructed. Each machine has a configuration of 1-core CPU with 3.6 GHz, 2 GBs memory and 120 GBs hard disk. The operating system is CentOS 6.5, and Java 1.8 is installed on all machines. Apache Hadoop 2.6.5 is chosen for MapReduce implementation, and Mahout 0.13.0 is chosen for k-means MapReduce-based algorithm. To evaluate the quality, Python 3.8.5 is used to run sklearn BIRCH.
Sensitivity to the characteristics of the datasets
BIRCH clusters datasets of various patterns with high quality [5], so when BIRCH is fitted into MapReduce, it is necessary to study the sensitivity of MR-BIRCH to the pattern of the dataset. Experimental results reveal that the pattern of dataset have almost no impact on the clustering accuracy and execution time. The statistical results are similar to the original parameters in terms of central location, number of objects, and radius.
The maximum and average distances between the centers of the MR-BIRCH clusters and original parameters are 0.21 and 0.09 respectively. The points which are clustered to the other centers are no more than 9%. The radii of the clusters are between 1.21 and 1.40, which were smaller than the initial value
Scalability of MR-BIRCH
For investigating the scalability of MR-BIRCH, the dataset size was increased in three aspects: Increasing the number of the points, increasing the number of the clusters and increasing the number of the dimensions.
In the first experiment, eight grid pattern datasets were generated with 5, 10, 15, 20, 25, 30, 35 and 40 million points respectively. Each dataset has four clusters. The center and variance were set similarly to that in section 5.1. It was set to 0.0001 for the relative tolerance of the centers difference in two consecutive iterations, and the maximum iteration number is set to 100. B is set to 5, and c is set to ⌈n/6⌉. Map time, reduce time and total time are reported in Fig. 2. As the graph confirms, the total time increases almost linearly as expected. For map time, the time complexity is O (c log B c). When n increases from 5 million to 40 million, it has little effect on log B c. Accordingly, the map time scales almost linearly as the number of objects increases. For reduce time, the time complexity is O (kr⌈n/m⌉). The number of the intermediate entries is no more than ⌈n/m⌉, which increases with the increase of n, but the experimental results show that the number of intermediate entries was far smaller than ⌈n/m⌉, and reduce time increased slowly with the increase of the number of the objects.
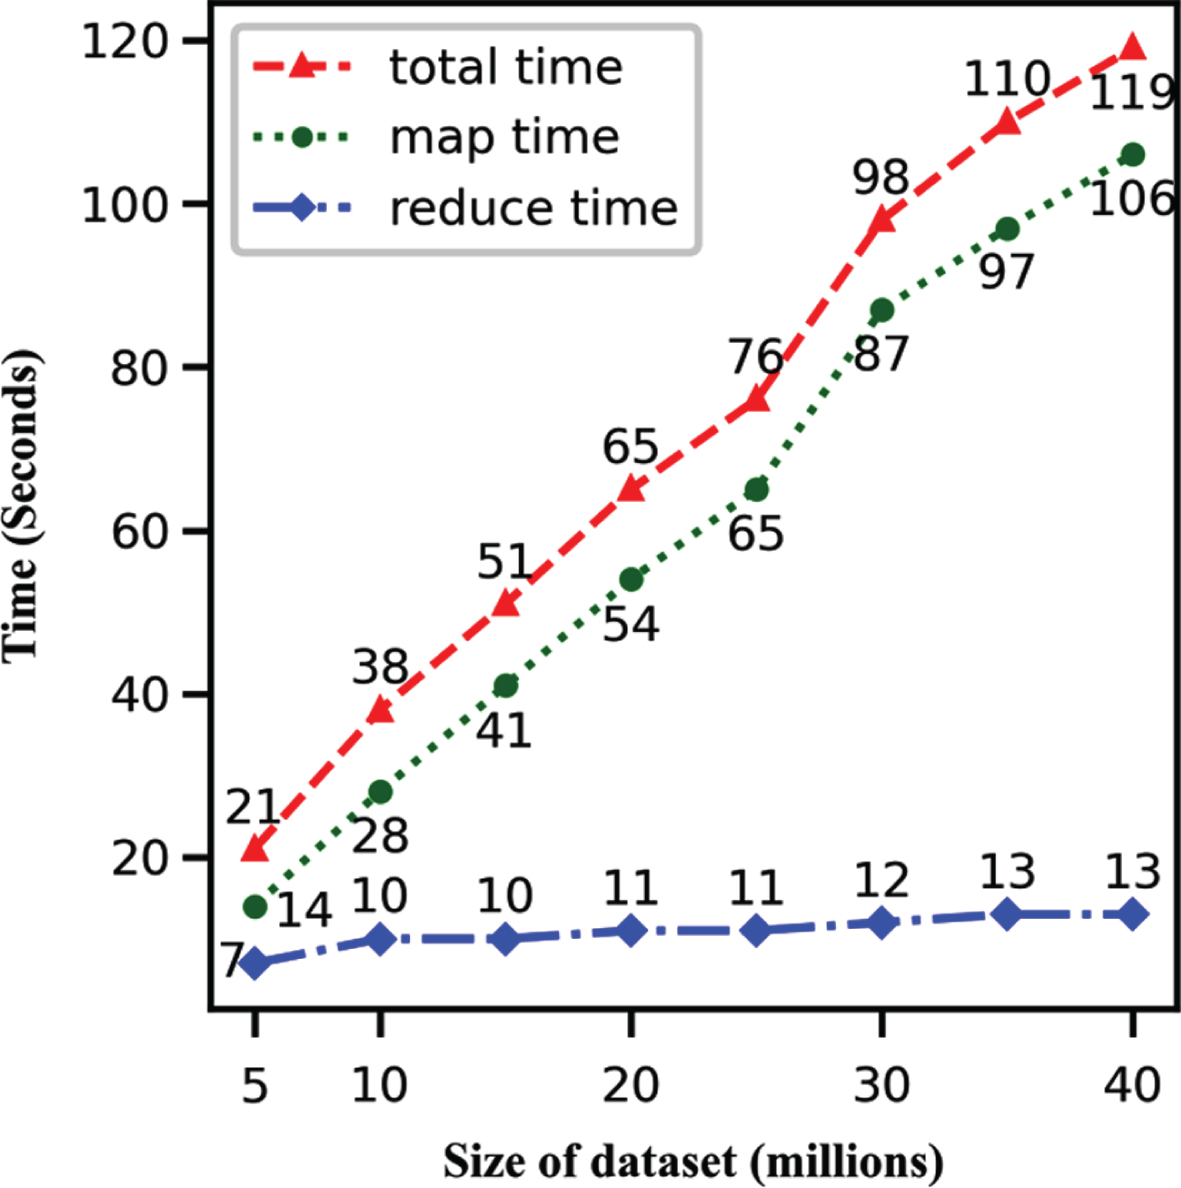
Performance as the size of dataset increases.
In the second experiment, five datasets were generated with 2, 8, 16, 24 and 32 clusters respectively. there are 40 million objects altogether in each dataset. The experimental results are plotted against the number of the clusters in Fig. 3. In the map phase, the number of the objects is the same, so the chunk size is the same too, and hence it takes around the same amount of time to build and rebuild a tree. In the reduce phase, the time complexity is O (kr⌈n/m⌉), the reduce time increases with the increase of r as expected, and in Fig. 3, one can see that the total time scales up almost linearly when the number of the clusters increases.

Performance as the number of clusters increases.
In the third experiment, the system settings were kept the same except for changing the dimension from 2, 10, 20, 30 to 40. There are 1 million objects in each dataset. Since the parameters B, T, n, m and c are the same in these datasets, the time complexity is the same too. The map time, reduce time and total time are plotted against the dimension in Fig. 4. The graph shows that the map time scales up almost linearly with the increase of the dimension, which is because the cost of computation or storage an object is proportional to the dimension. The reduce time deviates slightly from linear as the dimension increases, which is caused by the following fact: the number of the intermediate entries is uncertain and it is always much smaller than ⌈n/m⌉.
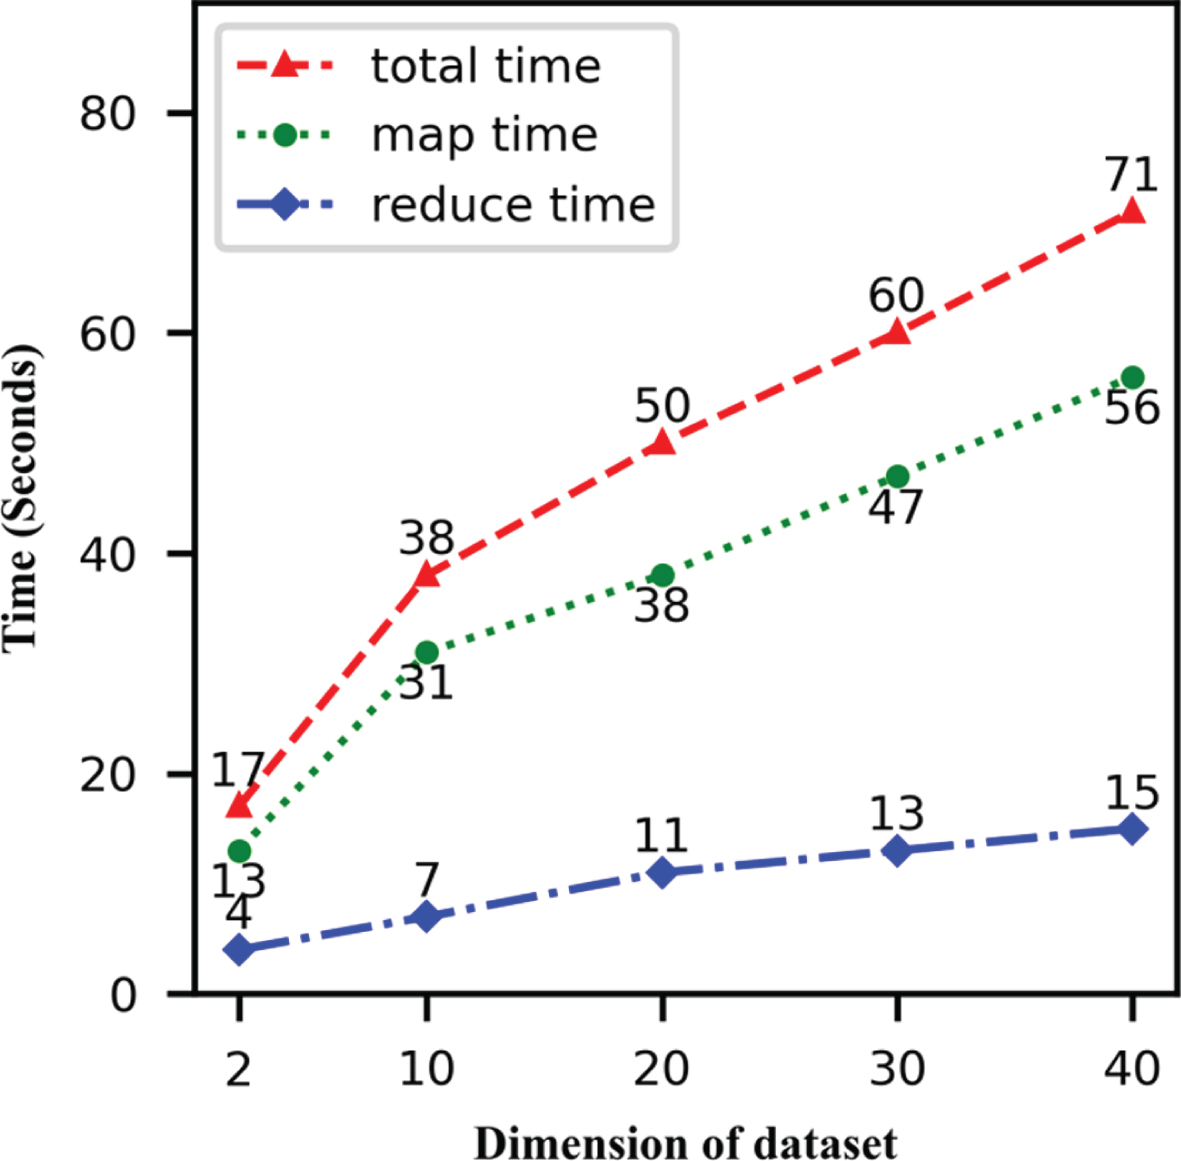
Performance as the dimension of dataset increases.
For evaluating the speedup of MR-BIRCH, a synthetic dataset with 40 million objects and 4 clusters was generated. Two machines were used first, and the additional machines were added subsequently. For the map time, it decreases almost linearly as the number of the machines increases, since the number of the chunk and the chunk size were set the same, and the chunks were processed in parallel. For the reduce time, the number of the intermediate entries are all much smaller than ⌈n/m⌉, and there is only one machine processing the intermediate entries. Considering the transmission cost of the network, the reduce time increases slowly as the number of the machines increases, which has almost no effect on the speedup, so in Fig. 5, MR-BIRCH shows almost linear speedup as the number of machines increased.
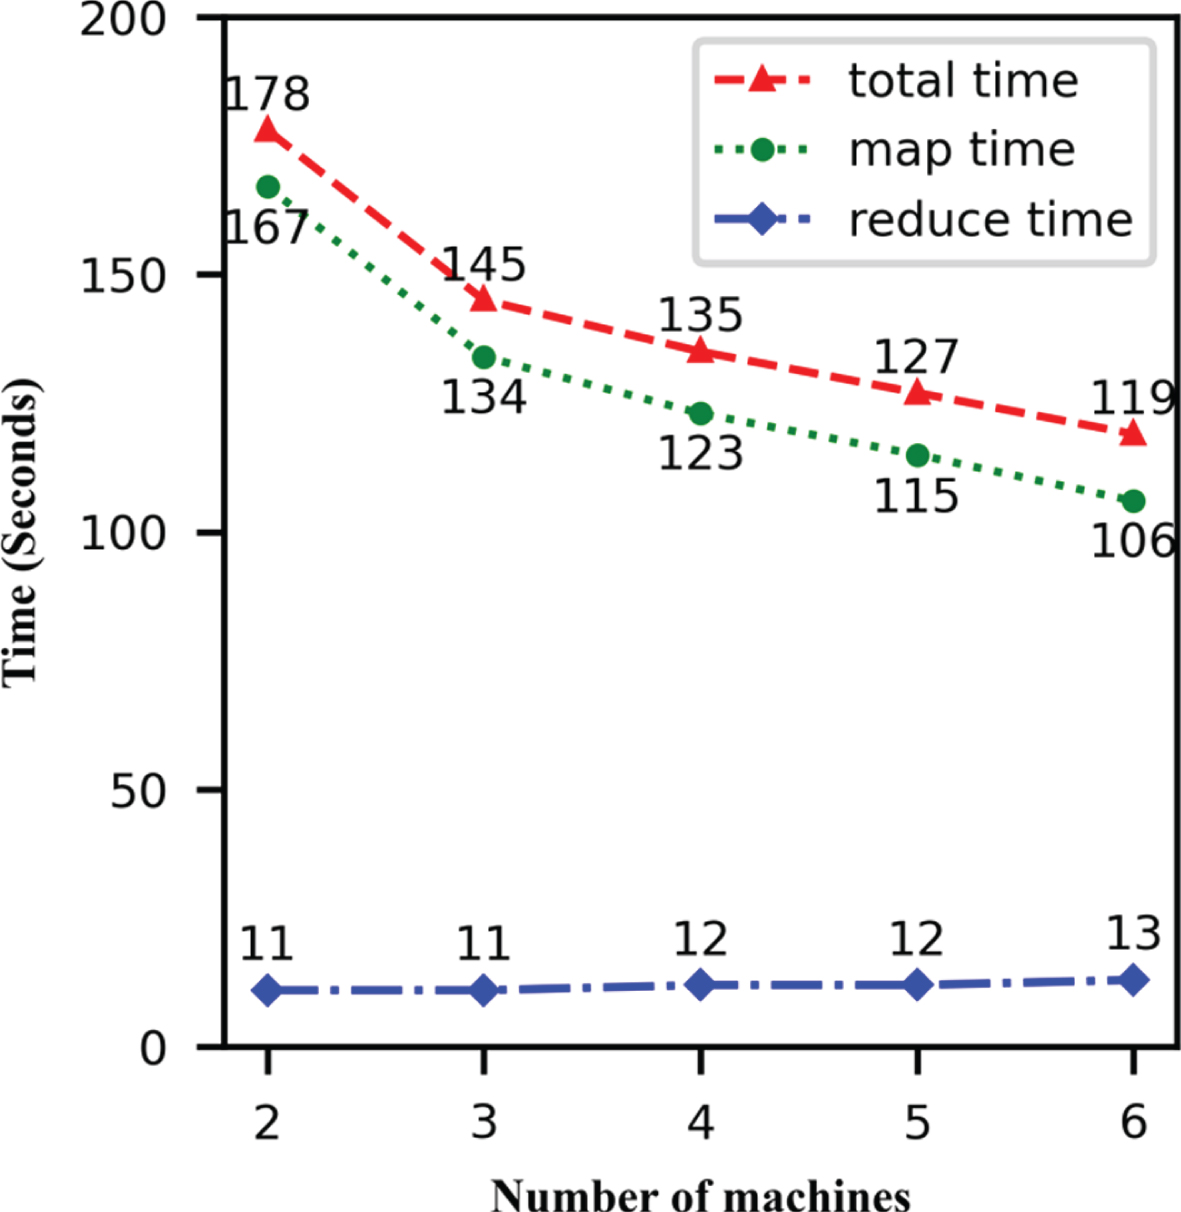
Speedup of MR-BIRCH as the number of machines increases.
The main parameters in map phase include initial entry threshold T, no-leaf node branching factor B and leaf node branching factor L. Considering the initial entry threshold, the result is stable as long as T is not set excessively high, thus the initial threshold is set to zero, and each object is represented by an entry.
When the entries in leaf nodes exceed ⌈c/m⌉, the threshold will increase automatically, and the tree will be rebuilt. If an appropriate threshold can be predicted, the times of rebuilding tree will decrease and some time will be saved. In terms of B and L, as in sklearn BIRCH, they are set to the same value B. If B is set too small, the number of entries in each node will be smaller, and the height of the tree will be higher. On the contrary, if the branching factor is set too large, there will be more entries in a tree node, which will increase the time to merge the entries. Some values around 5 have been tried, and the qualities are almost the same.
Another important parameter is the chunk size c. The maximum chunk size is n, and the minimum chunk size is 1 in theory, but both of the extremes are not practical, so an appropriate value between 1 and n must be selected according to the actual condition. Supposing ⌈n/m⌉ is the maximum number of the entries a machine can process in main memory, the maximum value of c is set to ⌈n/m⌉ to ensure that all the objects can be processed in the map phase, The number of leaf entries emitted to the reduce task in each machine should not greater than ⌈n/m2⌉. Hence, the number of entries in reduce phase is not greater than ⌈n/m⌉, and k-means can run without memory overflow in reduce phase. A smaller c will increase the number of the chunks and improve the parallel degree, but the number of entries in reduce phase will not change. Hence, the chunk size has almost no effect on the clustering quality, and it can be set reasonable according to the performance of the machines.
Comparison to the related algorithms
To evaluate the quality of MR-BIRCH, all of the three real-world datasets and a synthetic dataset Syn_grid were used in this experiment. The dimension and the number of the objects in each dataset are tabulated in Table 2 and Table 3. Syn_grid contains 4 million objects with two clusters. Because the objects have two dimensions and the standard deviation is 1; hence the SSE is about 8 × 10⁶.
In this experiment, MR-BIRCH, Mahout k-means, and sklearn BIRCH were applied on the four databases. The existing clustering algorithms such as HC, k-means and CLARANS, which can cluster a set of points can also be adapted to cluster a set of entries in the third phase of BIRCH [5], extended k-means++ was used in the third phase of MR-BIRCH, and for comparing fairly, sklearn k-means was also used in sklearn BIRCH to cluster the intermediate entries. In this experiment, the execution time refers to the interval from the beginning of loading data to the end of outputting cluster centers, and it does not include the time of computing SSE. The parameter of convergence threshold was set to 0.0001 in the k-means of the three algorithms. For each algorithm, we have tried three different number of iterations, 100, 150 and 200, but there is not significant difference between them, so the maximum iteration was set to 100, that is to say, if the convergence has not achieved even before the 100th iteration, the execution will be cut.
The initial entry threshold was set to 0, and the branching factor B is set to 5 in MR-BIRCH and sklean BIRCH. To compare fairly, the parameter of precomputer_distance is set to false, and the distance between objects had not be saved in sklean k-means. Three different number of clusters 2, 10 and 50 in the three real-world datasets had been tried, but the number of clusters was set to 2 in Syn_grid, for it is just 4. As Table 4 shows, there is not significant difference in the SSE between MR-BIRCH and sklearn BIRCH, which means when BIRCH is fitted into MapReduce, the accuracy hasn’t changed, but MR-BIRCH is always faster than sklearn BIRCH in selfBACK and Syn_grid, because BIRCH is a serial algorithm, and MR-BIRCH is a parallel algorithm, Parallel algorithm is always more effective for larger dataset. In contrast to Mahout k-means, MR-BIRCH always finishes several times faster than Mahout k-means, because for each iteration in Mahout k-means, the dataset must be reloaded into main memory, which is a significant drawback of Mahout k-means. In MR-BIRCH, the dataset is loaded only once in map phase, and the intermediate entries is loaded once in reduce phase.
Comparison of MR-BIRCH and other algorithms
Comparison of MR-BIRCH and other algorithms
A variant of BIRCH based on MapReduce is proposed, and several experiments were performed on both real-world and synthetic databases. At the same time, the scalability and speedup experiments were performed, when the number of the objects, the number of the clusters, the number of the dimensions, and the number of the machines increased independently, the algorithm scaled up well and the speedup is almost linear. MR-BIRCH was compared with sklearn BIRCH and Apache Mahout k-means algorithm, the results show that it performs better both in accuracy and speed.
In the experiments, some objects are assigned wrong to the clusters in synthetic dataset, because the objects are far from their centers, and they are assigned to the nearer cluster. In reduce phase, k-means is used to cluster intermediate entries, it is sensitive to abnormal point, which affects the stability of the result. For future work, some novel approaches will be integrated with k-means. In addition, a different distance calculation, such as log-likelihood distance calculation [34, 35] will be used for enabling MR-BIRCH to cluster not only the dataset with continuous attributes, but also that with categorical attributes. Another exciting direction is to embed an automatic clustering algorithm for clustering dataset without inputting the number of clusters in the final phase.
Footnotes
Acknowledgments
This research is supported by the National Natural Science Foundation of China (61741213).