
Abstract
The selection of feature genes with high recognition ability from the gene expression profiles have gained great significances in biology. However, most of the existing methods for feature genes selection have a high time complexity where lead to a poor performance. Motivated by this, an effective feature selection method, called Fisher transformation (FT), is proposed which based on the improved Fisher discriminant analysis (FDA) and neighborhood rough set algorithms. The FT method has two benefits: 1. The multiple neighborhood rough set algorithm is used for solving the small sample size problem of FDA; 2. The improved FDA algorithm is used for selecting feature genes and ameliorating poor ability of classification. Furthermore, we measure the impact of the FT approach on the final selection consequence. The results obtained on four public tumor microarray datasets provide beneficial insight on both the benefits and limitations, paving the way to the exploration of new and wider feature selection programs.
Introduction
Tumor develops either through acquired mutations or epigenetic change that causes differential gene expression profiles in the cancerous cells. Microarray technology is pervasive used in the area of genomic research in identifying differentially expressed genes, activation of oncogene pathways and detect in novel biomarkers for clinical tumor diagnosis [1, 2]. Samples of microarray datasets often are fewer than 200 each having more than thousands of genes. Since the number of genes is typically larger than the number of samples, classification of microarray data is subjected to the curse of dimensionality [3, 4].
To take the effect of gene sets on tumor classifications into consideration, two types of feature selection methods have been employed: wrapper methods and filter methods [5]. Wrapper methods seek through the space of possible feature gene subsets and estimate the quality of feature subset S in terms of prediction accuracy [6]. For example, the Markov Blanket (MB) [7] was introduced into incremental wrapper based FSS process, rather than evaluated the quality of all the features ranked by filter method. Inza [8] used a greedy search algorithm called sequential forward selection and various supervised learning machines to find expressed genes and showed that with a notably reduced number of genes, the classification accuracy was improved significantly. In contrast, filter methods consider a subset of features are selected in a pre-processing step, and then the selected features are used to design a classifier [9]. Nguyen T [10] proposed a novel method for genes selection based on a modification of analytic hierarchy process (AHP). Dan [11] proposed a MRMR (Max-Relevance and Min-Redundancy) criterion. Wrapper methods usually result in better performance in classification tasks. However, it has higher time complexity and unsatisfactory in the generalization capability. In contrast, The calculation of filter methods are typically much faster than wrapper methods and it is suitable for gene expression profile datasets [12].
The Fisher discriminant analysis (FDA) algorithm [13] is a classical feature selection method in the form of filter, widely employed in biological information processing. The goal of FDA algorithm is to find an optimal projection which makes the samples are divided more perfectly (i.e. seek the optimal projection by maximizing the ratio of the between-class and within-class scatter matrices of the projected samples). In recent years, spectral graph theory is applied in FDA algorithm, which combined with local manifold data mining and between-class discrimination method. In order to cope with the high dimensionality, Yan [14] proposed a marginal Fisher analysis method in which the intrinsic graph described the distance of intra-class and combined each data point with its neighboring points of the same class. On the contrary, the penalty graph considered the marginal points and describes the inter-class divisibility. He [15] put forward a novel semi-supervised method called maximum margin projection (MMP). MMP is designed for discovering the local manifold structure. However, all of these methods often encounter small sample size (SSS) problem [16].
At present, several methods were utilized in solving the SSS problem (e.g. pseudo-inverse, pre-processing method, perturbation method and singular value decomposition) [17]. Pre-processing strategy is used for feature selection, and aims to reduce the dimensionality of the original data to a certain degree and ensure that the within-class scatter is reversible. For instance, Fisherface method [18] uses principle component analysis to reduce data dimensionality to (n - c)-dimensionality, where n is the number of samples and c is the number of classes, and then uses linear discriminant analysis (LDA) to projection. Indeed, the two-step processing strategy achieves more reliable and robust selection results [19].
Numerical attribute reduction based on neighborhood rough set (NRS) algorithm has caused wide public concern over the recent years [20]. Many studies have shown that it takes a good effect in terms of stability, especially in the context of high-dimensional [21, 23]. The value of neighborhood is directly related to the setting of threshold in NRS algorithm, a proper threshold δ results in a subset with highly predictive features. However, global neighborhood in this field is often used for dealing with the decision system (i.e. each sample uses the same neighborhood value in different condition attributes combination). While this method has a high time complexity, and it does not result in the optimal δ value [24].
In order to solve the problems of scatter in within-class variance matrix of FDA algorithm and poor classification performance in classifying gene expression profiles, a novel feature selection method, called Fisher transformation (FT), is put forward in this paper to classify tumor microarray datasets. The pre-processing strategy is used for feature selection and guaranteeing the within-class scatter reversible, which reduces the dimensionality of the original data to a certain degree. Firstly, improved multi-neighborhood is adopted for rough set method, and the original data are mapping in a low-dimensional space. Then the improved maximizing margin Fisher criterion algorithm is used for feature selection by introducing a scaling factor with the purpose of making full use of scale invariant of weight matrix. Finally, the performance of various classifiers is compared based on the selected feature gene datasets. Our results showed that the FT method selects a small set of non-redundant disease related genes, with high specificity.
Basic concepts
Neighborhood rough set
Rough set theory is believed to be a promising algorithm for feature selection, but it has low classification accuracy for the genomic datasets. A key reason is that the continuous real type of gene expression profiles needs discretization. However, neighborhood rough set provides a new opportunities for dealing with numeric attribute set [25].
The boundary of decision system is defined as
Positive domain and negative domain of neighborhood decision system are defined as
The dependency degree of D - B is defined as
It can be concluded from the above equations that the attribute dependency k
D
is monotonous, if B1 ⊆ B2 ⊆ … ⊆ A, then γ
B
1
(D) ≤ γ
B
2
(D) ≤ ⋯ ≤ γ
A
(D). If condition attribute a ∈ B, then the contribution of a single feature a to the approximation of D can be defined as
The aim of feature selection is mapping the original data points into a low-dimensional space and saving the geometric topological properties between the data points. An ideal low-dimensional space of the best mapping should attempt to maximize the inter-class dissimilarity and minimize the intra-class dissimilarity. In more detail, FDA algorithm defines the separation between two distributions to be the ratio of the variance between-classes to the variance within-classes. It is generally supposed that the FDA algorithm has explicit mapping relationship between high-dimensional data u
i
and low-dimension Y
i
, that is
In a given space U (number of sample N with d-dimensionality), the mean vector m
i
of various types
Within-class scatter matrix S
i
and global within-class scatter matrix S
w
Global between-class scatter matrix S
b
Set w1, w2, … w c are c types, S b , S w and S t are represented by global between-class scatter matrix, within-class scatter matrix and global population scatter matrix.
FDA criterion function is defined as follows.
Generalized FDA criterion function is defined as follows.
Multiple neighborhood rough set
The neighborhood calculation matter to neighborhood rough set, it is crucial to choose which kind of measures to calculate the degree of similarity between genomic datasets. In the study of neighborhood rough set, the value of neighborhood is set basically by experience and the experiment. In addition, a common way of dealing with the decision system is usually adopted global neighborhood (i.e. each sample uses the same neighborhood value in different condition attributes combination). Experiments found that: 1) Small changes in parameter δ will have a significant impact on attribute reduction and rule extraction; 2) The optimal parameter δ is obtained through the search algorithm, which often requires a higher time complexity, and it can not even get the optimal parameter δ. The main cause of this situation lies in the various distribution of data. It usually dificultly to accurately describe the data which using the same value of neighborhood. Moreover, the classification results fluctuate with the change of parameter δ and affect the stability of model.
Considering from the generalization of model, the Euclidean Distance function is chosen as the measure criterion, which is the most common method when dealing with real data types and it can be used to prevent over-fitting to a certain degree. In addition, the neighborhood could influence the interaction among the different attributes in neighborhood rough set algorithm, and some genes may produce negative effect under the interaction of classification. Therefore, we propose a multiple neighborhood rough set algorithm (i.e. set different neighborhood for each attribute).
In a given decision table DT = (U, A ∪ D, { V
a
} , f
a
) a∈A, Euclidean Distance Δ (x, y, R) of feature subset R ⊆ C between any two points x, y ∈ U is
In feature subset R, Euclidean Distance is used for calculating neighborhood for each attribute value. For each x ∈ U, multiple neighborhood limited by feature set R is defined as
The number of genes is typically larger than the number of samples for microarray data. An effective way is mapping the original data into a low-dimensional space and the topological property between the data points not change or as close as possible. The low-dimensional space of the best mapping is the distance between different categories keep a greater distance, and the same categories are close to each other. FDA criterion function is skillfully combined the within-class scatter matrix with between-class scatter matrix on the projection vector. The physical interpretation of taking maximization goal function J f (u) vector V as the projection direction: the ratio of within-class scatter matrix and between-class scatter matrix is maximum after the sample projection [26].
However, conventional FDA algorithm reflects weak ability of classification. In order to overcome these limitations, improved maximizing margin Fisher criterion is applied in a novel nonlinear feature selection method.
The conventional maximizing margin criterion [27] is defined as
Trace tr of covariance matrix represents s (m
i
) in statistics. Equation (17) can be rewritten as
To significantly improve the classification performance of the genomic datasets, we introduce a scaling factor in Equation (18) with the purpose of making full use of scale invariant of weight matrix. Firstly, keeping the centroid unchanged. Then the scaling operation is performed between the same class datasets and centroid. Namely, the between-class matrix S
b
remains unchanged. Moreover, scaling operation result in more closely associated within-class matrix S
w
. The derivation process is denoted are shown in Equations (21, 22). where μ is the scaling factor (μ ≥ 0), Y
i
is embedding vector of low dimensional. Combining with Equation (8), the improved maximizing margin criterion can be worked out.
In more detail, the best projection direction V is under maximization J conditions. The largest eigenvalue corresponding to eigenvector is the best projection direction in FDA algorithm. If we select the first d eigenvalues (sorted from big to small) corresponding to eigenvectors as the projection direction. Thus the sample is mapped to a d-dimensionality space.
The large number of features and small number of samples may lead to some matrix non-reversible in the process of operation (i.e. SSS problem) in FDA algorithm, and neighborhood rough set has outstanding performance in attribute reduction. Therefore we propose an effective FT method for the selection of feature genes. Firstly, multiple neighborhood rough set algorithm is used for attribute reduction which can map into a new feature space. Then the improved maximizing margin Fisher criterion algorithm is used for feature selection and finding better scaling factor. Feature genes selection using Fisher transformation method description is shown in Algorithm 1Algorithm 1.
Datasets
In order to verify the effectiveness of the proposed FT algorithm, four public tumor microarray datasets are used for making simulation experiment. Specially, all of them represent binary classification tasks. Detail information of datasets is shown in Table 1.
Experimental datasets
Experimental datasets
All numerical experiments are performed on a personal computer with a 3.1 GHz AMD Athlon(tm) II and 4 G-byte of memory. This computer runs Windows 7, with Matlab-R2010 and Weka-3.9.0.
PCA algorithm is used for analyzing four gene expression profile datasets before FT method, and drawing pareto diagram (i.e. the information in genomic data) of the principal components explained variance for each dataset (blue curve said before the information content of total n genes). The results are shown in Fig. 1.

Pareto diagram of the principal components explained variance.
The accumulation contribution rate of most datasets (except Lung datasets) reaches more than 90 percent when the principal components of datasets are 50 (see Fig. 1). It illustrates gene expression profile datasets contain a large amount of redundancy (i.e. irrelevant and confounding factors) and the number of feature genes are a small set, so it is necessary to remove the redundancy before genes selection operation. It also verifies that the FT method is effective which using multiple neighborhood rough set algorithm to remove the redundancy (i.e. pre-processing strategy).
After repeated trials, we set the threshold r = 0.56, attribute significance lower limit β = 0.01 and scaling factor μ = 0.4. We explore the optimal threshold of eigenvalue k: from k = 2 to k = 15 (i.e. k is the number of feature genes). The average accuracy result, along with the change of eigenvalue k, is shown in Fig. 2. The average correct rate and number of feature genes are shown in Table 2.

Classifier results.
Number of selected genes and average correct rate
The curve overall shows a declining trend (see Fig. 2) and the number of feature genes is less than 10, which illustrate that the average correct rate is obvious difference for different eigenvalue k and the number of feature genes do not necessarily have a positive association with classification performance. In order to validate the effectiveness of the FT method for genomic datasets, we test the classification performance of feature genes from the following four aspects. Differentially expressed of feature genes
An important indicator of feature selection is classification performance (i.e. the gene expression level in abnormal and normal tissue samples). The t-statistic is used for testing the gene expression level (i.e. significantly in abnormal and normal tissues), in a given level of significance α = 0.05 to t-statistic. Inspection of the original problem H0 : μ t - μ n = 0, the alternative hypothesis H1 : μ t - μ n ≠ 0, in which μ t , μ n are the means of gene expression level in abnormal and normal tissue samples. The means of feature genes selected in abnormal and normal tissue samples are shown in Fig. 3.
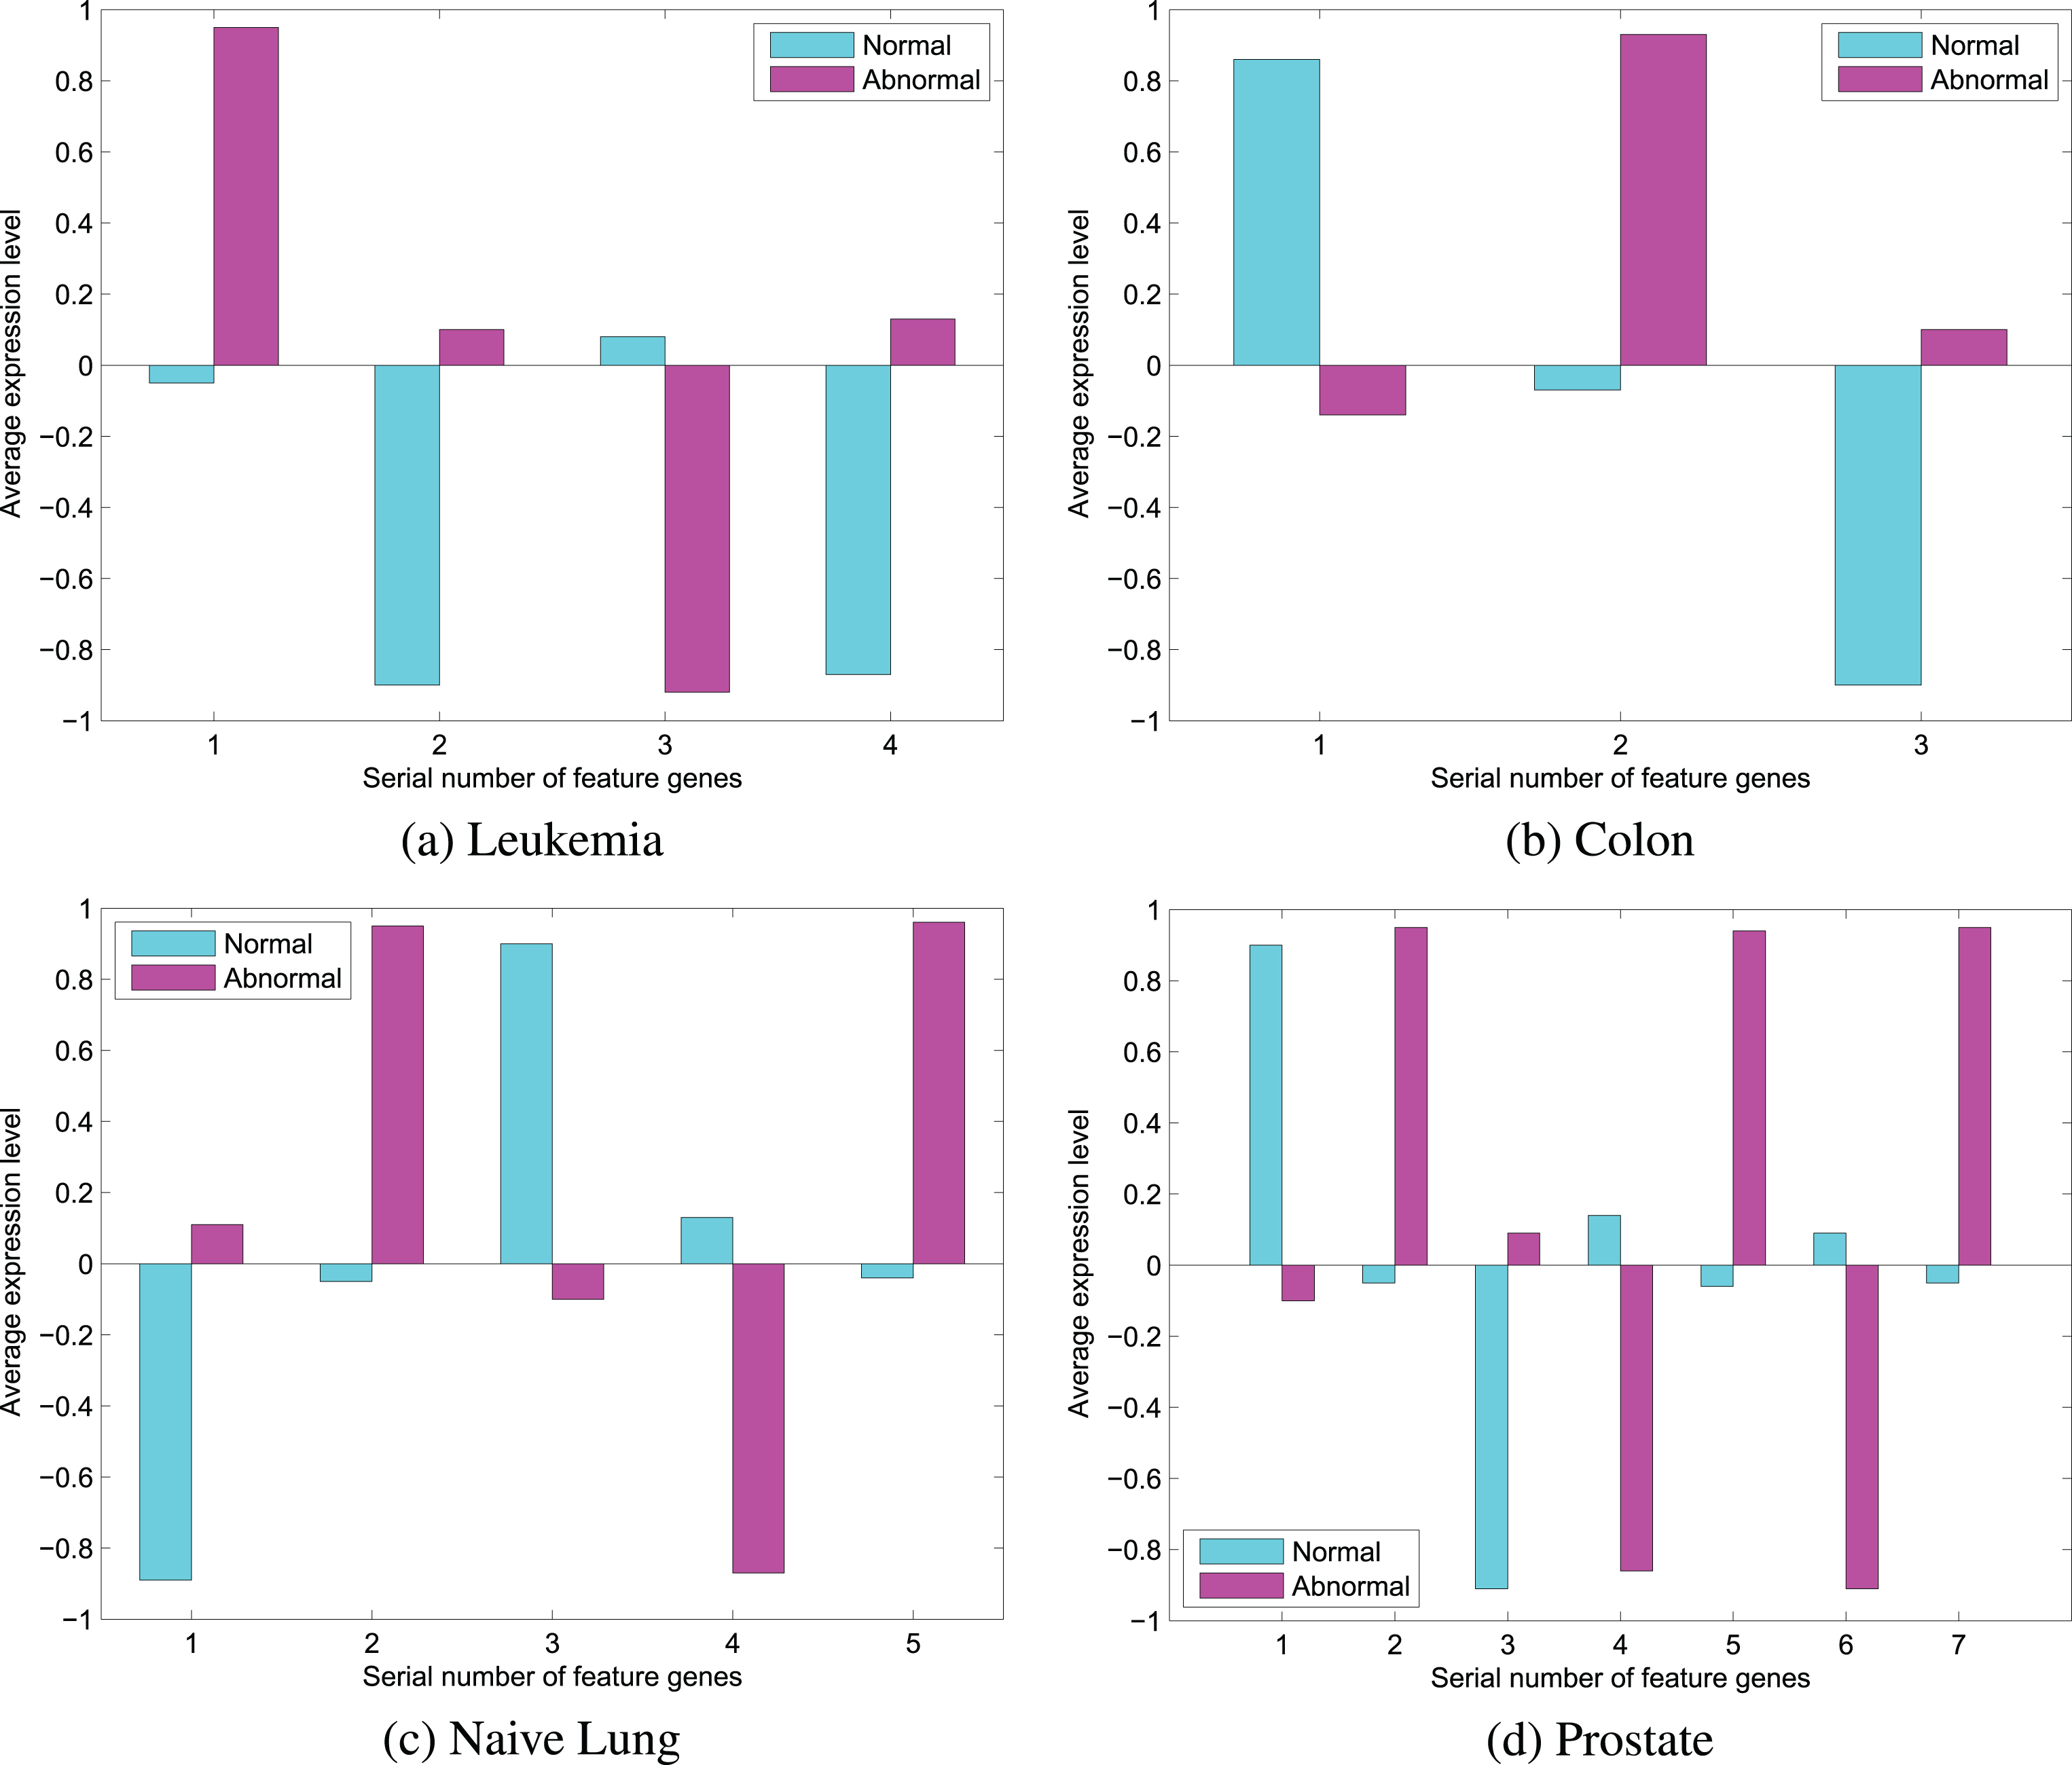
Differentially expressed genes of feature subsets.
All these gene expression level of feature genes in abnormal and normal tissue samples are significantly different (see Fig. 3). e.g. four Leukemia feature subsets are selected by FT method, in which No. 1, 2 and 4 genes show low levels expression in normal tissues, but No. 3 gene shows high level expression in normal tissues. In prostate datasets, No. 2, 3, 5 and 7 genes show low level expression in normal tissues; No. 1, 4 and 6 genes show high level expression in normal tissues. The result illustrates the feature subsets extracted by the FT method has super-discriminative capability. Not only does different expression of feature gene subsets provide reliable information for classification, but it makes people more intuitive understanding the characteristics on the gene expression in tumor tissues by comparing with the behavior of gene expression in normal tissues. It is helpful to distinguish tissues between normal and abnormal, and it provides an important basis for further research to understand the mechanism of tumor and clinical treatment. Classification performance of feature genes
In order to verify the classification performance of FT method, we use several kinds of common classifiers in Weka tool to classify gene expression profile datasets, and other experiments are carried out in the same way without using pre-processing strategy (i.e. direct classification). Experiments use 10-fold cross-validation, the results are shown in Table 3.
Classification precision comparing results of different classifiers
(Note: The result of direct classification in the left slash (/); The result of FT method in the right slash (/))
The selected feature genes in this paper show a good classification performance for normal and abnormal tissue samples. Classification accuracy, in comparison to the method which does not use the de-noising steps (i.e. pre-processing strategy) is greatly improved (see Table 3). In summary, the feature selection method in this paper keeps the ability of classification unchanged. The FT method presented is feasible and effective. The differences of different feature selection methods
To further validate the effectiveness of our method and the differences among different feature selection methods, several existing classical algorithms are used in our experiment, i.e. ODP (original data processing), PCA, NRS and Fisher. In addition, we set the same threshold for NRS and multiple NRS algorithms to guarantee the feasibility and effectiveness of contrast experiments. The Lib-SVM classifier in Weka tool is used to simulate experiments, classification results are shown in Fig. 4.

Classifier results.
The ODP method gets the lowest accuracy (e.g. test accuracy of Leukemia datasets is 65.27%, which is lower than PCA and other methods), and it shows that gene expression profile datasets contain much redundant information (see Fig. 4). In addition, NRS and Fisher methods are neck-and-neck for the classification accuracy which are not as good as FT method. However, other methods use attribute reduction operation (i.e. pre-processing strategy) which make classification accuracy improved. It is clear that the removed redundant information improves the genes classification accuracy. Conversely, redundant features may reduce the judgment ability of datasets. The FT method has an outstanding ability in classification. Compared with the related research of the latest methods
To verify the differences between our method and the latest research, six feature selection methods are used for comparison which represent of some relevant algorithms proposed or improved by domain experts in recent years. Literature [32] FBFE and other algorithms are used for feature selection in gene expression profiles. Lib-SVM classifier in Weka tool is used to simulation experiment. The number of feature genes and classification results are shown in Table 4 and Table 5.
No. of selected genes
Classification precision of different feature selection methods
(Note FBFE: fuzzy backward feature elimination; PSO-dICA: discriminant independent component analysis based on PSO; BDE: binary differential evolution; DRF0: the distributed ranking filter approach removing the features with information gain zero from the ranking; BQPSO: distributed feature selection: an application to microarray data classification; ILASSO: iterative lasso)
In this paper, the FT method gets less number of feature genes and higher accuracy are shown in Table 4 and Table 5, e.g. Colon data, the relevant methods (such as FBFE) get lower classification precision than our method and select less number of feature genes. Comparing with these latest algorithms, individual methods (e.g. BQPSO algorithm is used for Leukemia and Prostate datasets) seem to be a slightly better preference in terms of accuracy. However, it selects 9 and 10 feature genes more than our method 4 and 7. To summarize, the FT method achieves higher classification accuracy than BQPSO, IGA and other algorithms, and the number of selected feature genes are less, which validate the effectiveness of feature selection method. Therefore, with the FT feature selection operation, the classification process can be speeded up by reducing dimensionality. The accuracy is considerably higher compared to the conventional techniques.
In this work, we explore the effects and benefits of FT method in the context of feature selection from high-dimensional genomic data. Specifically, using the pre-processing strategy, improved FDA method is applied in feature selection tasks. The main contributions of our study are follows: We analyze Fisher on both benefits and limitations, and propose the improved maximizing margin Fisher criterion in solving the within-class covariance singularity and poor classification ability problems; Multiple neighborhood rough set method is proposed to solve SSS problem for the gene expression profiles in NRS method.
The results of our experiments give insight on both predominance and inferior position of FT method and could represent a useful starting point to better understand the behavior of these techniques as well as the extent of their applicability to specific tumor problems. In more detail, we study on intrinsic genomic information to better understand pathogenesis of tumor, and provide reference for the clinical treatment of tumor. However, our research is only in view of binary classification, so we will focus on multiclass gene problems for future research.
Footnotes
Acknowledgments
This work is supported by National Natural Science Foundation of China (Nos. 61370169, 61402153, 60873104), Project funded by China Postdoctoral Science Foundation (No. 2016M602247), Key Project of Science and Technology Department of Henan Province (Nos. 142102210056, 162102210261).