
Abstract
Education policy makers view measuring academic texts readability and profiling classroom textbooks as a primary task of education management aimed at sustaining quality of reading programs. As Russian readability metrics, i.e. “objective” features of texts determining its complexity for readers, are still a research niche, we undertook a comparative analysis of academic texts features exemplified in textbooks on Social Science and examination texts of Russian as a foreign language. Experiments for 7 classifiers and 4 methods of linear regression on Russian Readability corpus demonstrated that ranking textbooks for native speakers is a much more difficult task than ranking examination texts written (or designed) for foreign students. The authors see a possible reason for this in differences between two processes: acquiring a native language on the one hand and learning a foreign language on the other. The results of the current study are extremely relevant in modern Russia which is joining the Bologna Process and needs to provide profiled texts for all types of learners and testees. Based on a qualitative and quantitative analysis of a text, the research offers a guide for education managers to help build consensus on selecting a reading material when educators have differing views.
Introduction
Modern communication as ’the imparting or exchanging of information by speaking, writing, or using some other medium’ (Oxford English Dictionary, 1996) implies either generating or receiving a text, which may be handwritten, printed, electronic or oral. Successful communication in its turn largely depends on whether the amount, content and structure of the quanta of the information sent by its generator in the text and received by the addressee are similar or in an ideal situation is the same. Thus, for the information of any text (written or oral) to be elicited, processed and stored in the recipient’s mind, it is important that the text itself aligns with the cognitive and linguistic abilities of the recipient. Matching a text to the target audience is a problem relevant in a number of spheres: the military, education, PR, advertising, government, business, publishing, medicine and social relations as these are the areas where communication is the foundation of success. The research shows that companies suffer damages and take financial hits if the texts to which they expose their customers are hard for the average reader to read [1]. If a text is too easy, i.e. primitive for the audience, readers lose their interest and stop reading. In modern science the problem of text complexity is positioned within a wider problem of ‘text – reader’ and is correlated with the notions of text readability and text complexity. Text readability/complexity is generally defined as the total amount of factors influencing success of reading by the target audience. The latter in its turn is dependent on the degree of reading comprehension at a certain reading speed and maintaining interest in the content of the text. Modern researchers address the problem of ‘the text – reader correspondence’ in two different ways: (a) from the point of view of the reader and his/her individual characteristics, such as age, education, background information, memory span, etc; and (b) from the point of view of the text and its objective features, such as length and ‘complexity’. In this research aimed at revealing the effectiveness of various algorithms in ranking complexity/readability of academic text we diversified the main features: a set of linguistic features affecting complexity/readability of the text and the size of the text. The best results were obtained for the complete set of text features and the longest of all the analyzed texts. The application of methods of machine learning allowed us to take into account number of features simultaneously while earlier no more than a range of three variables was used to assess text complexity/readability. The results obtained also demonstrate that ranking readability of educational texts is a much more difficult task than ranking texts of tests. The latter is probably caused by the language proficiency, i.e. the range and size of the active vocabulary of the target audience: native language proficiency among pupils of the 5th -11th grades is relatively comparable resulting in readability values of academic texts of grades 5 - 11 being very much close or even similar to each other.
Linear models for Russian academic texts
The Flesch Reading Ease (FRE), and the Flesch – Kincaid Grade Level (FKG) [2] are two readability tests designed to indicate how difficult is a passage in English for understanding. Based on the differences between Russian and English, discovered by Oborneva in 2006 [3], the researcher adapted the Flesch Reading Ease Readability Formula for Russian texts as follows:
The formula takes into account two variables: ASL – the average number of words per sentence, and ASW – the average number of syllables per word. The following two modified linear models were obtained based on the corpus of school textbooks on Social Studies [4, 28]. Features of the model are presented below (referred to as Russian Readability Formulas: RRF-1 and RRF-2):
In the paper we aim at the following research questions (RQ):
Related works
Matching a text to the target audience is a problem relevant in a number of spheres: management, the military, education, PR, advertising, government, business, publishing, medicine and social relations as these are the areas where communication is the foundation of success. Text readability as a problem attracts a number of researchers [5–7], basically for English.
State of the art studies in the field of ranking readability of texts use various methods of machine learning [8–16].
The task of searching and evaluating the complexity of texts for teaching languages for a wide range of languages was carried out in [17]. In this work, the authors use Principal Component Analysis to select features able to rank readability of texts.
Similarly, a series of works [18, 21–24] has been devoted to automatic classification of readability/complexity of tests of Russian as a foreign language. Several classification algorithms were considered in [18]: Random Forest, NNge (nearest-neighbor with non-nested generalized exemplars), FT (Functional Trees), Multilayer Perceptron, and SMO (sequential minimal optimization for support vector machine) from WEKA data mining software [19]. Random Forest [20] is a commonly used classification algorithm, the merits of which are well known. It was also successfully used in [21, 22]. Several methods were applied in [24]: Classification Tree, SVM, and Logistic Regression models. One of the methods of linear regression is the Ridge Regression was used in [23]. The best result for the standard F1-measure = 0.67 was obtained in [18, 21]. To the best of our knowledge, no studies have been carried out in the area in which methods of machine learning were used for ranking readability/complexity of academic texts for secondary schools in Russian.
Dataset
Collecting a corpus of school textbooks
We chose to compile a corpus of Social Studies classroom textbooks based on the assumption that their usefulness in the research of this kind is higher than other discipline textbooks as they do not contain charts, maps, pictures and graphs of any kind which may contribute to text readability. Thus, by providing ‘pure texts’ we eliminate possible ‘noise’ of text accompanying elements. As it was mentioned earlier we compiled a corpus of 14 classroom books: 7 textbooks for grades 5-11 edited by Nikitin and 7 textbooks edited by Bogolubov. The sizes of documents are measured in tokens, i.e. the total number of words in a text. Star sign (*) denotes the so-called ‘advanced’ versions of textbooks, i.e. tailored to preferences and interests of more advanced students in the corresponding grades. Students using these books usually target at sitting a matriculation exam (EGE) in the subject. Sign “–” denotes absence of a textbook of a particular author for the corresponding grade in the corpus. The total size of the corpus is presented in Table 1 which contains the number of tokens in each of the documents as well as labels of readability derived in the following way: we manually assigned the corresponding grade of a particular textbook to as a target variable value (‘grade level’).
Sizes (in tokens) of documents in the RRC corpus
Sizes (in tokens) of documents in the RRC corpus
For instance, value “8” corresponds to two textbooks (8 BOG, 8 NIK) used as a part of Social Studies course during the 8-th year of studies in Russian secondary schools.
For convenience, we have preprocessed all texts from the corpus in the same way. Common preprocessing included tokenization, splitting text into sentences and part-of-speech tagging (with the help of the TreeTagger for Russian 1 ). During the preprocessing step we excluded less than 1. The reasons for the latter are stated below. Extremely short sentences appear mostly as names of chapters and sections of the textbooks studied or a result of incorrect sentence splitting. They lack a grammatical structure of a sentence presenting a sequence of words, i.e. word combinations. Moreover sentences with five to seven words are viewed as short sentences in Russian, as the average sentence length (in our corpus) is higher than ten. We also eliminate sentences longer than 120 words as all of them are quotations from Constitution of the Russian Federation and present samples of a different type of discourse. As the average sentence length is a very important feature in text complexity assessment and hence should not be biased by unrepresentative patterns it was decided to exclude both patterns (shorter than 5 and longer than 120) from the Corpus. To ensure reproducibility of results, we uploaded the corpus on the website thus providing its availability online 2 .
Sampling from the corpus
Modern views on the size of a representative corpus are based on the notion that all text features have definite frequency patterns which differ for different types of texts, genres, and discourse. A corpus becomes representative when its size is ample for all its features to be exemplified with their typical frequency. Researchers have accumulated a certain amount of knowledge on various text features occurrences: e.g. Biber’s studies [25] revealed a relative stability of grammatical features of a text across 1,000-word samples of number of linguistic features in the English language: pronouns, contractions, past and present tense and prepositions. Biber also confirmed that “linguistic tendencies are quite stable with ten (and to some extent even five) text samples per genre or register” [25]. Though it is obvious that text features occur with a definite regularity, thus making their average metrics, these regularities are still research niches for many types of Russian academic texts of different complexity levels. E.g. we do not know average academic metrics for academic texts aimed at children of different academic age. Thus, we compiled a corpus of 14 academic texts, a complete set of texts of textbooks of two authors, Nikitin and Bogolubov on Social Studies, and marked the corpus as RRC (i.e. Russian Readability Corpus). As it was mentioned earlier, RRC contains 14 documents and thus by no means could be treated as a representative sample of the population of the school textbooks under study. Building a larger corpus is difficult, because it would violate some of the key properties: either new texts will come from other domains, or texts will come from different authors with different writing styles. Both cases of this kind may add noise to the existing dataset.
In order to overcome the problem of the limited size of the collection, the following procedure of sampling from the corpus was suggested in [4]. It is assumed, that text complexity measured on a (significant) part of a text should be close to the complexity of the whole text. This assumption means, that starting from a certain subset (or a sample) of sentences, text complexity of the sample is to be almost the same as text complexity of the whole document from a corpus. The actual plots of the complexity metrics are represented in Fig. 1.
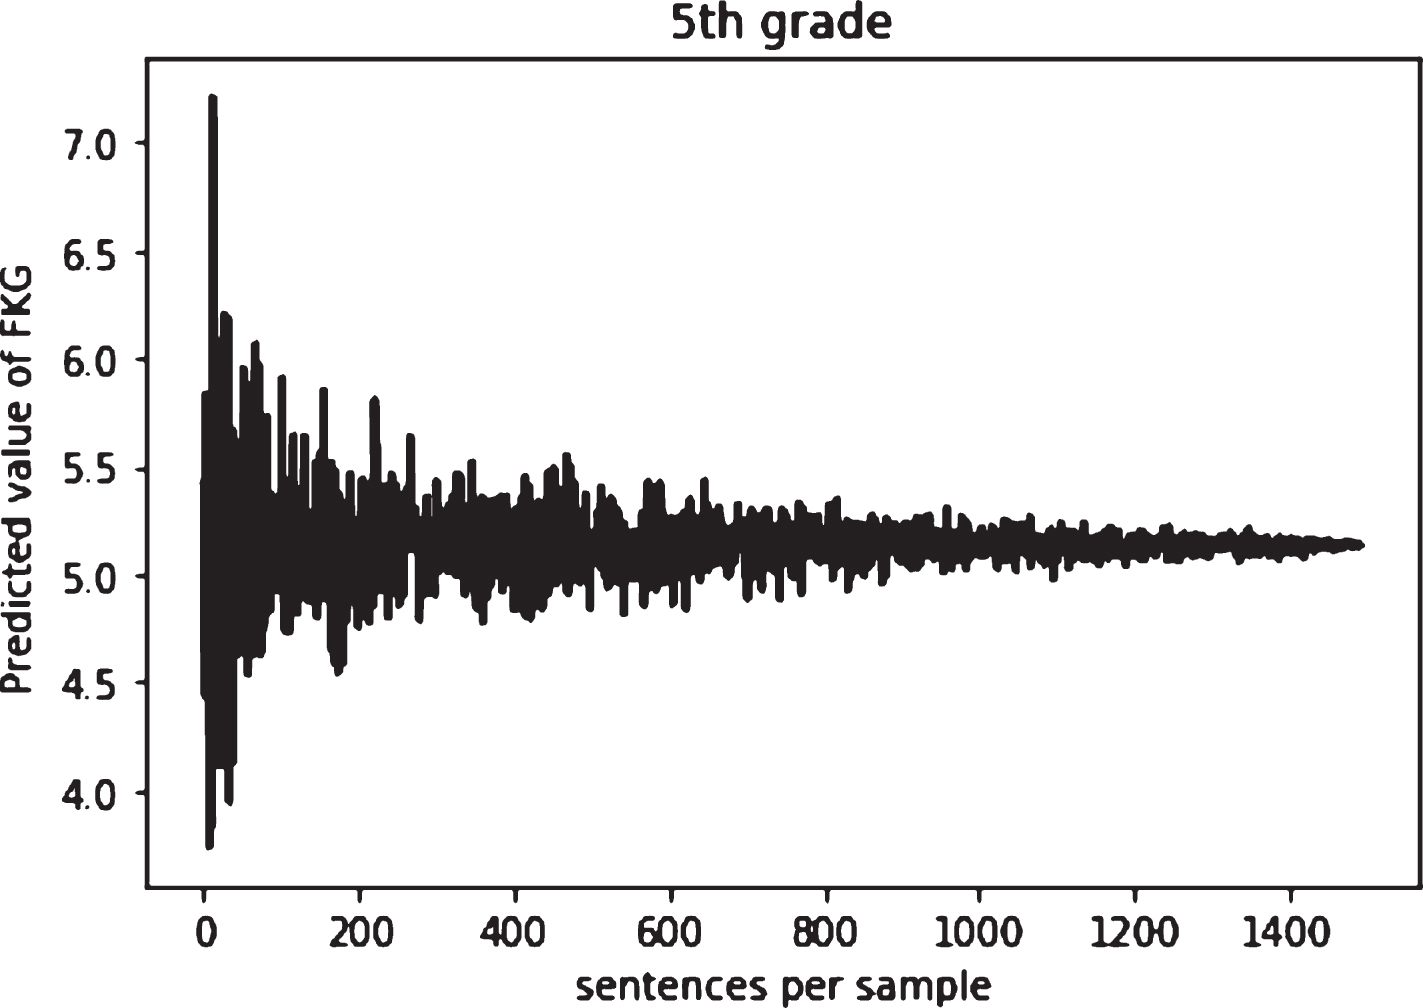
FKG mod values for different number of sentences sampled from a document [4].
Using the sampling technique we can generate more texts from the original corpus. To preserve natural sequence of the sentences we split each textbook into consequent parts. Each part of this type is of a fixed sample size (number of tokens), S = 500, 1000, 2000, or 4000. We use a token, not a sentence, as a unit to measure the size of a sample based on the assumption that the sentence length is different in textbooks designed for different grades. All the samples from a particular document are marked with the same grade level which is used as a label for training. As the last step, we remove outliers from the collection of samples. The samples selected have the number of tokens equal to S±10% 3 . The size of a collection depends on the parameter S (Table 2)). Given ‘S’ as a restriction for the length of each sample, we generate a collection of texts balanced in length.
Number of samples in a collection of size S (number of tokens)
Number of samples in a collection of size S (number of tokens)
We have explored the following sets of features for text complexity prediction: size-based features (Group-1): average number of words per sentence (ASL), average number of syllables per word (ASW), frequency-based features (Group-2): frequency of content words (FREQ), frequency of long words (LONGW), type-token ratio (TTR), features based on POS-tags (Group-3): proportion of nouns (NOUNS), proportion of verbs (VERBS), proportion of adjectives (ADJ), proportion of pronouns (PNOUNS), proportion of words in Nominative case (NOM), proportion of words in Genitive case (GEN).
In order to calculate ‘FREQ’ we first collected a set of content words T. The set of content words T is defined as a subset of all words from a given text (TextWords) that also appear in the Russian frequency dictionary collected by Sharov and Lyashevskaya [26] (FreqDict), but do not appear in the set of stop words (StopWords).
‘LONGW’ is calculated as a proportion of words with four or more syllables. The feature ‘TTR’ is a proportion of the number of types of words (or unique words) to the number of all tokens in a document. All features from Group-3 were calculated as proportions of words belonging to a corresponding Part-of-Speech. Figure 2 shows the distribution of the features across the samples. Figure shows unnormalized, raw values of the features. Before the training step, the dataset was normalized with the help of the Min-Max scaler.
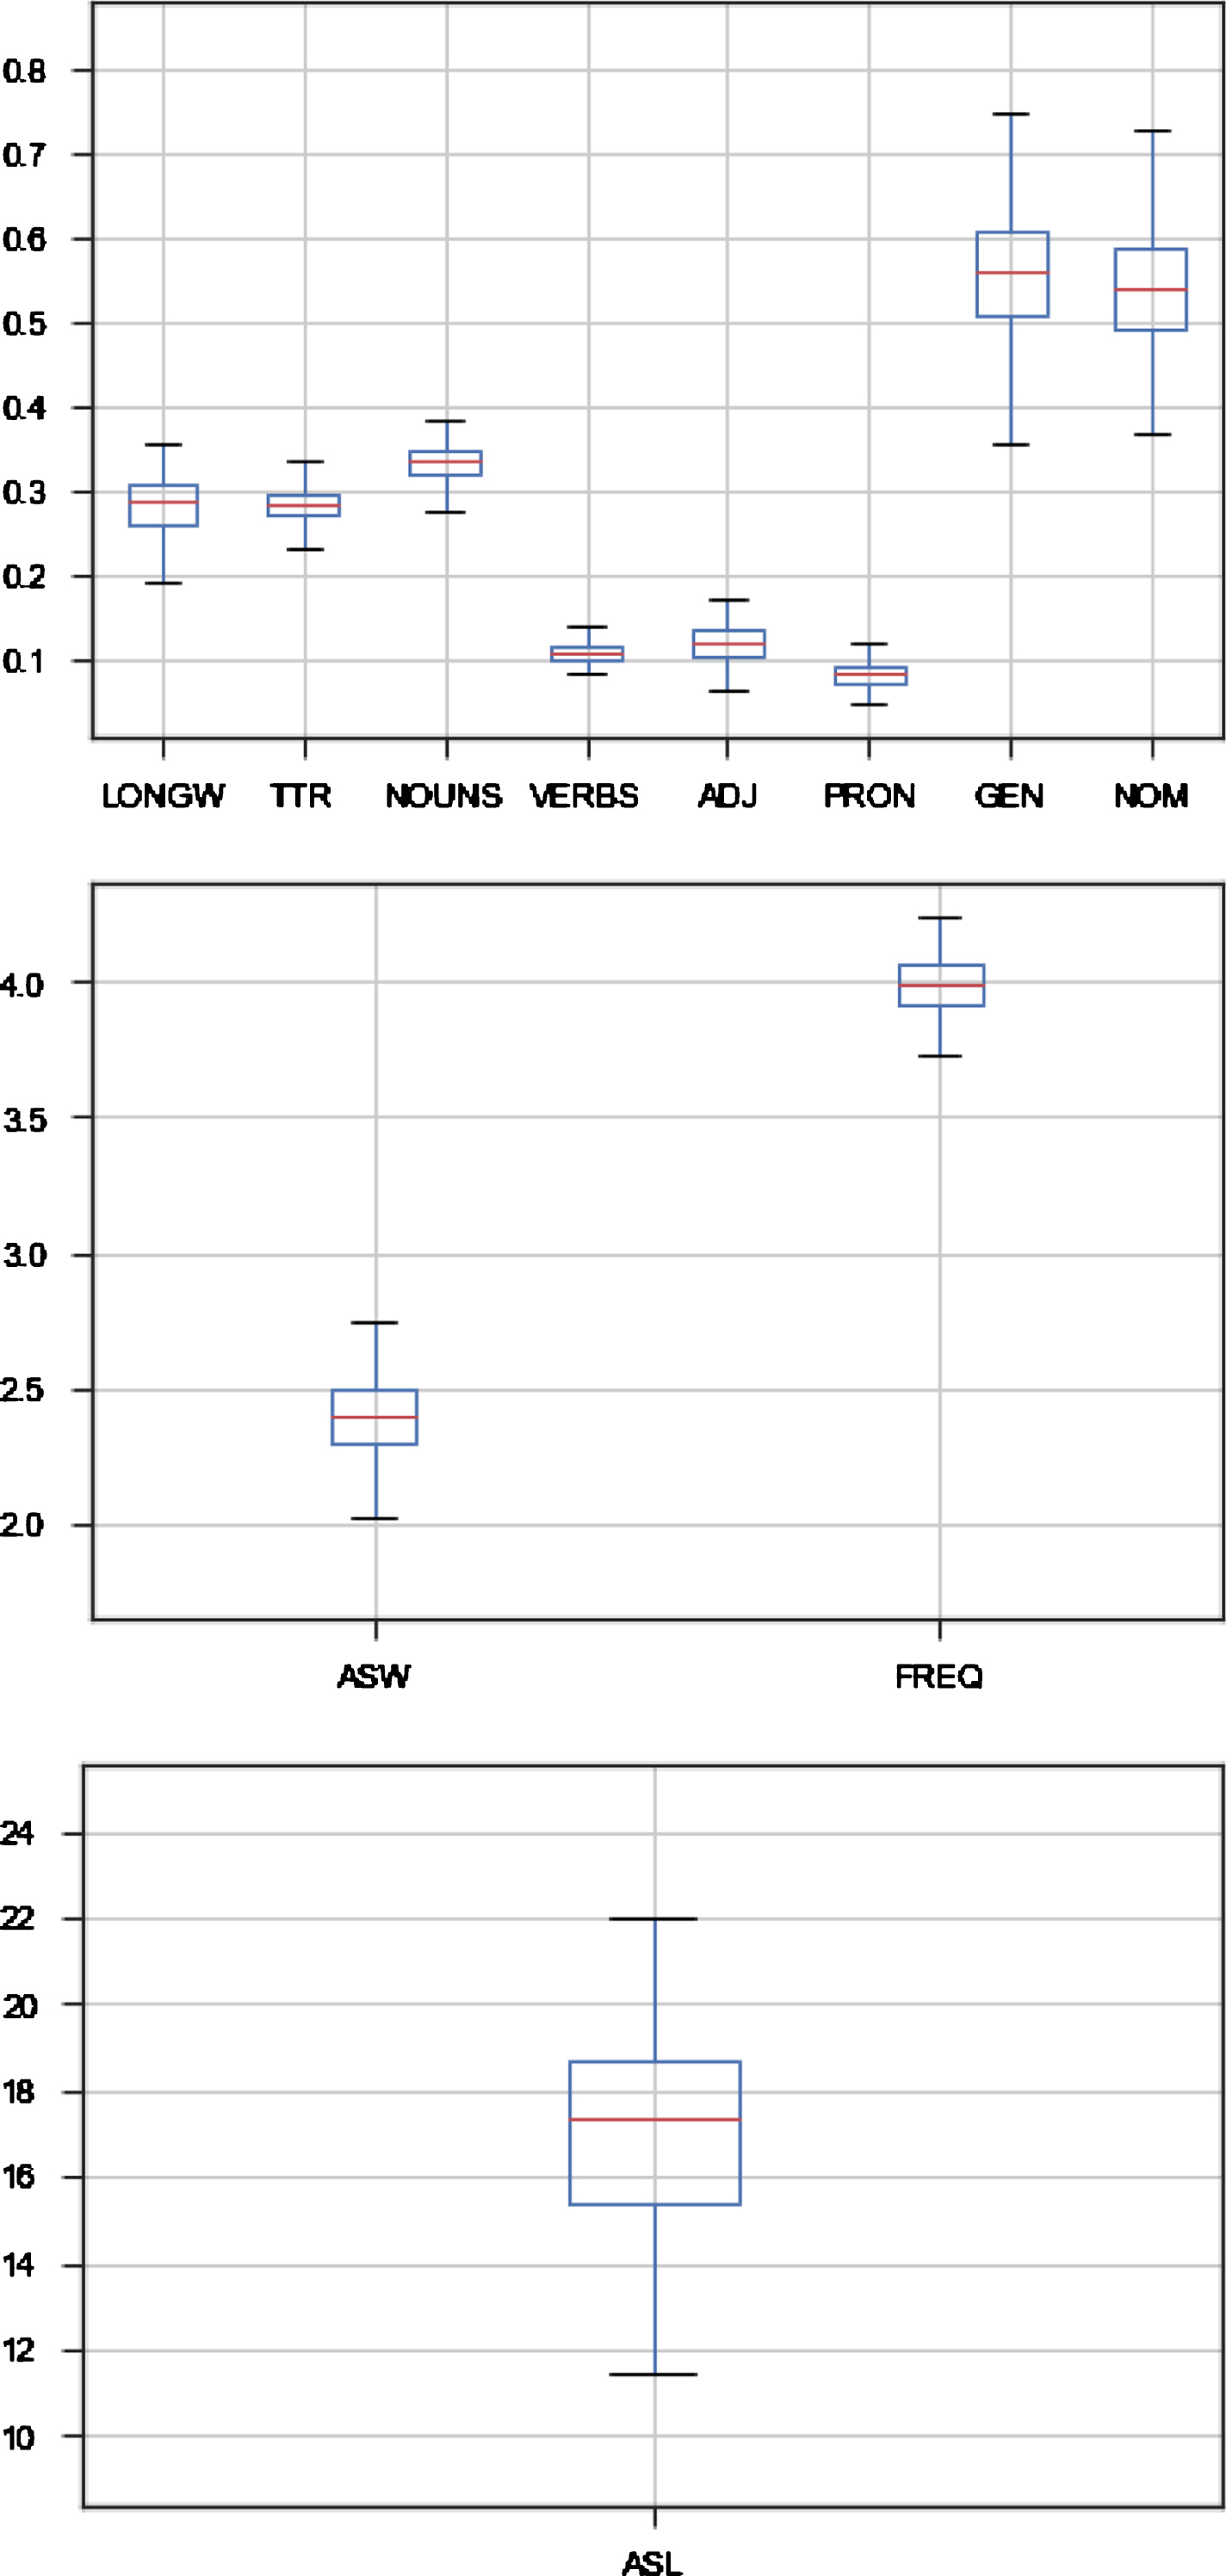
Values of features in the collection of samples generated from the original corpus; S=4000.
The Russian language, unlike English, has a rich morphology, including cases of nouns, adjectives and pronouns. This is due to the use in the study of morphological features of the proportion of words in the Nominative case (NOM), the proportion of words in the Genitive case (GEN). It is expected that with increasing complexity of texts, the proportion of nominal groups in indirect cases (not nominative) will increase, of which the most frequent is the genitive case. The obvious difference from the studies for the English language is the use of various external resources, such as frequency dictionaries.
We can address the problem of text complexity prediction from two points of view depending on how we treat the target variable (the grade level). If the grade level is a real number, then its value can be predicted using a regression model. Otherwise, if one treats the ‘grade level’ as a discrete categorical variable (a variable with values ‘5th grade’, ‘6th grade’, ‘7th grade’, etc.), then we can train a classification model for prediction of the correct class label.
Methodology for evaluation of readability prediction
We run all evaluation using implementation of the machine learning methods from the Scikit-Learn library with default settings. In our experiments we use well-known performance measures: MSE and MAE for regression, and F1-score with macro-averaging for classification performance. In addition, we provide confusion matrices for classification results of the classifiers that perform better than others. During evaluation of performance measures we use 10-fold cross-validation. Finally, we provide learning curves for classifiers to show how the estimator works for different size of training set.
In the experiments with classifiers we use the following models from the Scikit-Learn library with default settings. Decision Tree classifier (DT) Multi-layer Perceptron classifier (MLP) Random Forest classifier (RF) k-Nearest Neighbors classifier (kNN) Support Vector classifier (SVC) SGD classifier (SGD) Gradient Boosting classifier (GBoost)
In experiments with regression we use the following models from the Scikit-Learn library: Linear Regression (LR) Linear Regression with Ridge Regularization (Ridge) Linear Regression with Lasso Regularization (Lasso) Linear Regression with ElasticNet Regularization (ElasticNet)
Results of classification
Results of complexity prediction using the classifiers are presented in Tables 4–6. Additionally, we evaluated performance of binary classification in the experiments with two pairs of classes: (1) ‘5th grade’ versus ‘8th grade’ and (2) ‘9th grade’ versus ‘12th grade’ (Table 3). The learning curve for the Random Forest classifier is presented in Figure 4. The curve represents a typical situation when a classifier has not enough data to perform better. As one can see starting from 400 training instances F1-measure approaches 0.4. At the same time on the test set this classifier performs well. It means that additional (and possible more diverse) portion data would improve the performance.
F1-measure derived using all features; S=4000
F1-measure derived using all features; S=4000
F1-measure derived using all features
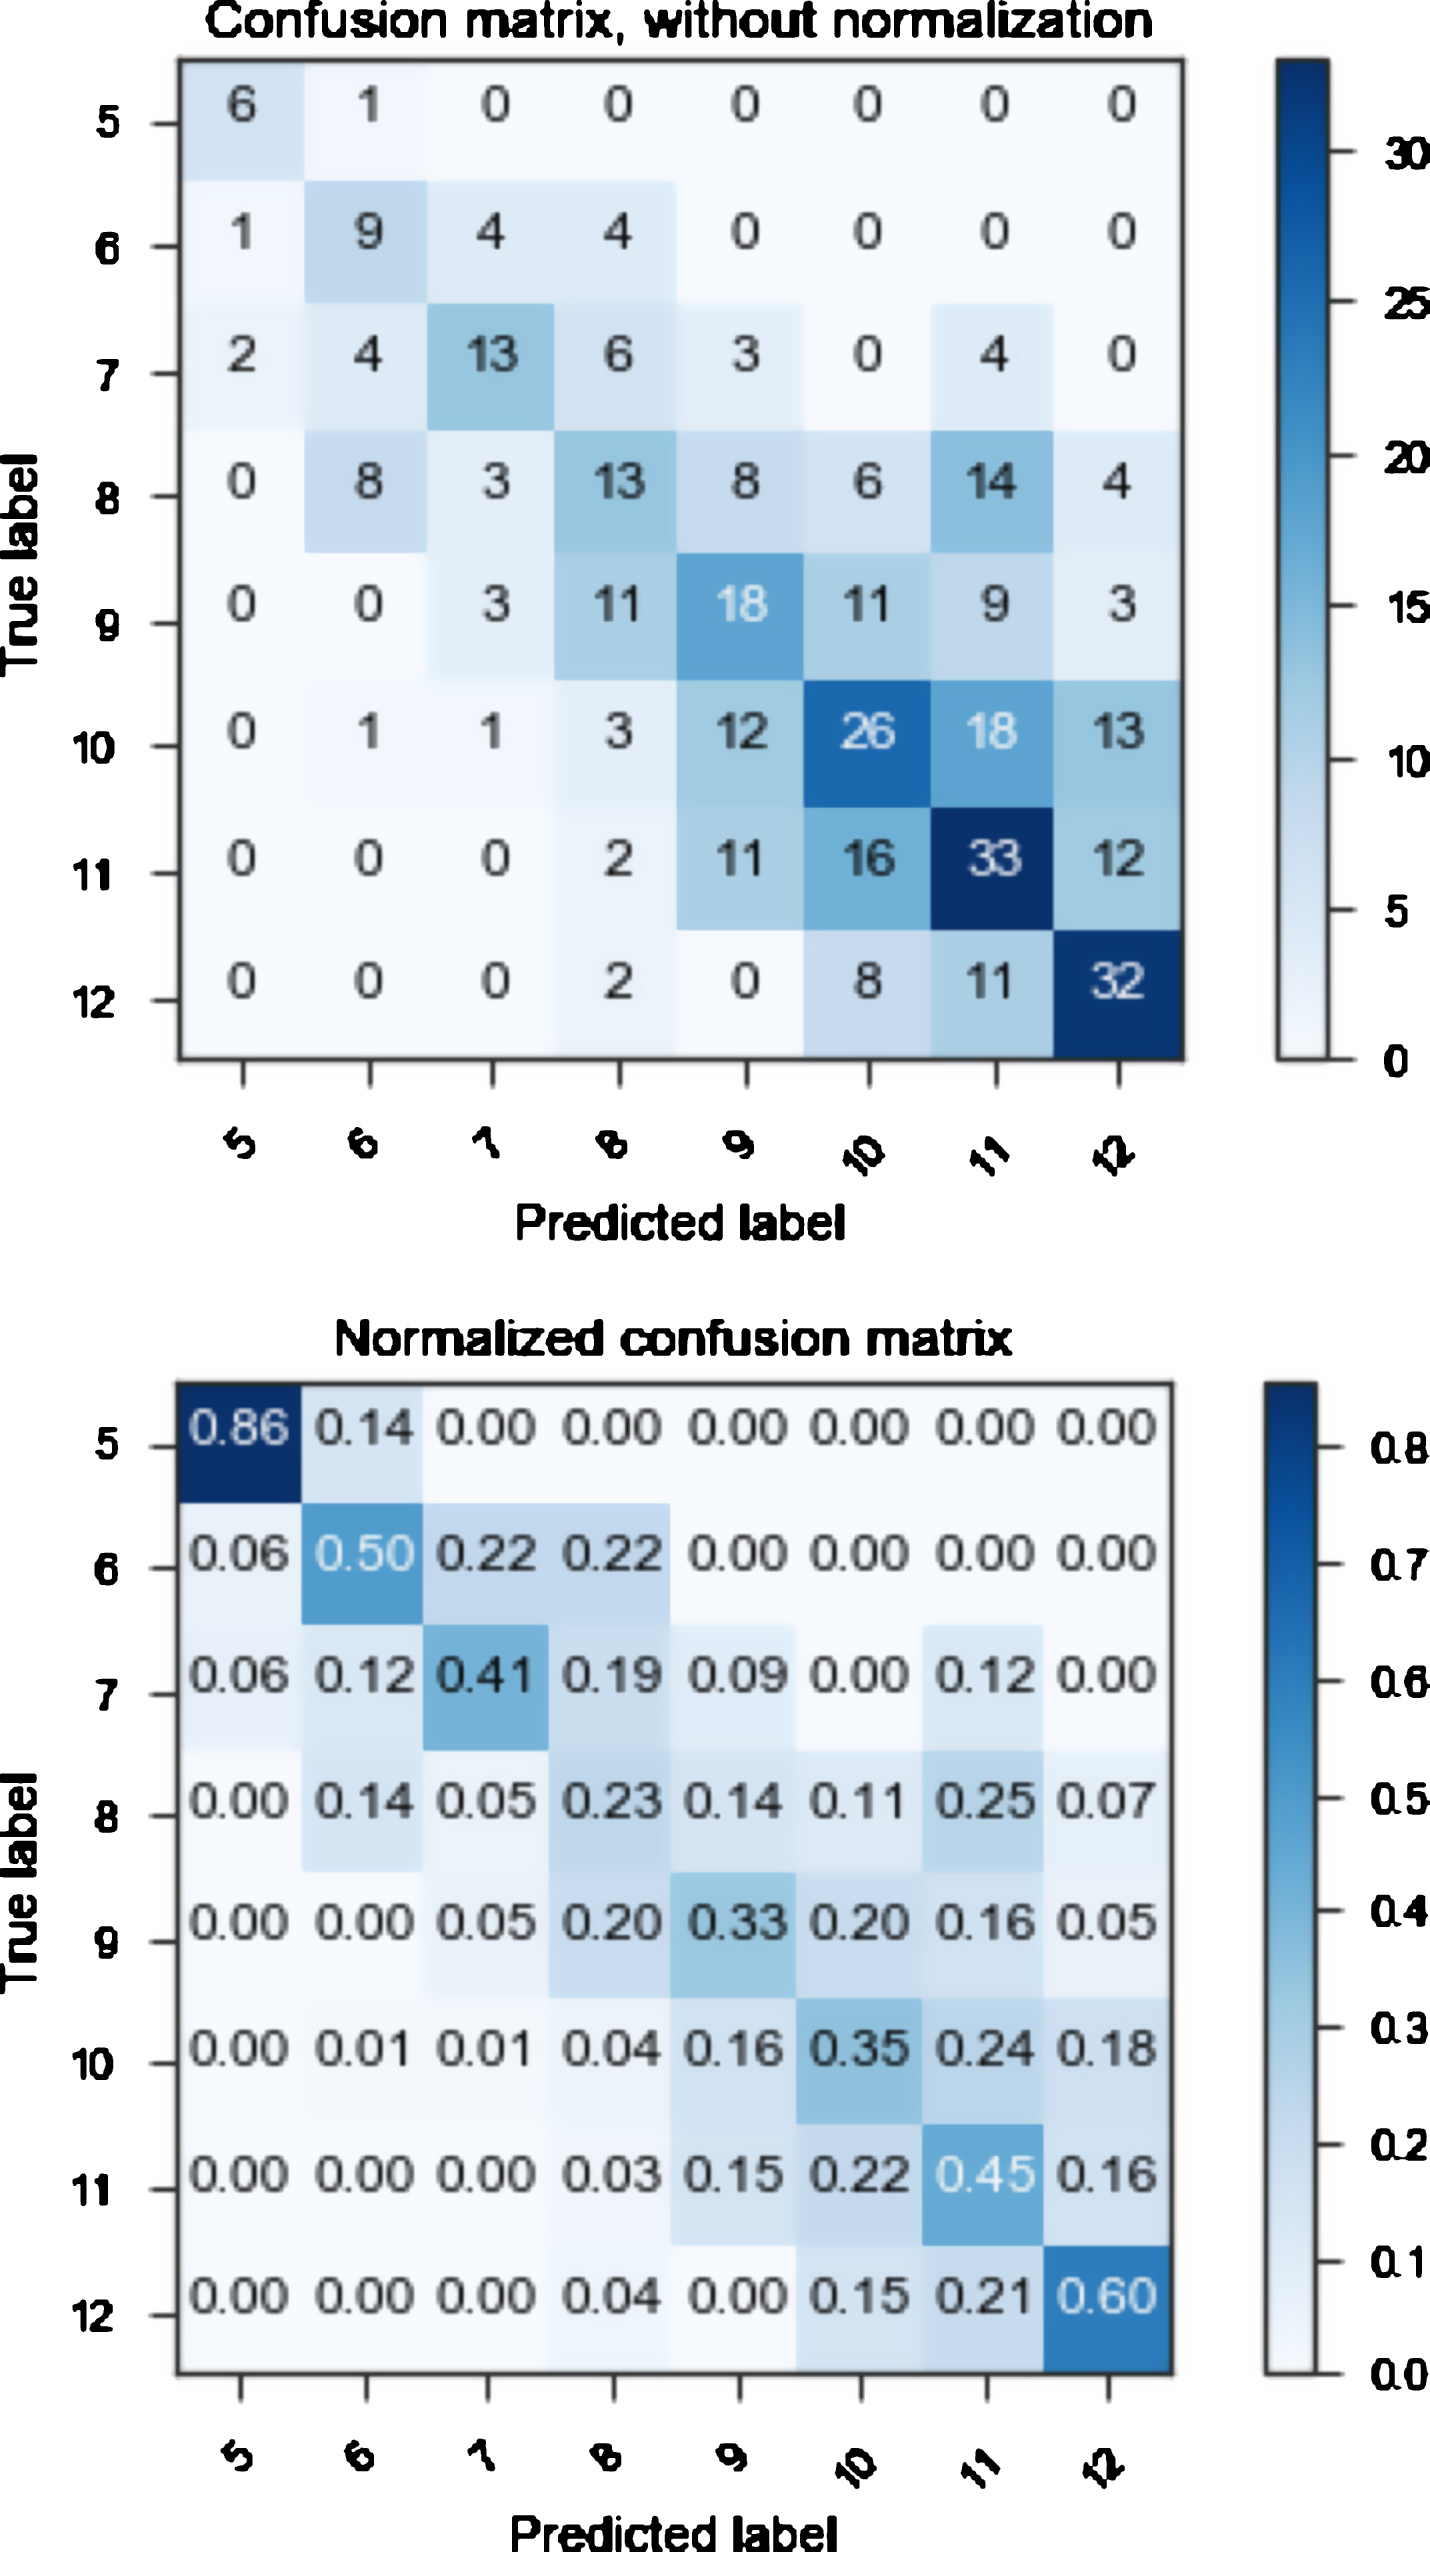
Confusion Matrix of the Random Forest Classifier.
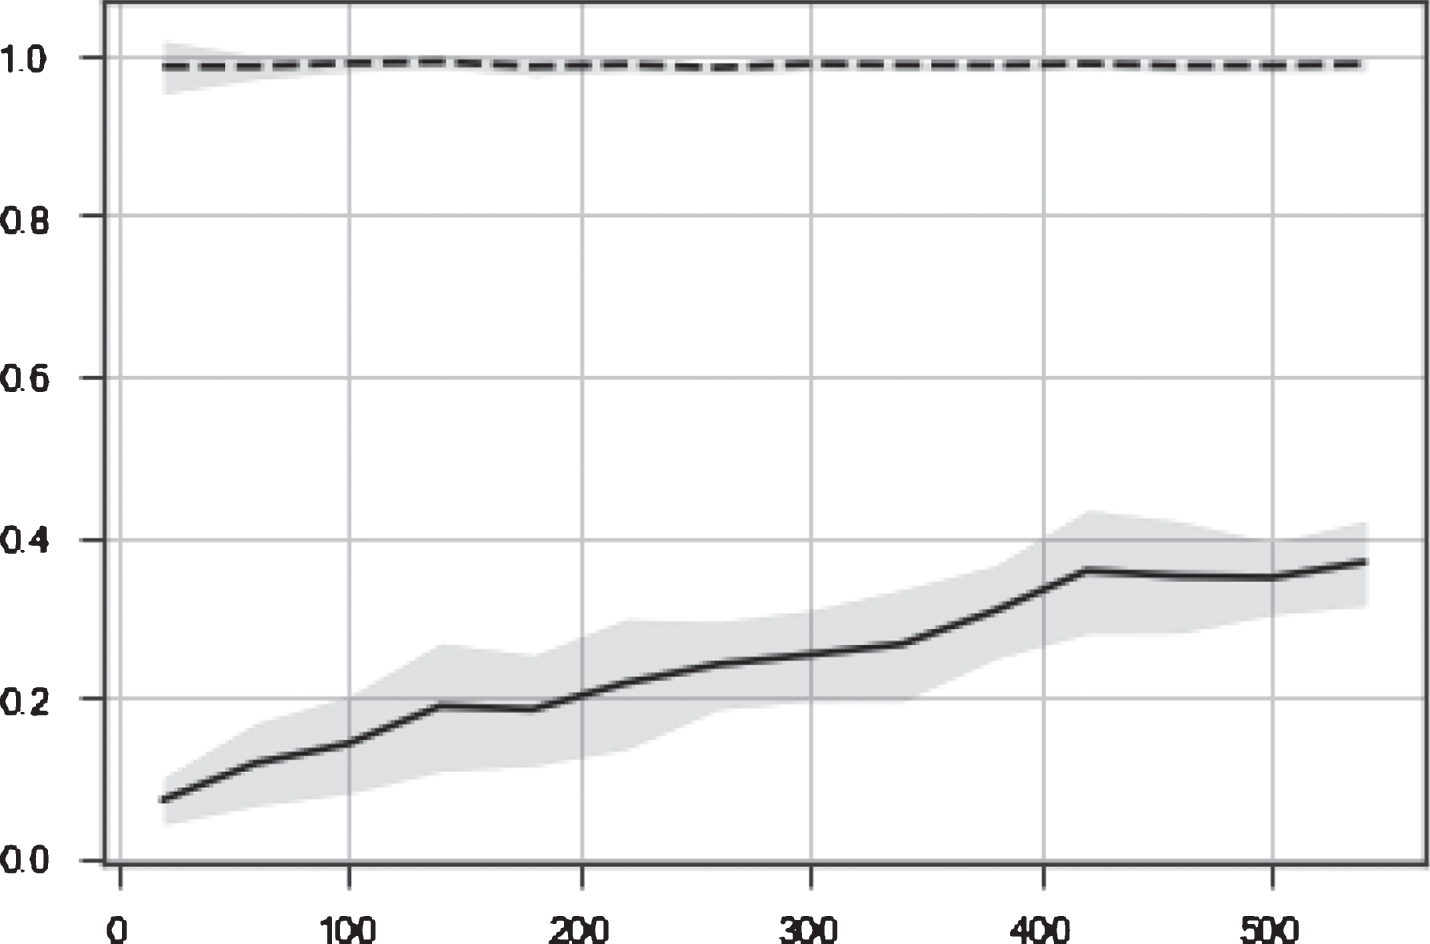
Learning curve depicts how performance of the Random Forest Classifier depends on the size of a train set. Dashed line represents performance on the train set, solid line represents performance on test set.
F1-measure derived using features from Group-1
F1-measure derived using features from Group-2 and Group-3
The results of complexity/readability prediction done with the help of the regression models are presented in Table 7 from the Appendix.
MSE and MAE derived using all features
As we see, although we applied the same research methodologies for academic texts on the one hand and examination texts on the other, our results for school textbooks differ considerably: the best result obtained for F1 on academic texts equals 0.47, while the value for Russian examination texts is 0.67 [18, 21]. The following explanation is viewed by the authors as reasonable: examination texts used in tests of a foreign language is ranked by The Common European Framework of References (CEFR) into 3 main difficulty levels: A, B, C, with A being the easiest and C - close to the proficiency of a native speaker (https://www.examenglish.com/CEFR/cefr.php). Each of the levels is also subdivided into two: A1, A2, B1, B2, C1, C2. Nowadays test developers also make a distinction between the ‘criterion levels’ (e.g. C2) and the ‘plus levels’ (e.g. C2+) thus admitting more subtle divisions of texts complexity. Tests of six CERF levels correspond to significantly different levels of knowledge of the language and, accordingly, vary considerably in complexity.
As for the textbooks under study, they are written for native speakers, who know their native language almost equally, though they go to different grades, from the 5th to the 11th: speech of the 5-graders no longer contains grammatical errors. The main difference in the language proficiency between the 5th and 11th graders is in the sizes of their active and passive lexicons. However, this difference is not considerable. Golovin argues [27], that the average passive vocabulary of a 5-grader is 31 000 words, and that of an 11-grader is 53 000, i.e. only 1.7 times higher.
At the same time, the difference in the size of the vocabulary studied by a speaker of each of the levels described above is much higher: for the English language it is estimated by the British Council 4 , as follows Fig. 5. Thus, a C2 speaker and reader is expected to know 8 times more words than an A1 speaker. Work 5 specifies even higher vocabulary standards for TORFL tests.

Comparison of English and Russian standards for vocabulary size.
According to these data, vocabulary requirements increase 11 times within the span A1 equals C2. Lexical features occupy a significant place among the processed features: e.g. the authors in [21] assessed correlation of lexical features and test complexity levels were calculated and discovered that only 5 features have a Pearson correlation coefficient ≥ 0.7, but four of them are lexical. Moreover, the highest correlation was shown by the lexical minimums coverage [21]. Work [18] convincingly proves that lexical features only ensure the value of F1 equal to 0.639, which is almost the same as for the complete set of features. Thus, we may conclude that the task aimed at in this paper, i.e. automatic ranking of Russian academic texts complexity, is much more complicated than ranking examination texts of Russian as a foreign language. To illustrate this, in Fig. 6 we plot random samples from the corpus (one dot per a 1000-token sample). It is clear that samples from different grade levels plotted close to each other (or “mixed”) if we consider basic features only. The latter implies that textbooks levelling for secondary and high schools require metrics of more specific and elaborated text features. The perspective of the study lies in measuring text cohesion which is a complex metric comprised of lexical and semantic overlaps, argument and stem overlaps, etc.,

A scatter-plot of the collection of samples generated from the original RRC corpus, using size of the sample S=1000 tokens. Different shapes and color represents the label of a text sample. The histograms in main diagonal represent densities of corresponding features.
The article presents the results of applying a wide range of machine learning methods to rank complexity/readability of Russian academic texts. The study was carried out on the corpus of textbooks on Social Studies for grades 5 - 11 compiled by the authors for previous studies. The main goal of the research was to compare and contrast the effectiveness of various algorithms of machine learning, sets of features, sizes of texts on ranking complexity/readability of texts in the tests Russian as a foreign language as well as texts of school textbooks. While the first type of texts, i.e. collections of exam or test texts, are among the most frequently selected corpora in readability studies, the second proved to be beyond the area of interest of researchers. In this study we conducted experiments for 7 classifiers and 4 methods of linear regression on the Corpus of Russian textbooks and diversified a set of linguistic features affecting complexity/readability of the text and the size of the text. The choice of the features was based on the results of the previous studies conducted in Russia and abroad. The results obtained in the current study are estimated by standard methods, i.e. F1 measure for classifiers and MSE for linear regression.
The main contribution of the article, i.e. that ranking readability of educational texts is a much more difficult task than ranking texts of tests, is probably true for all languages. If for some language there is a sufficiently large digital collection of textbooks for different classes and a ranked collection of tests of this language as foreign, then the methods proposed in this work (sampling texts, selecting lengths of texts, machine learning, etc.) can be used for another language as well. The considered set of features can be recommended for languages of inflectional type.
Variants of the linear regression demonstrate very similar results, while the results for the classifiers selected vary considerably and the kNN classifier gives the highest scores for measure F1. The best results are obtained for the complete set of features and the longest of all the analyzed texts. The application of methods of machine learning makes it possible to take into account the number of features simultaneously while in all Russian readability formulas no more than a range of three variables was used to assess text complexity/readability. All this dramatically raises the quality of measuring the complexity of texts. The results obtained by the authors of the article demonstrate that ranking readability of educational texts is a much more difficult task than ranking texts of tests. We consider the latter to be caused by the language proficiency of a reader, i.e. the range and size of the active vocabulary of the target audience: native language proficiency among pupils of the 5th -11th grades is relatively comparable resulting in readability values of academic texts of grades 5 - 11 being very much close or even similar to each other. Complexity/readability of texts in tests of Russian as a foreign language, on the contrary, varies greatly in texts aimed for starters (level A1) and those of the proficiency level (C2).
Unfortunately, the estimates of ranking results in both tasks, i.e. for academic texts (textbooks) and tests (examination texts), are far from being high: 0.47 and 0.67, respectively. Apparently, it proves that the methods of using easily computable morphosyntactic, lexical and frequency metrics have exhausted themselves. Better results can probably be achieved with more complex features, such as referential cohesion and deep cohesion as well as information about individual characteristics of a reader,e.g. his/her age, background information of the world, ‘active’ and ‘passive’ vocabulary, etc. We also plan to use more powerful methods of machine learning - the newly developed methods of deep learning of neural networks in our future studies. We also argue that the suggested methods of text complexity measurement, though not unlimited, still provide a solid foundation for profiling academic texts for both L1 and L2 students which eventually contributes to better educational policies, fairness, reliability and validity of tests. Texts which are correctly selected for the target audience of readers motivate students’ success and are better instruments in classroom management.
Footnotes
Obviously, most of the samples collected do not have the exact number of S tokens. We did not include into the collection of samples too short documents, which appear at the end of each document.
Acknowledgments
This research was financially supported by the Russian Science Foundation, grant # 18-18-00436, the Russian Government Program of Competitive Growth of Kazan Federal University, and the subsidy for the state assignment in the sphere of scientific activity, grant agreement 34.5517.2017/6.7. The Russian Academic Corpus (section 3.1, 3.2 in the paper) was created without support from the Russian Science Foundation.