



Abstract
Traditional information recommendation system using only the user’s score is calculated and recommended, although to a certain extent, can obtain the implied characteristics of users or resources, but the lack of enough semantic interpretation, affecting the effects of recommendation. This article studied and analyzed the recommendation based on attribute coupled matrix decomposition algorithm in the application of Internet of things, on the foundation of the matrix decomposition model successively introduced global offset and time offset, in order to improve the prediction accuracy and the quality is recommended. In this paper, the algorithm is proved by experiment and the prediction accuracy of the algorithm is improved.
Introduction
With the rapid progress of the Internet, the information resources available are also becoming richer. Traditional algorithms cannot provide users with the information they need quickly, and the information is not efficient [1]. The recommendation system is different from the traditional search engine, and its purpose is to filter the information for the user. The most commonly used algorithm of recommendation system is collaborative filtering recommendation, which can filter recommendations [2]. At the moment, research has suggested that amazon’s peer-to-peer web site filtering recommendations make the site’s revenue up nearly 35%. In recent years, the network of socialized attributes has been widely studied and has been continuously promoted and developed [3].
Coupled attribute similarity is composed of internal coupling similarity and external coupling similarity, which can capture the relationship between projects more comprehensively.The internal coupling similarity of attributes only considers the distribution correlation between attribute values under the same attribute, while the coupling similarity of attributes takes into account the correlation between different attributes, and then mining the implicit correlation among them. Therefore, the coupling matrix decomposition can further explore the correlation between attribute values with high accuracy, so this paper applies it to the Internet of Things.
This paper innovatively applies the coupling matrix decomposition model to the Internet of Things, and derives innovative recommendation algorithm. This is an innovation in traditional recommendation algorithm, which promotes the development of recommendation algorithm.On the other hand, this paper extends the coupled matrix decomposition model to some extent, and begins with the trust probability matrix decomposition model, which is of great significance to explore the internal mechanism of the coupled matrix decomposition model.
This paper explores the application of the Internet of Things based on the Matrix Decomposition Recommendation algorithm with attribute coupling. Firstly, this paper analyses the probability matrix decomposition model of trust, and then calculates the tag preference score matrix. Then, the tag preference score matrix is calculated, and the recommendation algorithm is optimized. Then, the proposed algorithm is tested. The validity of the proposed algorithm is verified by experiments, and the prediction accuracy of the algorithm is improved.
State of the art
Although the recommendation system has made great progress in theory and practice, it still faces two important problems: sparse data and cold start-up. Both of these problems arise from the lack of sufficient data to recommend [4]. Therefore, a lot of research will introduce the information in the traditional recommendation system to improve the recommendation quality, such as the information of user community (trust) relationship information [5]. Web2. 0 era makes users have more autonomy, the contents of the user by passive receiver gradually into the creator of the content, such as douban, Facebook and other social tagging system arises at the historic moment, relative to score the implicit characteristic of information, social tag has the explicit semantic, contains more information on the characteristics of the [6]. Traditional method of matrix decomposition using user ratings for resource information or score predicts the relationship between the user information, but the numerical information often lack of the semantic interpretation, make recommendations, so many scholars recommend introducing social label matrixdecomposition algorithm, and has obtained some research results [7].
Methodology
Trust probability matrix decompositionmodel
Recommendation system is an important way to solve the problem of rapid growth of information. It mainly uses information filtering technology to provide users with information that meets their interests and preferences. However, the recommendation accuracy of most recommendation systems is not high at present, mainly due to the cold start and data sparsity problems caused by a large number of non-scored items or the joining of new users. Because new projects usually lack user evaluation, existing recommendation systems need to be evaluated by multiple users in order to recommend them to other users more accurately. Therefore, if the user evaluation of the project is missing or the user evaluation is less, the accuracy of the recommendation system will not be high, which is the cold start problem of the recommendation system. Since new projects are usually resources of interest to users, and their user evaluation is less, this paper will focus on the cold start of projects.Most of the similarity measurement methods used in recommendation systems are mainly based on user’s historical score, but these scores are often scarce and do not incorporate the classification attribute relationship of items.
The most widely used similarity measure method is Pearson correlation coefficient method, which is based on the linear relationship between variables.In fact, the relationship between attributes is not linear, and the coupling similarity measurement method can describe this kind of non-linear relationship relatively accurately.
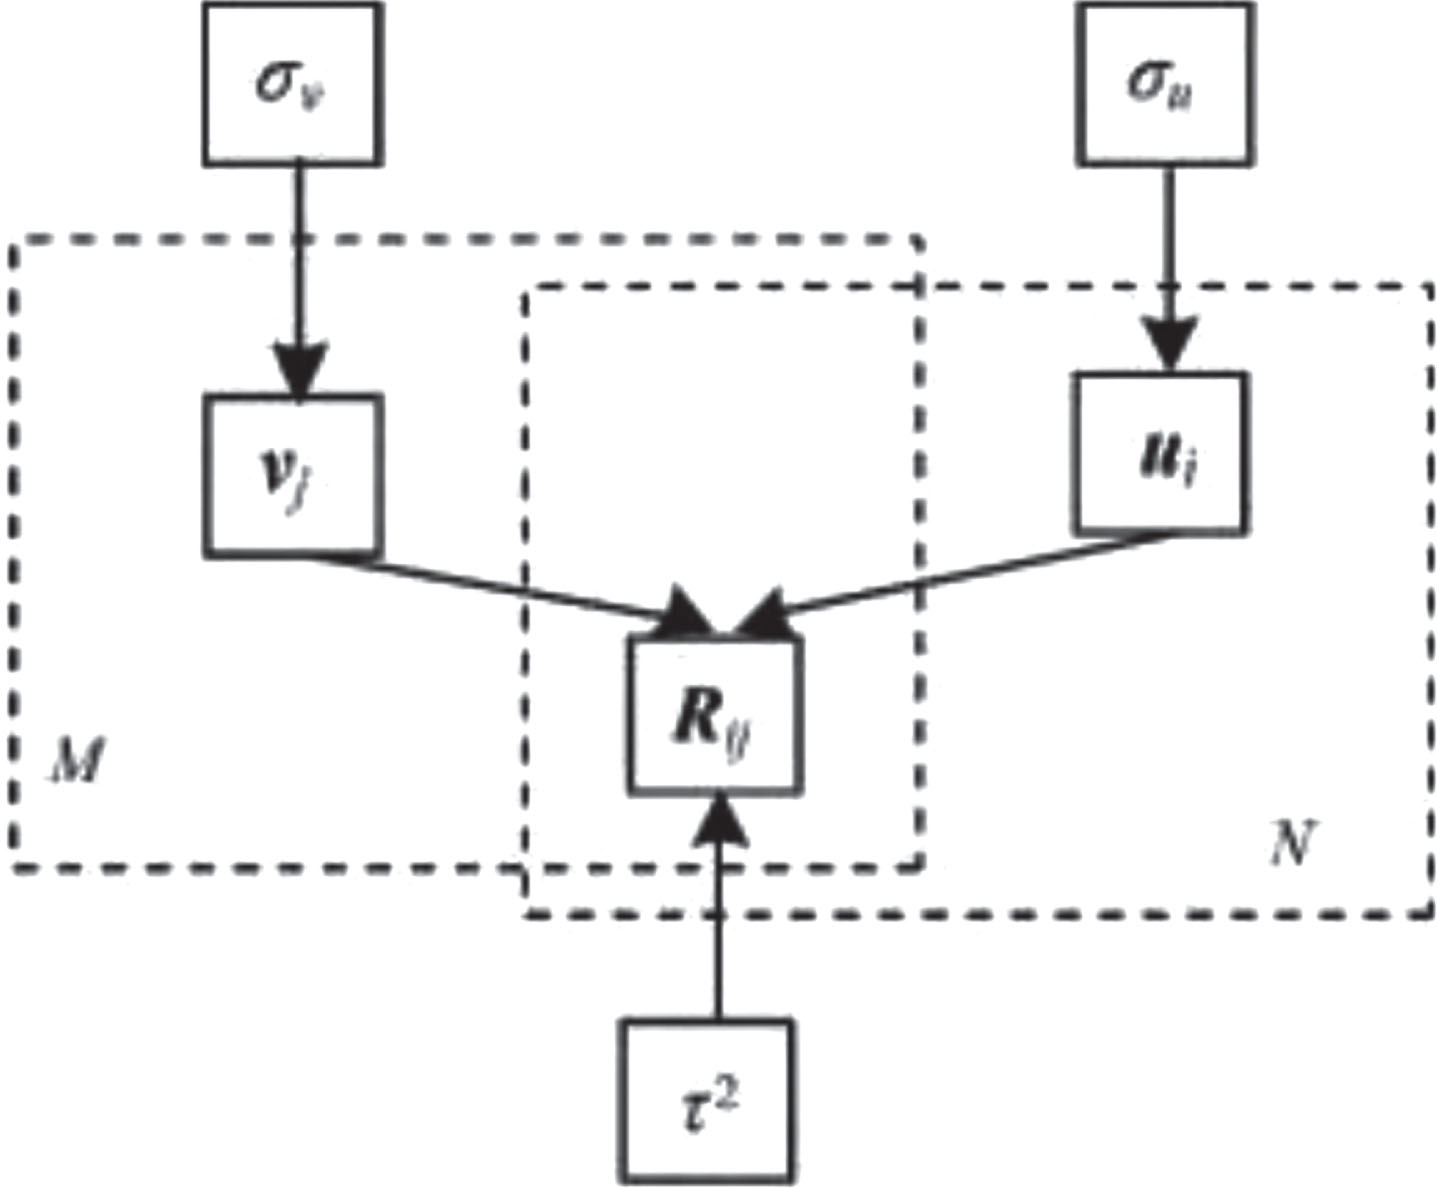
Consider the potential users characteristics and internal relationships between trust, and through the Probability prediction and calculation of the Matrix Decomposition to achieve trust rating Matrix [8–10]. Trust Probability Matrix Decomposition Model mainly derived from the SocialMF and Probability Matrix Decomposition Model aim-listed (Probability Matrix Decomposition Model, PMDM) comprehensive and improvement of the Model [11–13]. Probability matrix decomposition model, as shown in Fig. 1.
Probabilistic matrix decomposition model.
Shown in Fig. 1 as probability matrix decomposition model, this model can be used for linear model probability characteristics of the matrix decomposition, the users of the project evaluation into probability problems. But the problems of the model is the ratings did not consider to participate in the user’s trust level. In fact, different users have different roles and positioning in grading process, too mean score probability forecast, is not conducive to make full use of the focus on the user’s score, to obtain a more reasonable decision results, therefore, to solve the problem, fusion trust models, this paper puts forward the following TPMDM trust evaluation model, as shown in Fig. 2.

TPMDM model diagram.
TPMDM model is a multi-processing of gaussian prior distribution of trust matrix and scoring matrix in the process of decomposition of scoring matrix.In the model shown in Fig. 2, assuming that the scoring matrix is N row M columns, each row I corresponds to the characteristic of the UI, and each column j corresponds to the characteristics of vj, UI and vj characteristics.Form for
Among them, R represents the scoring matrix; T stands for trust matrix; U and V represent the eigenmatrix; g (•) is a regular logical mapping; λ v, lλ u and λ T represent regularization parameters (corresponding items, users and trust respectively), and the potential characteristic logical model can be optimized by gradient descent [17, 18].
Traditional matrix decomposition technology is context-insensitive and relies solely on user rating matrix for fractional prediction. It maps high-dimensional sparse score matrix into low-dimensional user and item matrices in implicit factor space, and then predicts missing scores by applying the inner product of user eigenvectors and item eigenvectors. This method is relatively effective in predicting global information, but it will lead to the loss of local information (strong correlation information between projects in a small range).
In this paper, a method of recommendation is proposed, which combines the similarity of coupling attributes between projects and the traditional matrix decomposition model. It fully exploits the potential relationship between existing data and unknown data.It is worth noting that although there are differences among projects, there must be some common characteristics between each project and its neighbors in some aspects, which indirectly reflects the transmission of project characteristics. The eigenvector of the item and its neighbor eigenvector will be more approximate in the corresponding space.As a result, we use global structure and local information to comprehensively improve the accuracy of the prediction model.
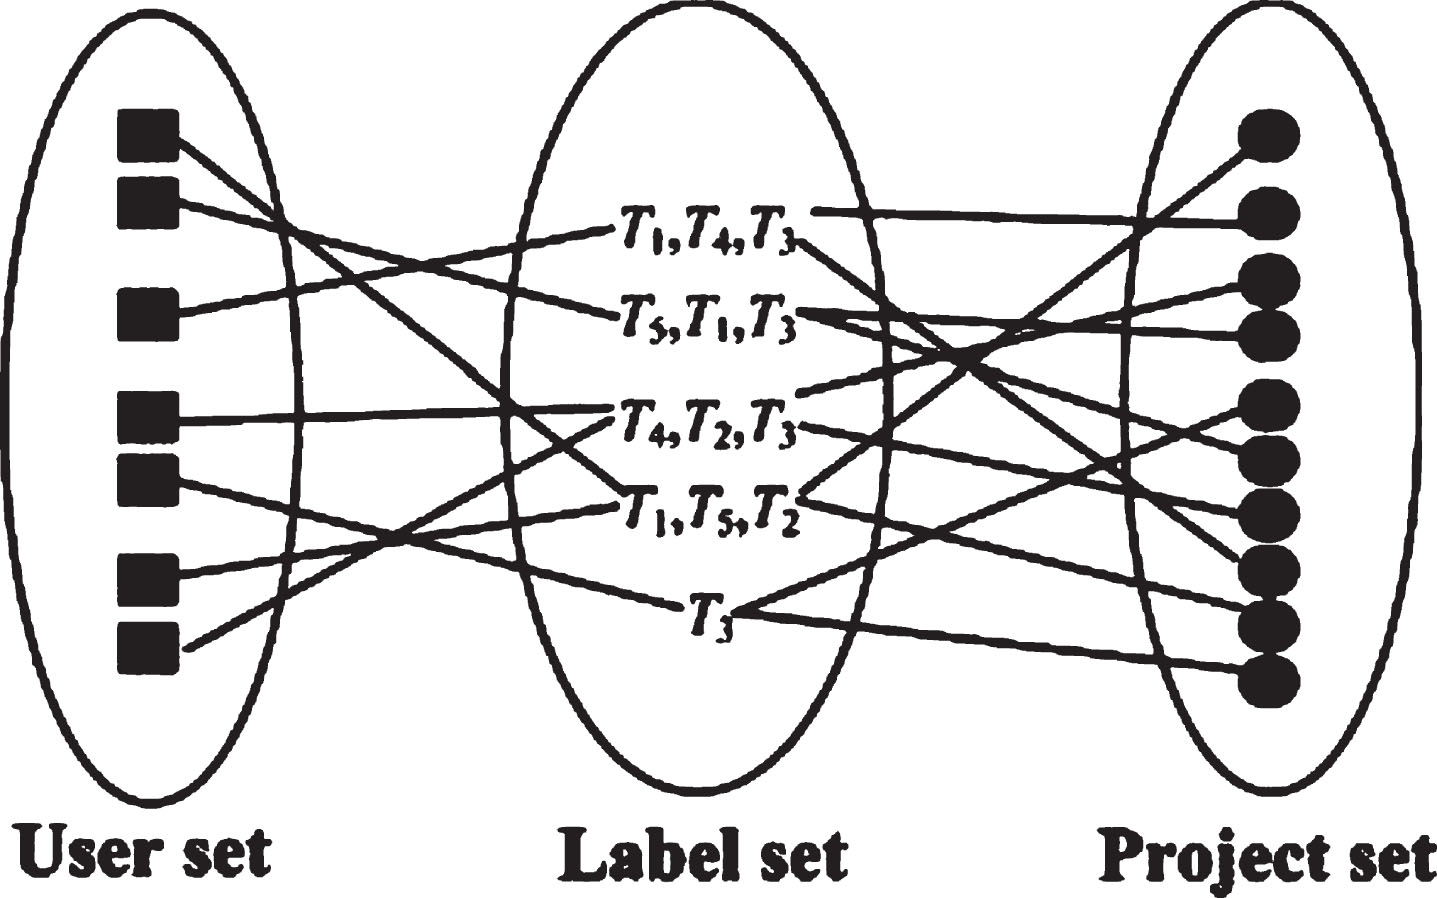
Since the coupling similarity describes the relationship between two objects, the similarity matrix constructed in this paper is symmetrical.Label set mainly by the user to add annotations on the project, with a certain social attributes. For users to browse, organize, and recommended resources, has a certain guidance and help. First, building a general conceptual model, select a triple representation, as shown in Fig. 3. Use labels (tags), user sets (users) and the resources project (items), build labels (Ti), there is the dynamic relationship between users and resources project. The user sets characterization is the user space, it covers all exist in the model users. Tag set representation is space, it covers the model all tags that exist in the individual, each individual label use phrases to say, such as "verygood", or use of words to say, such as ”Star“. The project for the characterization of resources space, it covers all the resources that exist in the model, each resource has a unique serial number [19, 20].
The dynamic relationship of the labeling system.
Tag derivation of user preferences is constructed between user and label project prediction process. In the process of resource access based on users often show 2 types of behavior: 1) on the label, and find new attention. 2) behavior of user interaction resources such as browsing, click browse, and collection of these 2 types. The behavior, can fully reflect the user preference for behavior information, if the relevant features of this kind of behavior as weight prediction algorithm, it can achieve better prediction of user preferences. Calculate the quality Sigmoid function of tag based, and related features of label quality obtained by adopting the weights. Supposing the weights between the project and the corresponding label the value of T form based on ω (I, t), so that the calculation form:
Among them, M is the recommended quality label, and satisfy the relation of m = TF * IDF, TF frequency parameters, refers to the document in the D entry t frequency, IDF inverse frequency parameters of the document, refers to the presence of document frequency and term frequency between the T inverse relationship.
The prediction is can take a variety of ways to label preference for interaction between users of the system, which adopts the scoring method can be better to express the user’s preferences. In this regard, here the use of digital score expression between the user and the project resources preference relation, also called this kind of method for project rating methods (Item-ratings, IR) of the. The method fully considers the effect of relative weight in preference label derivation process, can be obtained:
Among them, Ru, I for user u project on I score values; omega (I, t) is there correlation weight between I and t label project; u network users; Mt is all set. But the label T project, said not considered not. For some website or project evaluation test set in the denominator and numerator, unable to obtain accurate prediction. But if the user for a project of operation shows that the preference, it may be considered that this kind of project is the user preference. At the completion of user preference prediction process, can further adopt implicit label to predict the project resources user score, specific process is as follows: first, the project of I label user preference calculation, so that it can achieve the level of interest; then, the weight of Omega label and corresponding project between (I, t) were calculated. If the user interest rate calculation results label for NTP (U, t), you can have u user preference evaluation project I value:
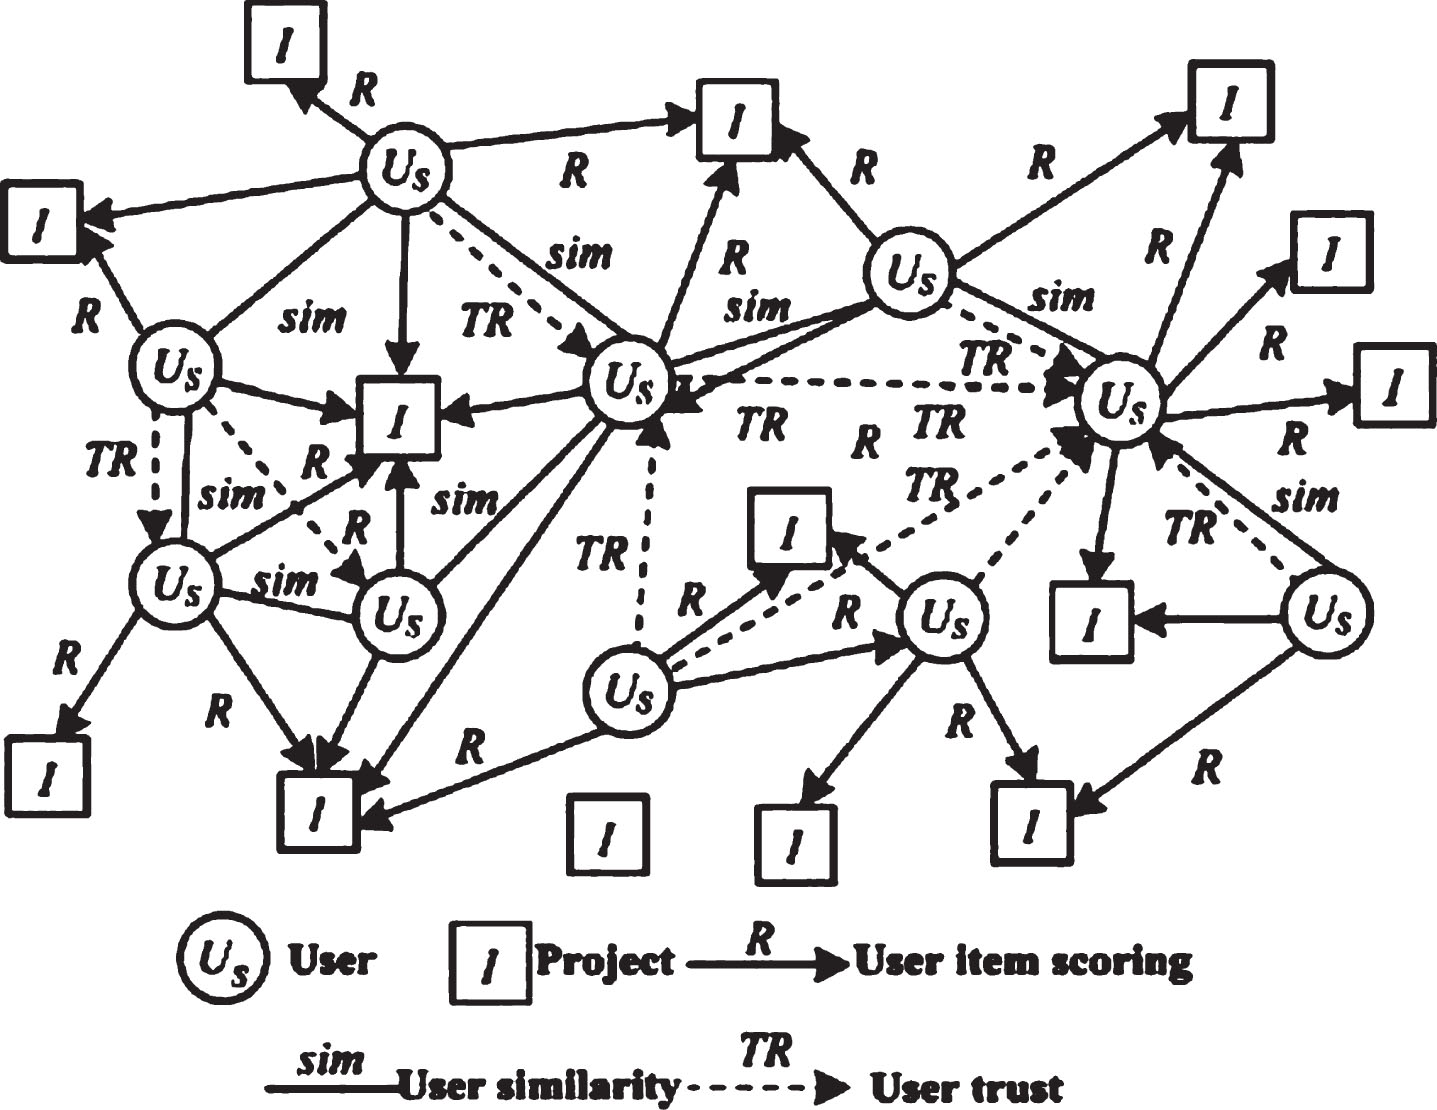
Model and frame. The general idea of collaborative filtering recommendation process is as follows: if a project has similar 2 sets of user ratings, the scores of these 2 groups of users are similar, but in fact, the existence of this relationship has certain limitations. The trust recommendation algorithm of collaborative filtering is designed to establish the trust relationship between users based on similar preference. In view of different sources of trust, it can be divided into 2 forms of implicit trust and direct trust. Among them, collaborative filtering recommendation using direct trust source can make full use of the attributes of the network society, and define user impact based on friend relationship. The trust used here mainly refers to the implicit trust, which can be calculated on the basis of the historical user rating matrix. It is assumed that the more similar the user’s preference is, the higher the trust value is between the users, and vice versa. At the same time, there are many factors affecting the degree of trust. In the process of building the network trust model, we take full advantage of user influence, preference similarity and user professional degree to select and model the influencing factors. The network trust model adopted is shown in Fig. 4.
Network trust model.
Under the social attribute of the network, the relationship between nodes can represent the essential connection of them, and trust relationship is a relationship among nodes, and user preferences can be used to obtain trust information. One of the key factors for the traditional collaborative recommendation process is the user similarity. The user trust value is set up by using the similarity threshold to set the threshold.
As mentioned before, user trust satisfies asymmetric characteristics, which indicates that user trust has the characteristics of transfer and directionality. Based on asymmetric trust information, data sparsity of collaborative filtering process can be alleviated. Therefore, the asymmetric measure of trust can be realized based on the relationship between users, which can be characterized by Jaccard distance.
Based on the set thresholding threshold, the calculation of the user’s score deviation can be realized. The calculation form is as follows:
In this case, if the condition Rui = 0 is satisfied, the Iui = 0 can be obtained, otherwise the Iui = 1 can be obtained. Then the final form of trust value calculation is:
the algorithm steps of the training steps of the trust probability matrix decomposition model: Step 1 generate a random matrix lambda 1I, lambda 2J, and lambda 3S. Step 2 for training data to calculate parameter Λ ={ u1, S1, U2, S2, U3, S3, t2R, t2T }. Step 3 determine the trust matrix T and matrix R score prediction error meets the conditions set E1⩽ epsilon, E2⩽ epsilon, select epsilon = 0.0001 here, and meet t ≥ minstep. Step 4 M-step iterative optimization method to obtain the updated parameter Λ′ = {λ1I, v21i, v22j, λ2J, v22j, λ3s, v23s}. According to the 5 step iterative optimization method to obtain the updated parameter Λ = {u1, ∑1, u2, ∑2, u3, ∑3, τ2R, τ2T}. Step 6 obtains the output scoring matrix R ∧ ij according to the λT1iλ2j.
Experimental design
Experimental data
In this paper, we use the MovieLens20M data set to test the effectiveness of the algorithm. The dataset is a common data set provided by GroupLens by the recommendation system. The data consist of 138493 user tagging information and 20000263 scoring information for 27278 movies. The data set is 465564. The sparse degree of user – resource scoring matrix is:
User – the sparse degree of the label annotation matrix is:
In the experiment, 90%, 80%, 50% and 20% of the total data were extracted as training data, so the comparison algorithm can be compared with the data sparsity. Experimental environment
The experimental hardware is configured as: CPU is XeonE3 and the main frequency is 3. 2GHz, 8GB of memory and CentOS6 operating system. 5. The algorithm code is implemented in python. The evaluation index
This paper USES the mean square root error (RMSE) to evaluate the accuracy of the predicted score, and USES the precis -sion index to compare the accuracy of the four recommendation algorithms. RMSE reflects the deviation of the prediction score and the actual score:
Among them, the prediction score and actual score respectively Ri,j and
In order to facilitate the comparison, this paper compares the algorithm with the following: (1) the TagiCoFi: model using the label similarity calculation of similarity between users, will affect the user’s nearest neighbor into the regularization matrix decomposition process, and thus score to users forecast. (2) the TagRec: model does not consider the influence of neighbor users and resources. Decomposition of rating prediction using joint probability matrix. (3) The NHPMF: model using the label similarity calculation of similarity between users and resources and consider the neighborhood influence of users and resources, but using the user ratings matrix were used to predict the user’s score.
The 4 groups of comparative experiments, first to fourth groups of experimental data were collected 90%, 80%, 50%, 20% as training data, the algorithm proposed in this paper and the model are more than 3 kinds of matrix decomposition algorithms (TagiCoFi, TagRec, NHPMF) are tested and the experimental results of the ratio obtained after. Many experiments, when λ U = λV = λT = 0.001, λY = 0.5, λZ = 0.5, the α = 0.6, β = 0.4, neighbor number is 15, the optimal effect. In Tables 1 and 2 gives 4 kinds of algorithm in the feature dimension is 5 of the value of RMSE and 10. It can be seen that the algorithm when the dimension of l = 5, the training data set is 90%, the algorithm accuracy rate than the other 3 algorithms (TagiCoFi, TagRec, NHPMF) with high accuracy rate 3.8%, 1.9%, when 1.1%. l = 10, the training data set is 90%, the algorithm accuracy rate than the other 3 algorithms (Tag I-CoFi, TagRec, NHPMF) with high accuracy rate 4.7%, 2.2%, 1.2%. 80%, and then compare the training data 50%, 20% sets can be seen, the algorithm model of recommendation accuracy was significantly higher than that of other algorithms the recommendation accuracy.
RMSE comparison among the four algorithms when the dimension l = 5
RMSE comparison among the four algorithms when the dimension l = 5

RMSE comparison among the four algorithms when the dimension l = 10
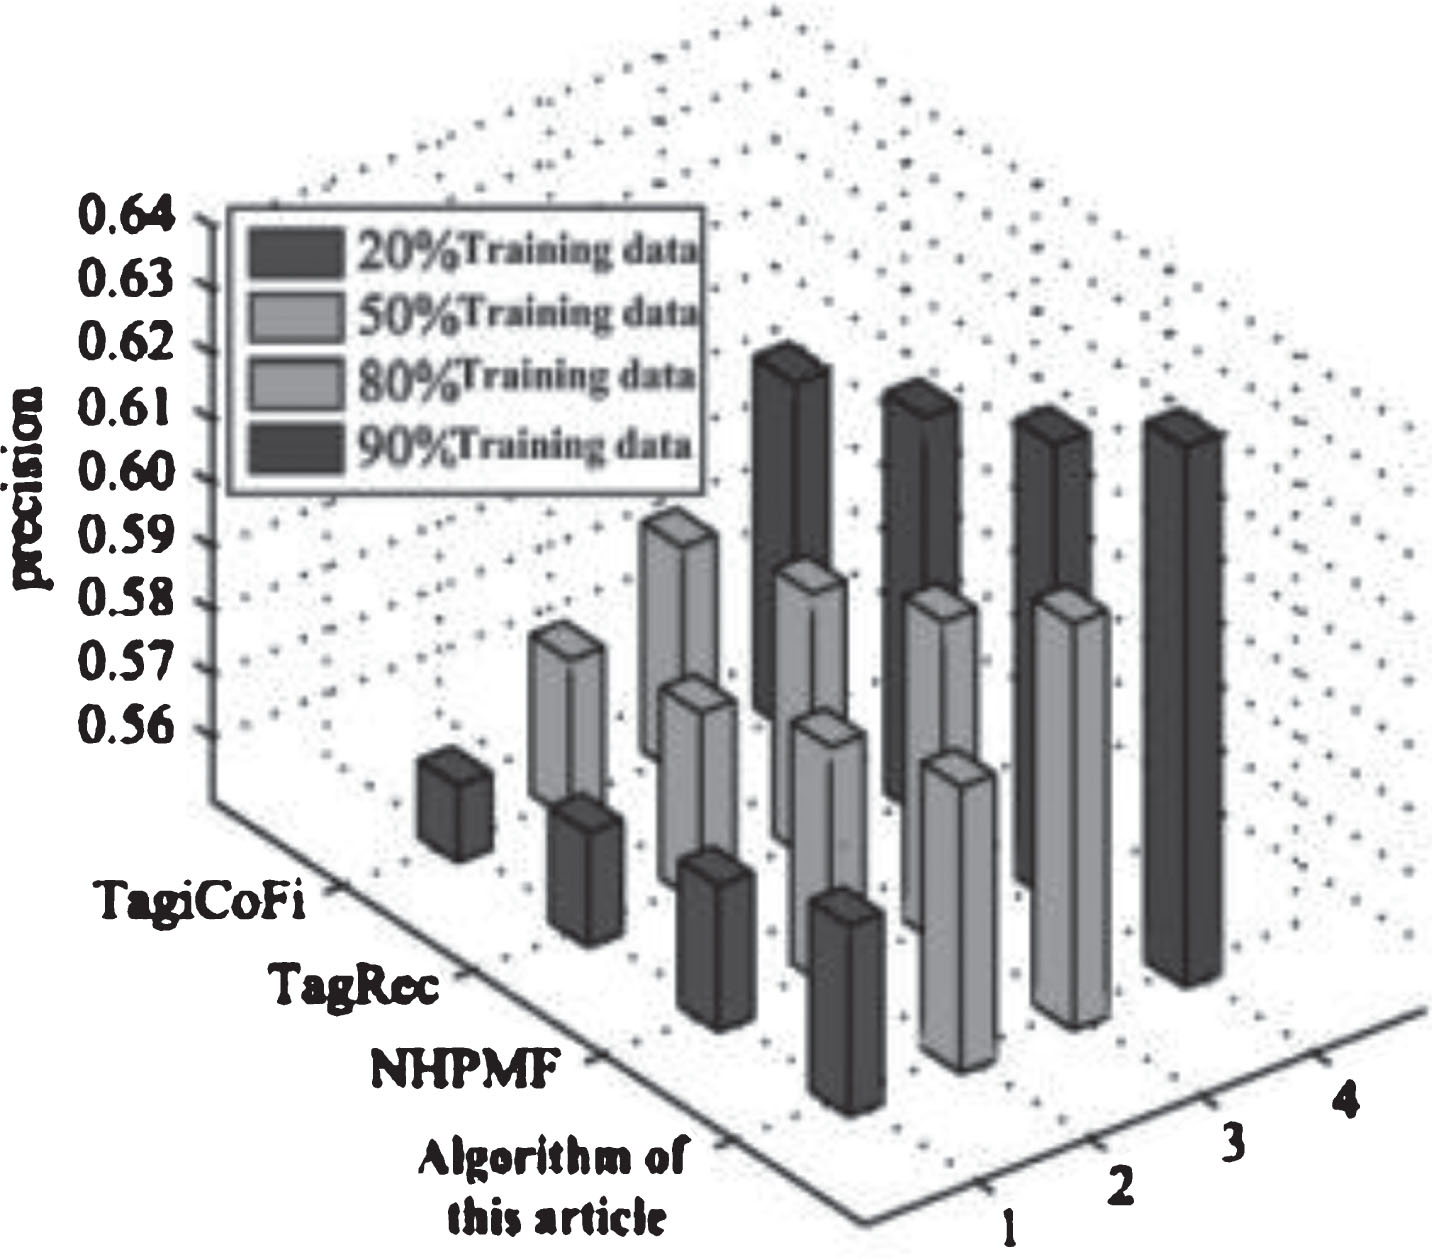
In addition, the accuracy of TagiCoFi, TagRec, recommended by NHPMF, the four algorithms TaSoRec Precision evaluation index for experimental verification, the optimal experimental results given below, namely λU = λV = λT = 0.001, λY = 0.5, α = 0.6, β = 0.4, the neighbor number is 15, the experimental results on MovieLens data sets l = 10. You can see from Fig. 5, consider the TaSoRec algorithm the nearest neighbor and label precision is higher than other algorithms, prove the accuracy of recommendation TaSoRec is the best among the 4 algorithms.
Precision comparison among the four algorithms.
The effect of the algorithm parameters αandβ. α and β were used to control the user resources, influence by its neighbors. Figures 6 and 7 shows the effect of the value of α and β on RMSE. α test, set the initial value of β=0.5, the optimal interval value of the α, and beta test the value of α and beta, until convergence to the best effect. The experimental results show that when α=0.6, β=0.4, recommended best. Visual explanation is a user labeling 60% cases according to their own judgment, 40% case reference annotation information of others. Similarly, a resource in marked label in 40% of the cases will directly be marked according to their attributes, while 60% cases will be marked according to the user has been the label. The parameters of a λY and a λ Z on the algorithm effect in TaSoRec model, the λ Y parameter affects the user label recommendation effect of algorithm parameter matrix, λZ affects resource tag recommendation effect correlation matrix in the algorithm. When λY = 0, λ Z = 0, the model does not consider the user label and the label correlation of resources and resources, using only the user resource rating matrix data are recommended; when λY→ ∞ λZ→ ∞, the model does not consider the scores of resource users, using only the user label matrix and resource label correlation matrix in recommendation; in other cases under this model, combined with the user resource information, user score label information resource, probability matrix of label information on the resources of the three parts are recommended. When setting the lambda U = lambda V = lambda T = 0.001 lambda Z = 0.5, feature dimension were taken 5 and 10 training data Were 90%, 80%, 50%, 20%, Y on the influence parameter recommendation effect 9 as shown in Figs. 8 and 9. Figure 8 and RMSE index of l = 5 and l = 10 respectively when the effect of the curve. From Figs. 8 and 9 it can be seen that the error was less than recommended l = 10 error l = 5. After repeated experiments, when l< = 10 dimension is a more accurate recommendation, but when l > 10, because of large dimensions, recommended low efficiency, affect the recommendation accuracy; l = 10 is the best recommended dimensions. Figures 8 and 9 show when the value of Y from 0 began to increase, the RMSE value decreased gradually, when reached a certain threshold, the value of RMSE began to increase, when the user resources label, will improve the efficiency of the system’s recommendation, but when it reaches a certain threshold, excessive use the label, but will affect the accuracy of the recommendation.
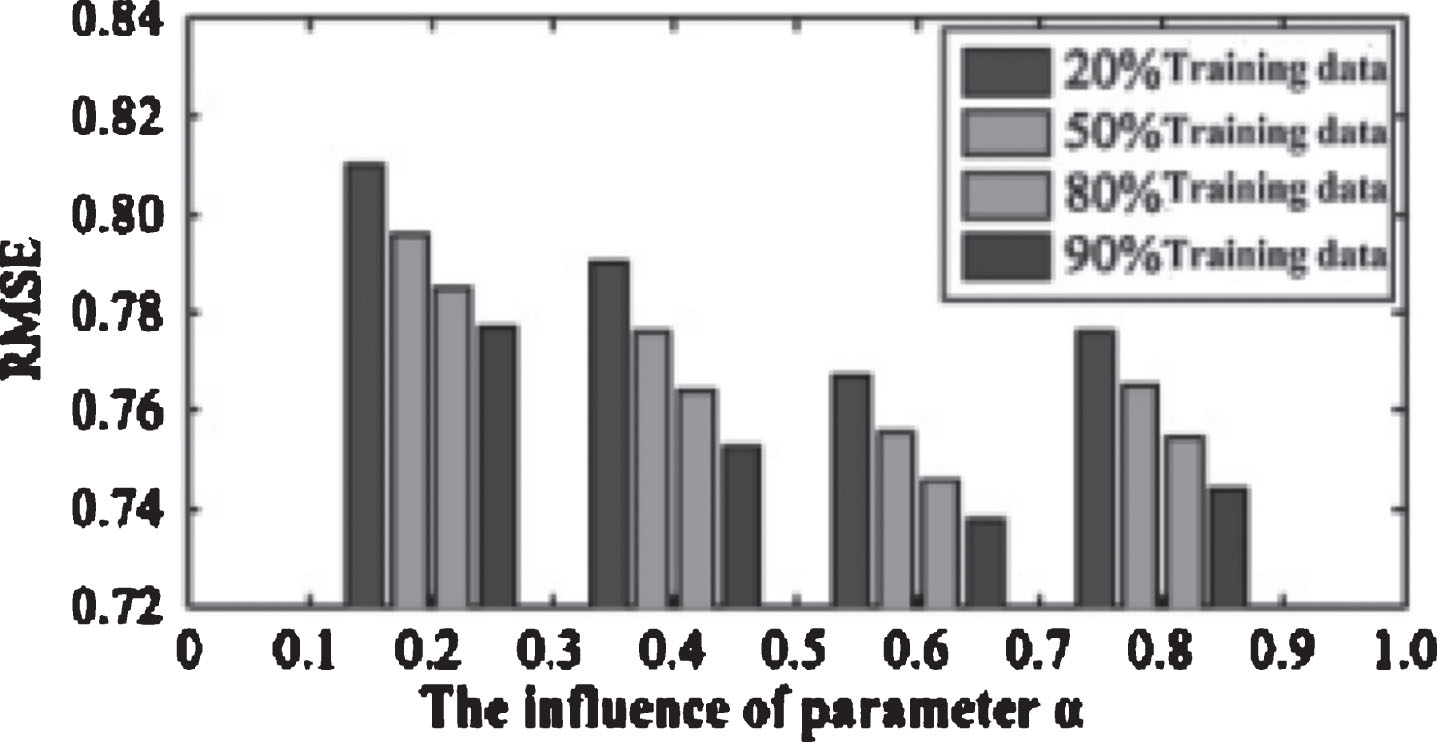
Impact of the parameter α.
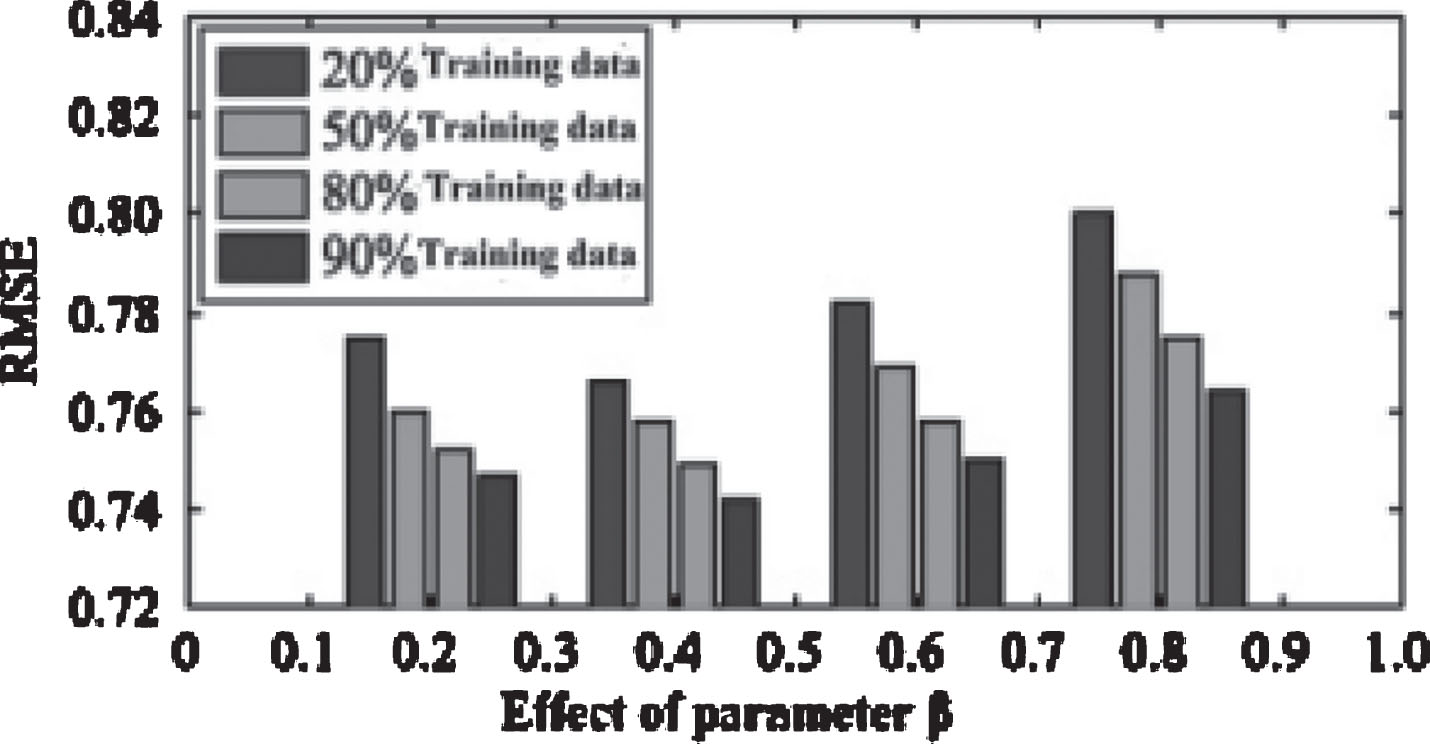
Impact of the parameter β.
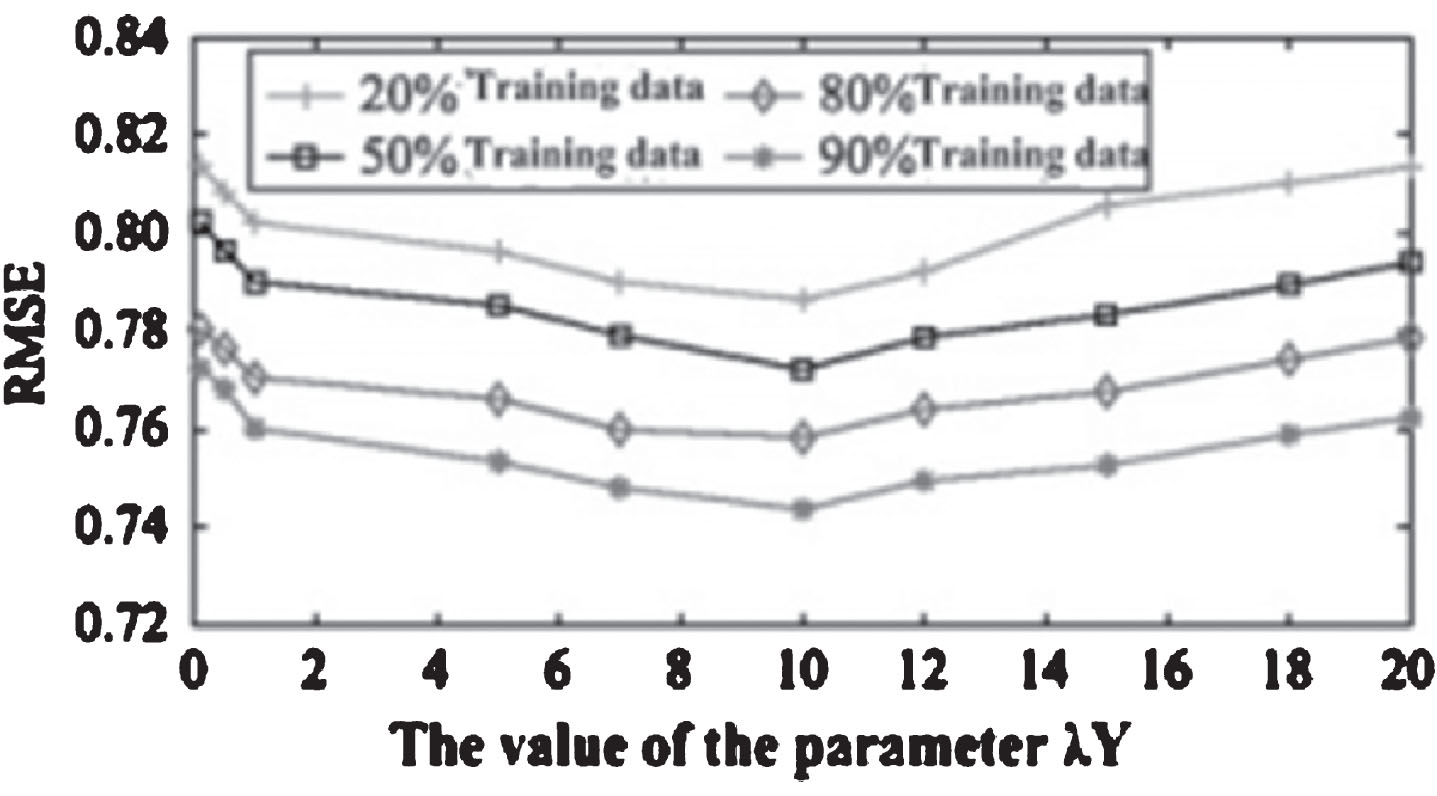
Impact of the parameter λ Y when l = 5 m.
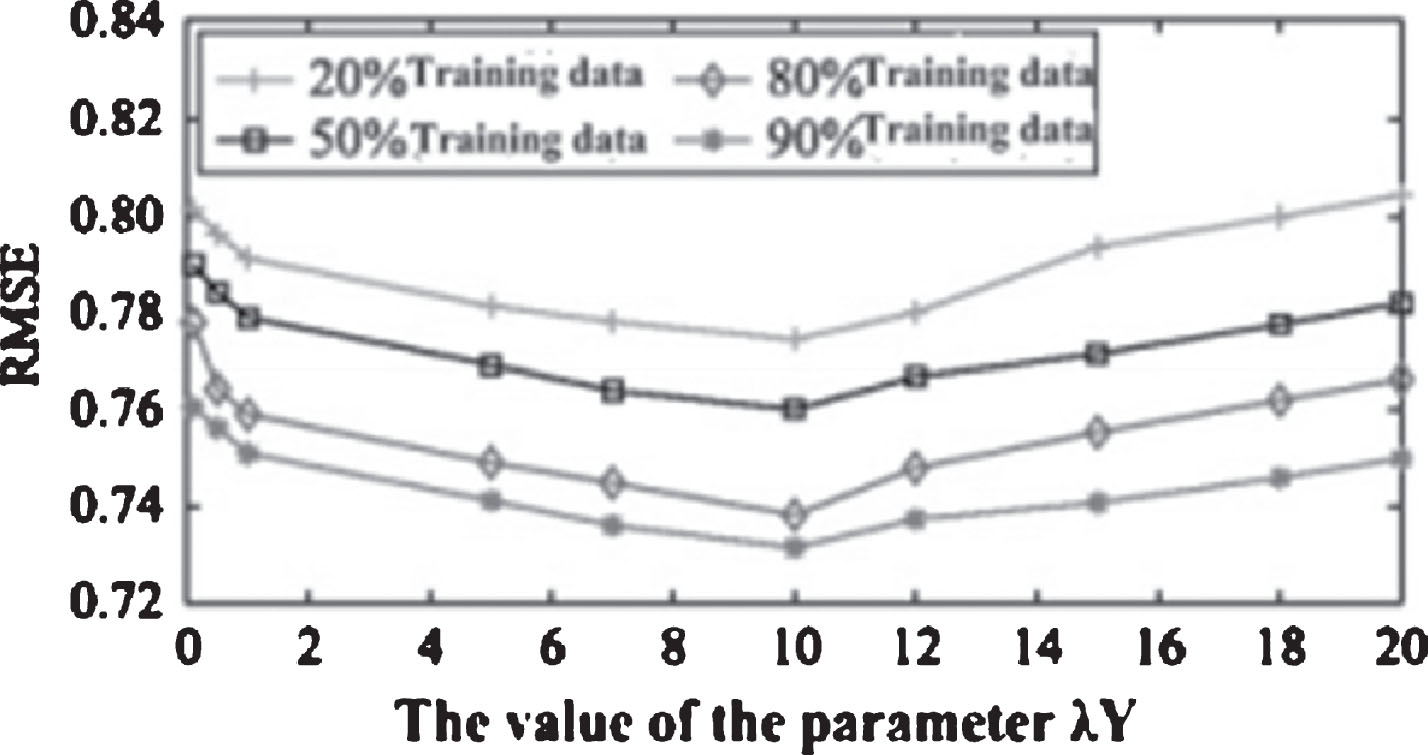
Impact of the parameter λ Y when l = 10.
Assume that λU = λV = λT = 0.001, λY = 0.5, feature dimension were taken 5 and 10, when the training data were 90%, 80%, 50%, 20%, λ Z on the influence parameter recommendation effect 11 as shown in Fig. 10 and figure RMSE index curve parameter. Influence of λ Z value on the algorithm in Figs. 10 and 11 l = 5 and l = 10 respectively. After repeated experiments of l = 10 at the best dimension, recommended minimum error. Figures 10 and 11 shows the recommended error decreases with the increase of lambda λ Z, when reached a certain threshold, the recommended error started to increase, when the resources are labeling, resource – label the matrix into the recommended model, will improve the accuracy of the recommendation; but when resources are over the label, it will reduce the recommendation accuracy.
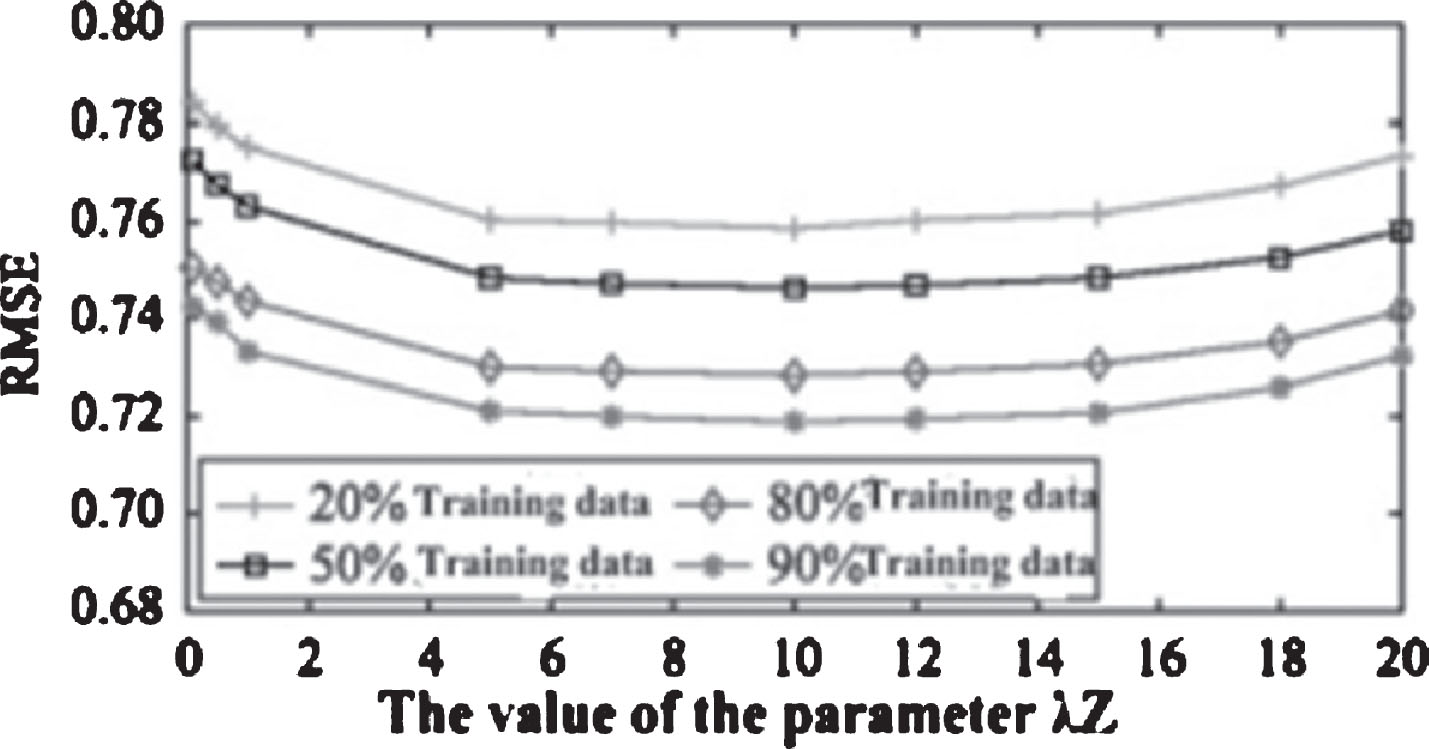
Impact of the parameter λ Z when l = 5.
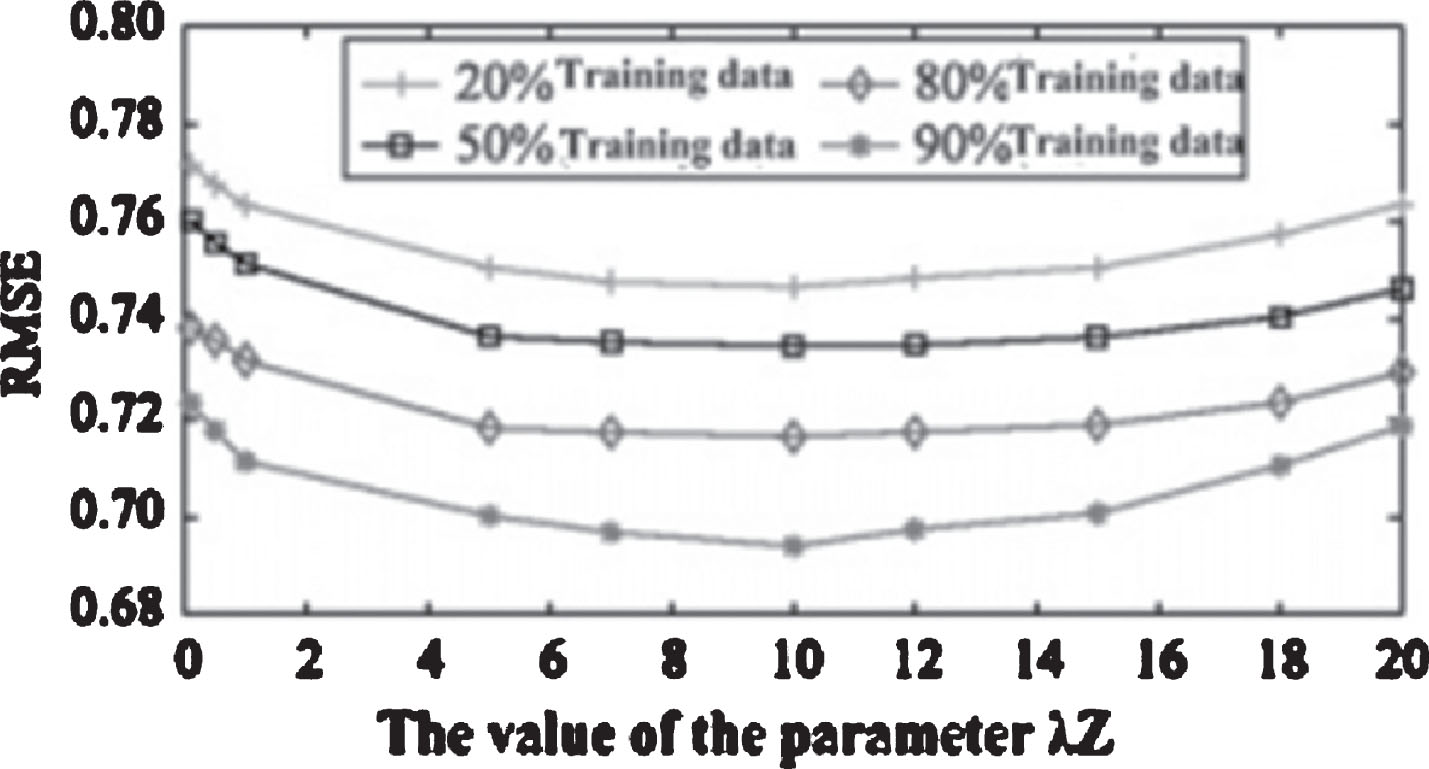
Impact of the parameter λ Z when l = 10.
In a large number of personalized recommendation systems, various algorithms emerge in endlessly. The matrix decomposition algorithm has better scalability and higher accuracy. Based on the matrix decomposition based model based on attribute by coupling, respectively introducing global bias and time offset is improved on the basis of the model, and put forward the joint probability matrix of a fusion of social label neighbor aware decomposition recommendation algorithm, implicit feature vector and using joint probability moment calculation matrix array decomposition method, based on optimization the training model parameters, recommended for users. Through the experiment, it is proved that the proposed algorithm has a certain degree of improvement in the prediction accuracy, and provides a new tool for solving such problems.
Footnotes
Acknowledgments
Aid program for Science and Technology Innovative Research Team in Higher Educational Institutions of Hunan Province.