
Abstract
In order to better solve the problem of gas outburst prediction, based on the in-depth study of ant colony algorithm, the ant colony clustering algorithm is improved, and the population classification and ant sensory perception characteristics are applied to make the ant colony the most likely to find. The optimal solution effectively avoids the possibility of local optimization, improves the global optimization performance and convergence speed of the algorithm, and reduces the influence of human subjective factors. Based on the prominent basic speech and actual working conditions, the paper selects five indexes of gas velocity, initial gas velocity, gas content, gas pressure and coal firmness coefficient as clustering attributes, and uses ant colony clustering algorithm to judge outstanding the state of occurrence. The paper uses MATLAB programming language to write a coal and gas outburst prediction program based on improved ant colony clustering algorithm, and predicts a coal mine. The final result is the same as the actual observation.
Introduction
Coal and gas accidents are a special gas emission that occurs during underground mining and is an extremely complex geological dynamic phenomenon. It is a phenomenon in which gas and coal are poured from coal seams and rock formations into the mining work space in a short period of time. This phenomenon often produces sound and powerful destructive effects, which may cause fire and roof accidents, damage mine equipment, destroy the ventilation system, and seriously cause the wind flow to reverse, so that production cannot continue; the gas is filled with roadways, causing roadways. The staff inside suffocates, and may also cause fire or gas explosion accidents; coal and rock ejected from coal and rock layers can reach more than 10,000 tons, causing workers and equipment to be buried, causing casualties and property losses, so coal and Gas outburst is one of the most serious mine disasters.
Due to the complexity of the mechanism of coal and gas outburst, there is still no unified theoretical system. However, China’s coal geological and coal mine safety researchers have not given up research. In recent years, due to the continuous development of science and technology and the deepening of research, On the basis of a lot of new understanding, and constantly improve the outstanding mechanism [1].
In order to further improve the accuracy of coal and gas outburst prediction, an ant colony clustering algorithm is proposed to predict coal and gas outburst in coal seam face. The ant colony algorithm is a newly proposed bionic optimization algorithm with unique advantages in solving optimization problems [12–15]. Although there are not many researches on ant colony clustering algorithms, some existing researches show that ant colony clustering algorithms can solve some complex clustering problems that are difficult to solve by traditional algorithms [2]. The paper uses the improved ant colony clustering algorithm to judge the state of outstanding occurrence, which proves the feasibility of this method. Providing a basis for developing a reasonable plan for coal and gas outburst prediction can reduce unnecessary anti-burst work, save manpower and financial resources in coal and gas outburst prediction, and improve production efficiency [3]. As shown in Fig. 1.
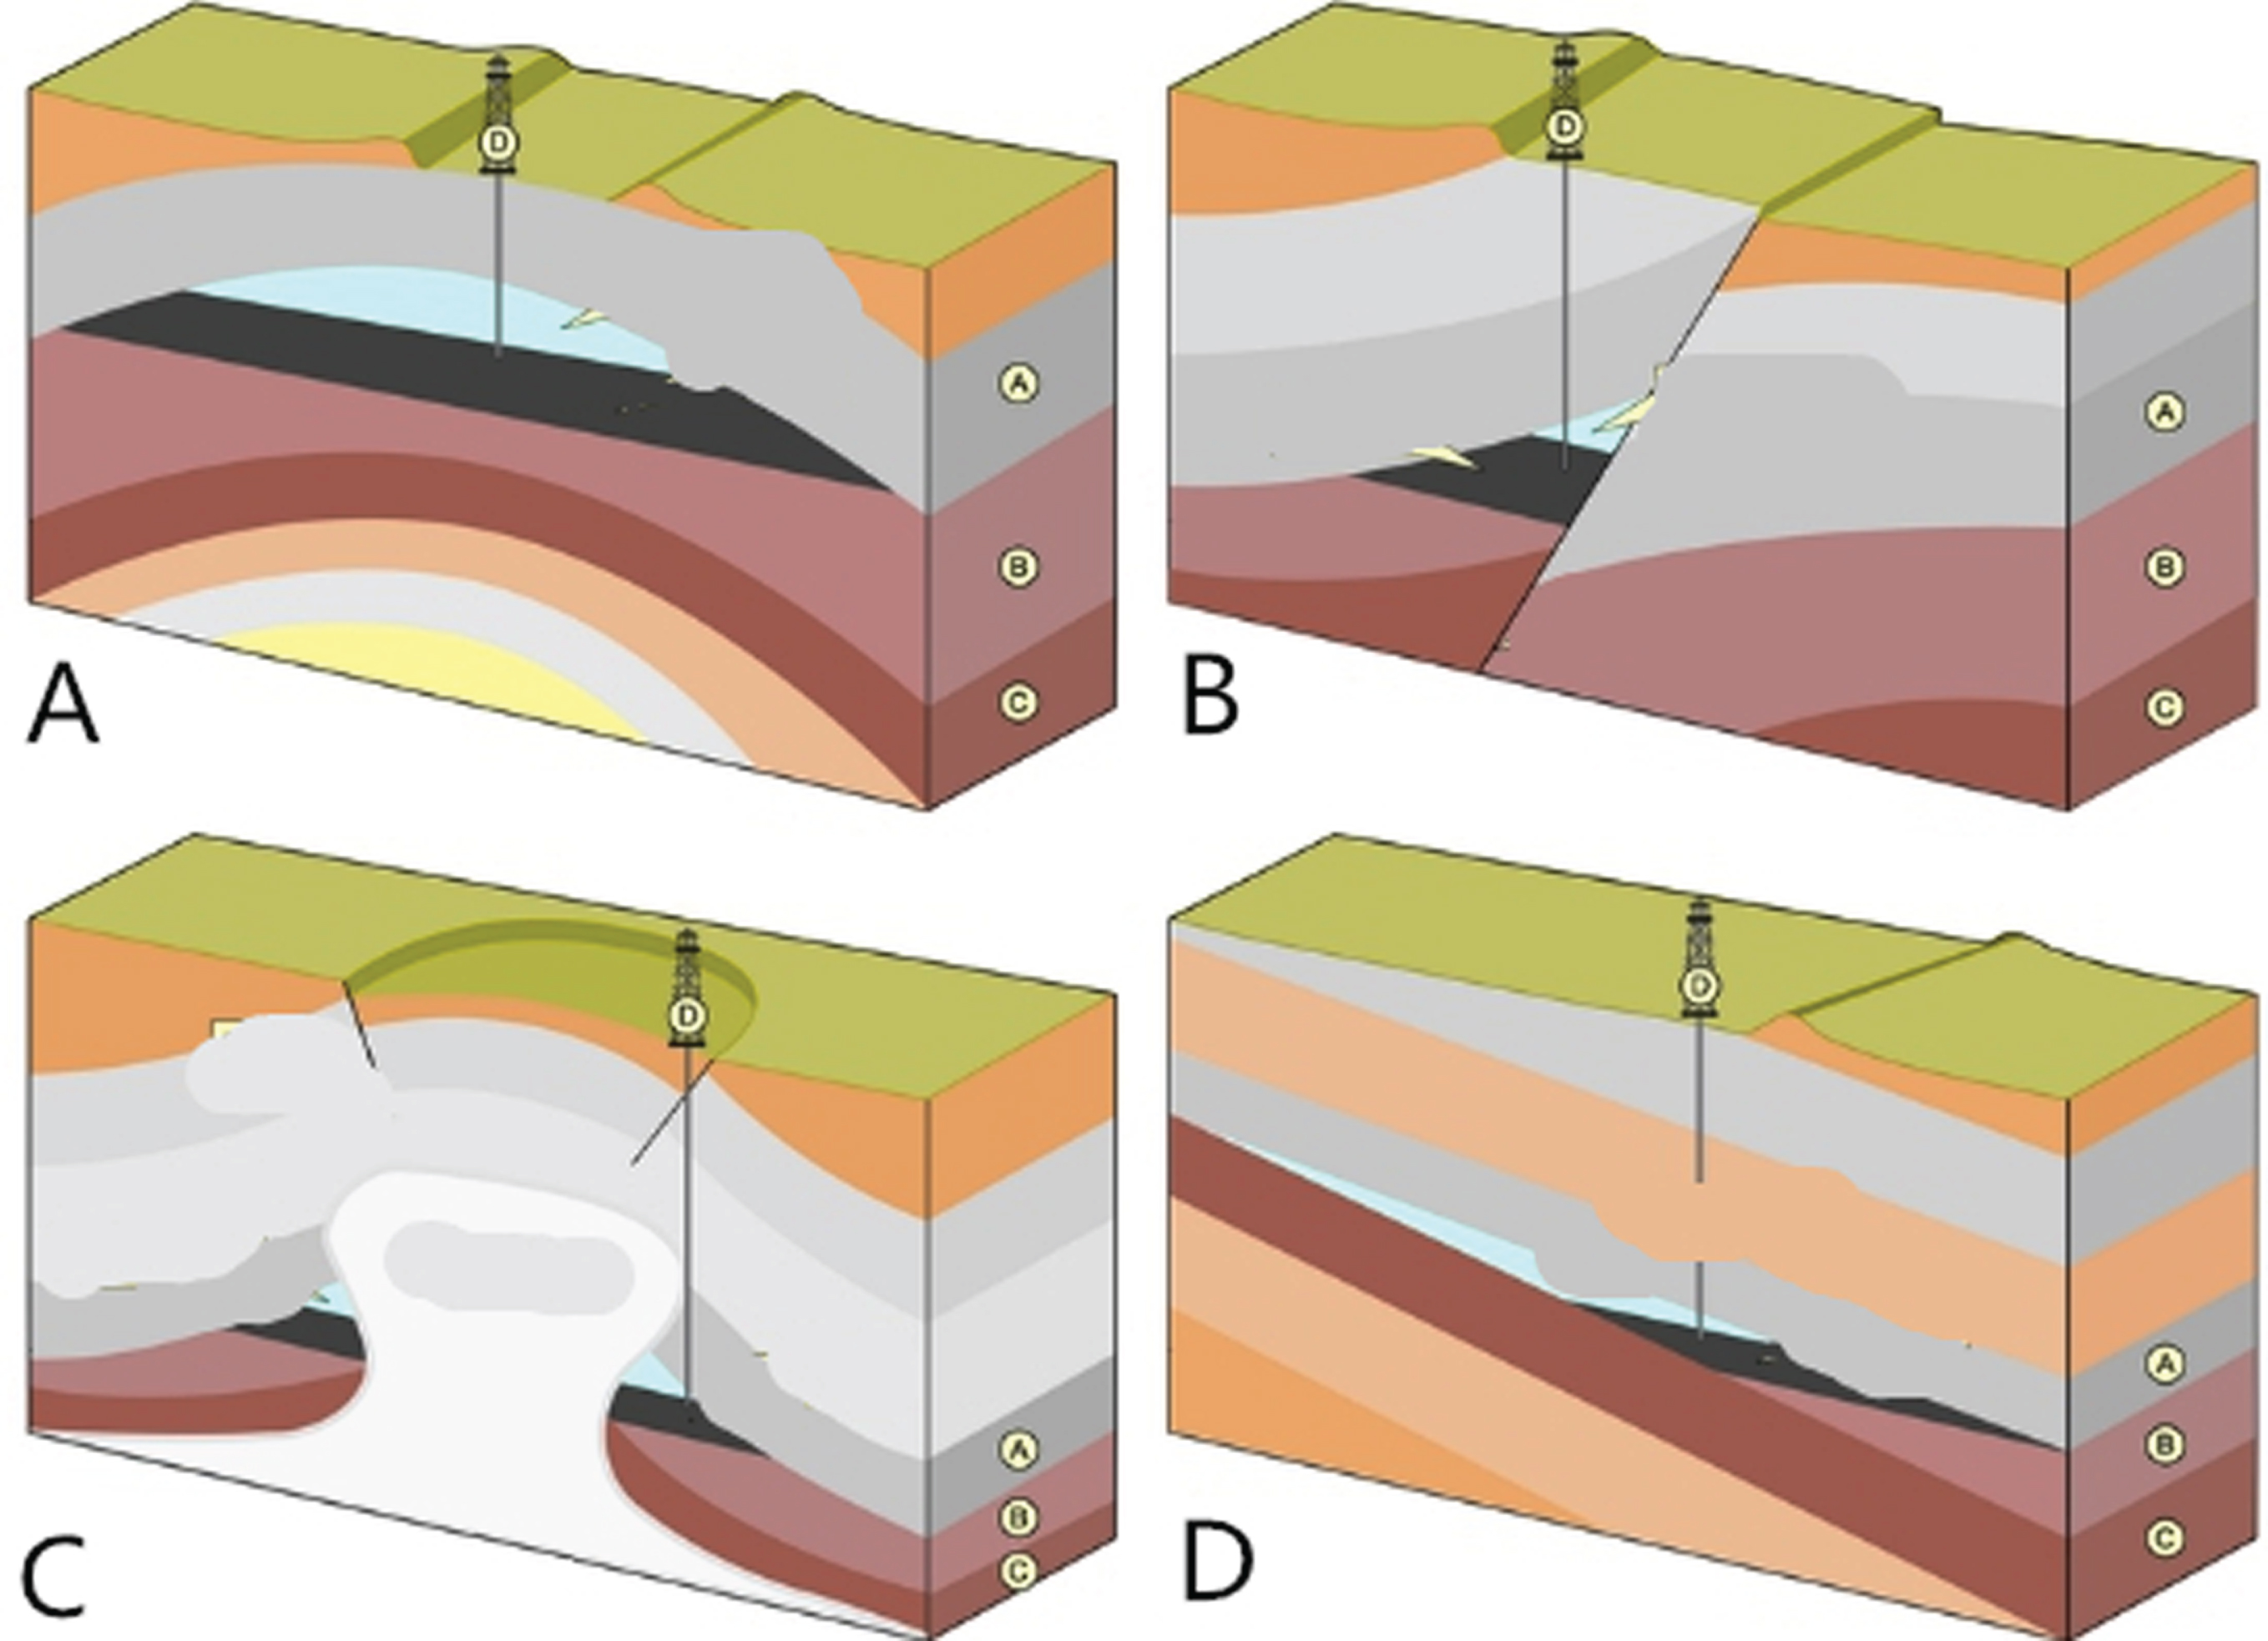
Several common gas storage geological structures.
Geological structure
Geological formations are the formations caused by displacement and deformation of rock formations and block movements in the earth’s crust, such as folds, cleavage, faults, joints, and other various linear and planar structures. The geological structure in the coal seam is formed in the later stage of coalformation, which changes the physical and mechanical properties of the coal and destroys the structure of the coal seam. The geological structure has a great influence on the coal and gas outburst in the mining area or mine, especially the faults and folds, so the geological structure must be paid enough attention in the coal mining process.
Ground stress
In-situ stresses in mines include geological tectonic stress, gravity, adsorption stress caused by adsorption of gas, and concentrated stress caused by mining. Generally, the stress is much larger than the gas pressure. The stripping of the coal body is caused by the gas pressure and the ground stress. The coal body extrusion and the pouring ground stress play a major role in the protruding process. The ground stress has relative stability with time, the earth’s own activities such as crustal plate extrusion, earth rotation, magma inflow, gravity, mantle heat convection, uneven earth interior, non-uniform expansion of the earth’s crust and surface erosion. The stress field is generated, so the formation of the stress field is complicated, and it is difficult to understand all the influencing factors of the earth stress. Liu Yunfang et al. proposed that the gestures field is divided into geological tectonic stress field and self-heavy stress field. The stress is constructed for geological structure and self-weight movement. The least square method is used to analyze the objective function. After verification, a reasonable linear regression equation is obtained and the stress field is proposed. Regression analysis method. Applying this method, the ground stress σ is related to the following variables:
Where: σ is the in-situ stress value;
x, y, z are the geological and topographical spatial coordinate values;
E, γ, μ is the elastic modulus, bulk density and Poisson’s ratio of the shelter;
Δ is a self-weight factor;
U, V, W is a geological structure factor;
T is a geological temperature factor.
The main influences of gestures on coal and gas outburst have three aspects: (1) the elastic deformation of coal and surrounding rock, causing the internal gas to destroy the coal and surrounding rock, and excite the protrusion; (2) the gestures field and gas The pressure field works together to further destroy the coal body and surrounding rock, causing the coal body to break and peel off; (3) the increase of ground stress reduces the gas permeability of the coal body, and the gas pressure gradient increases. When the coal rock is destroyed, it cannot withstand the internal Gas pressure can cause protrusions to occur [4].
Through a large number of geological observations and studies, it is found that the coal of the original structure belongs to non-prominent coal, and the structural coal formed by the destruction of the original structure coal belongs to the outburst coal. In order to distinguish between outburst coal and non-outburst coal, the concept of coal structure is introduced to represent the structure of outburst coal. According to statistics, the coal seams near the prominent locations are characterized by soft coal and disordered layers, namely soft-layered coal. Because of the low strength, loose and brittleness, and large pore and surface area of soft stratified coal, soft stratified coal is conducive to the occurrence and development of outstanding [5].
Coal seam thickness
Coal and gas outburst are not only related to the structure of the coal, but also related to the thickness of the coal seam and the thickness of the coal seam. In the multi-coal outburst, mine with stable coal seam thickness, the protrusion in the same thickness of the same coal seam has greater protruding risk than the thicker one. The outburst risk of thick coal seam is greater than that of thin coal seam; coal seam the risk of protrusion occurring at a large thickness variation is greater than the risk of protrusion occurring at a small thickness variation. The change of coal seam thickness makes the gas distribution non-uniform, and the change of coal seam thickness gradient reflects the change of gas gradient to some extent, which makes the distribution of gas outburst points unbalanced.
Watt parameters
Gas parameters refer to gas content, gas emission amount and gas pressure. The amount of gas generated is determined by the degree of coal metamorphism, and the gas pressure and gas content in coal are related to the degree of coal metamorphism and coal seam permeability [6]. The gas pressure in the coal seam refers to the pressure generated by the free gas in the pores acting on the pore walls. The gas pressure determines the gas content in the coal seam. When the coal adsorption gas capacity is the same, the gas pressure will be larger, and the gas content in the coal seam will be larger. Generally, the gas pressure is higher in the same coal seam or different coal seams, and the risk of protrusion is greater, but there are also special cases, indicating that coal and gas outburst are affected by many factors. Therefore, when analyzing coal and gas outburst in different places, According to the specific circumstances of the specific analysis.
Ant colony algorithm and ant colony clustering algorithm
Ant colony algorithm
When encountering obstacles during ant colony operations, they can use a short time to select the shortest route to reach the target location. This phenomenon has aroused the attention of bionics scientists. Through a large number of observations and studies, it is found that in the process of searching for food, ants will leave information hormones on the way they pass, and other ants can find and distinguish the number of such hormones, so Ants will choose the direction of the route through the guidance of this hormone; and this information hormone has a volatilization characteristic, and the pheromone in the path will have less and less residue due to the long path and the number of ants passing through, thus attracting ants. The probability of selecting this path will also become smaller and smaller; on the contrary, the path is short and the number of ants passing through will leave more pheromones, so the probability of attracting ants to choose this path will also become larger and larger [1]. Through the study of this natural phenomenon, the ant colony algorithm can solve complex optimization combination problems and many traditional optimization problems such as TSP and Job-Shop problems. See Fig. 2.
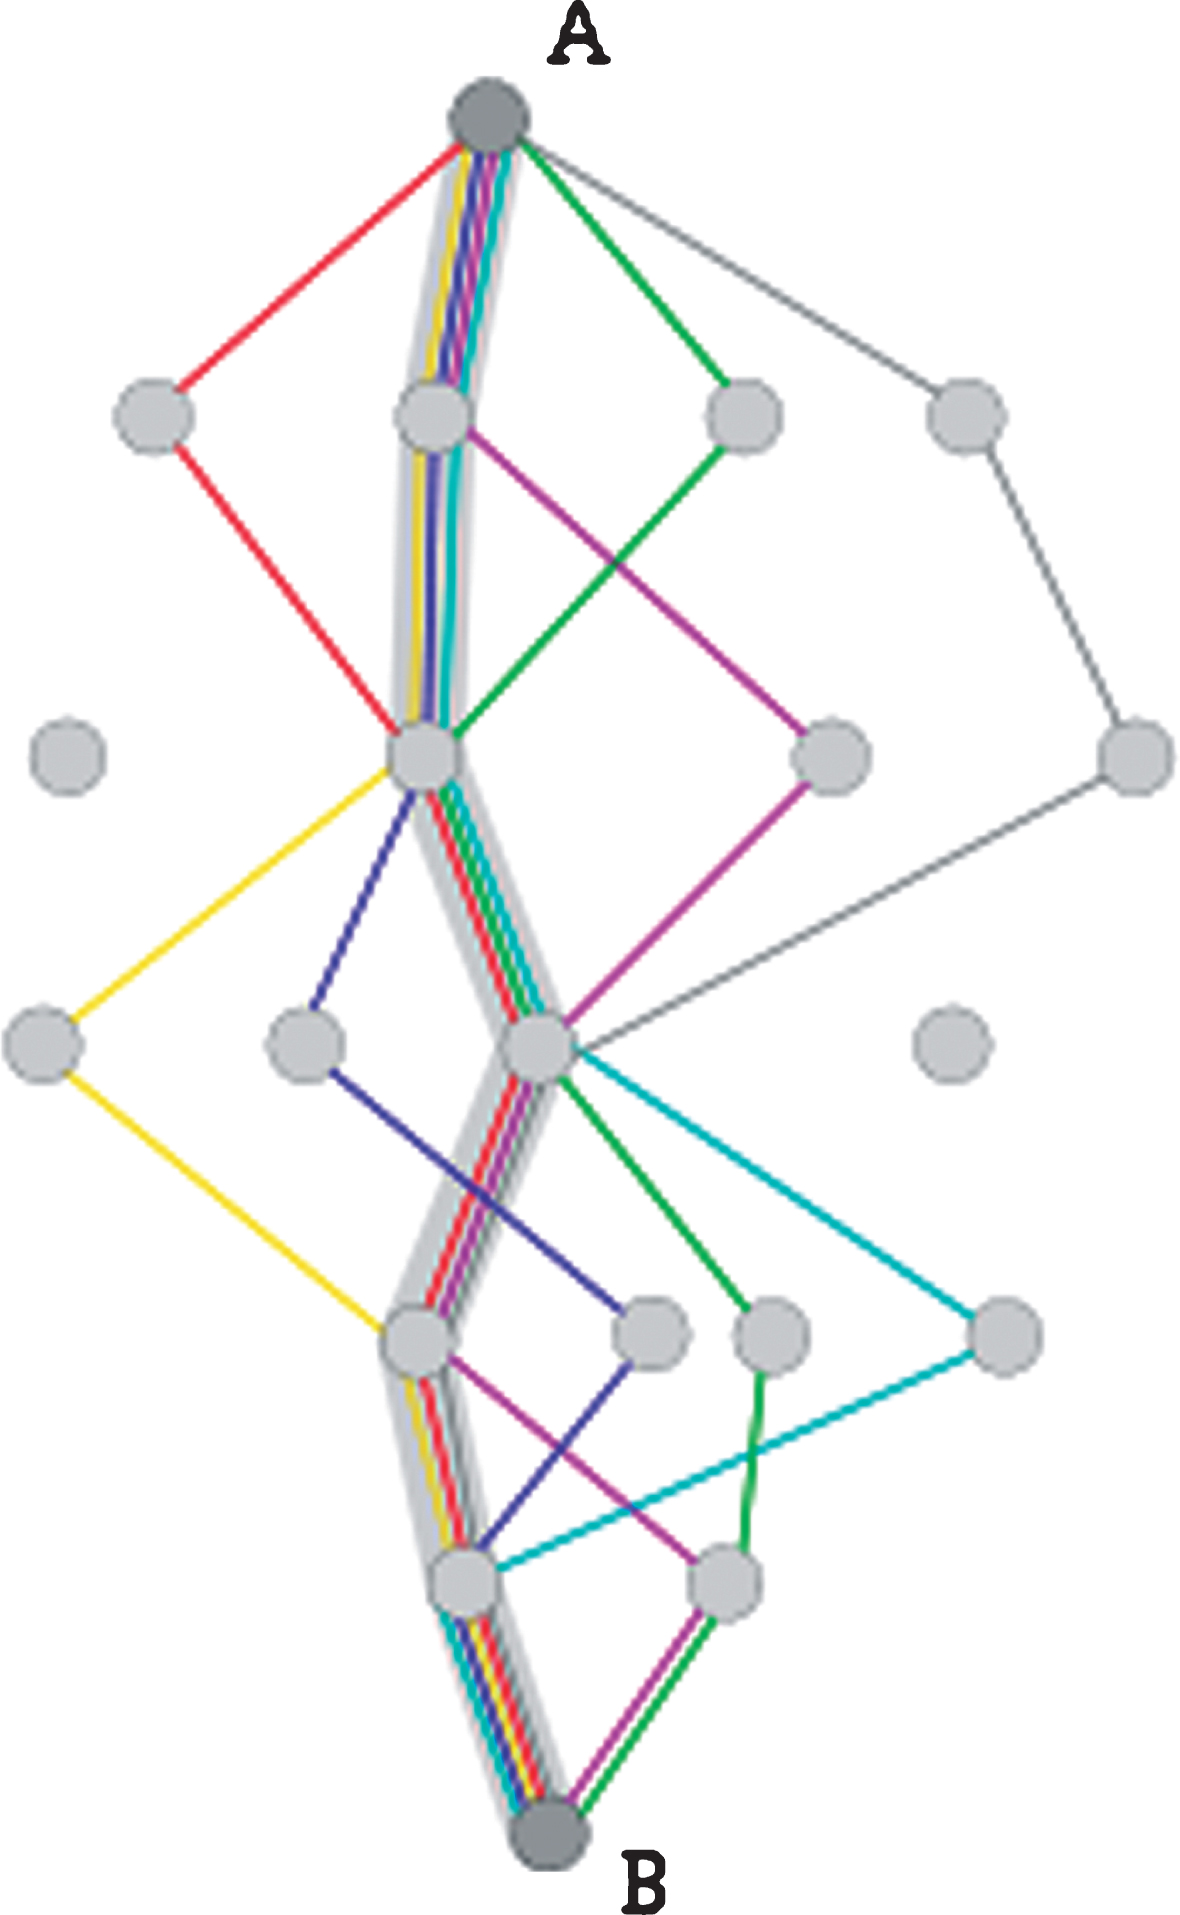
Schematic diagram of the ant colony system.
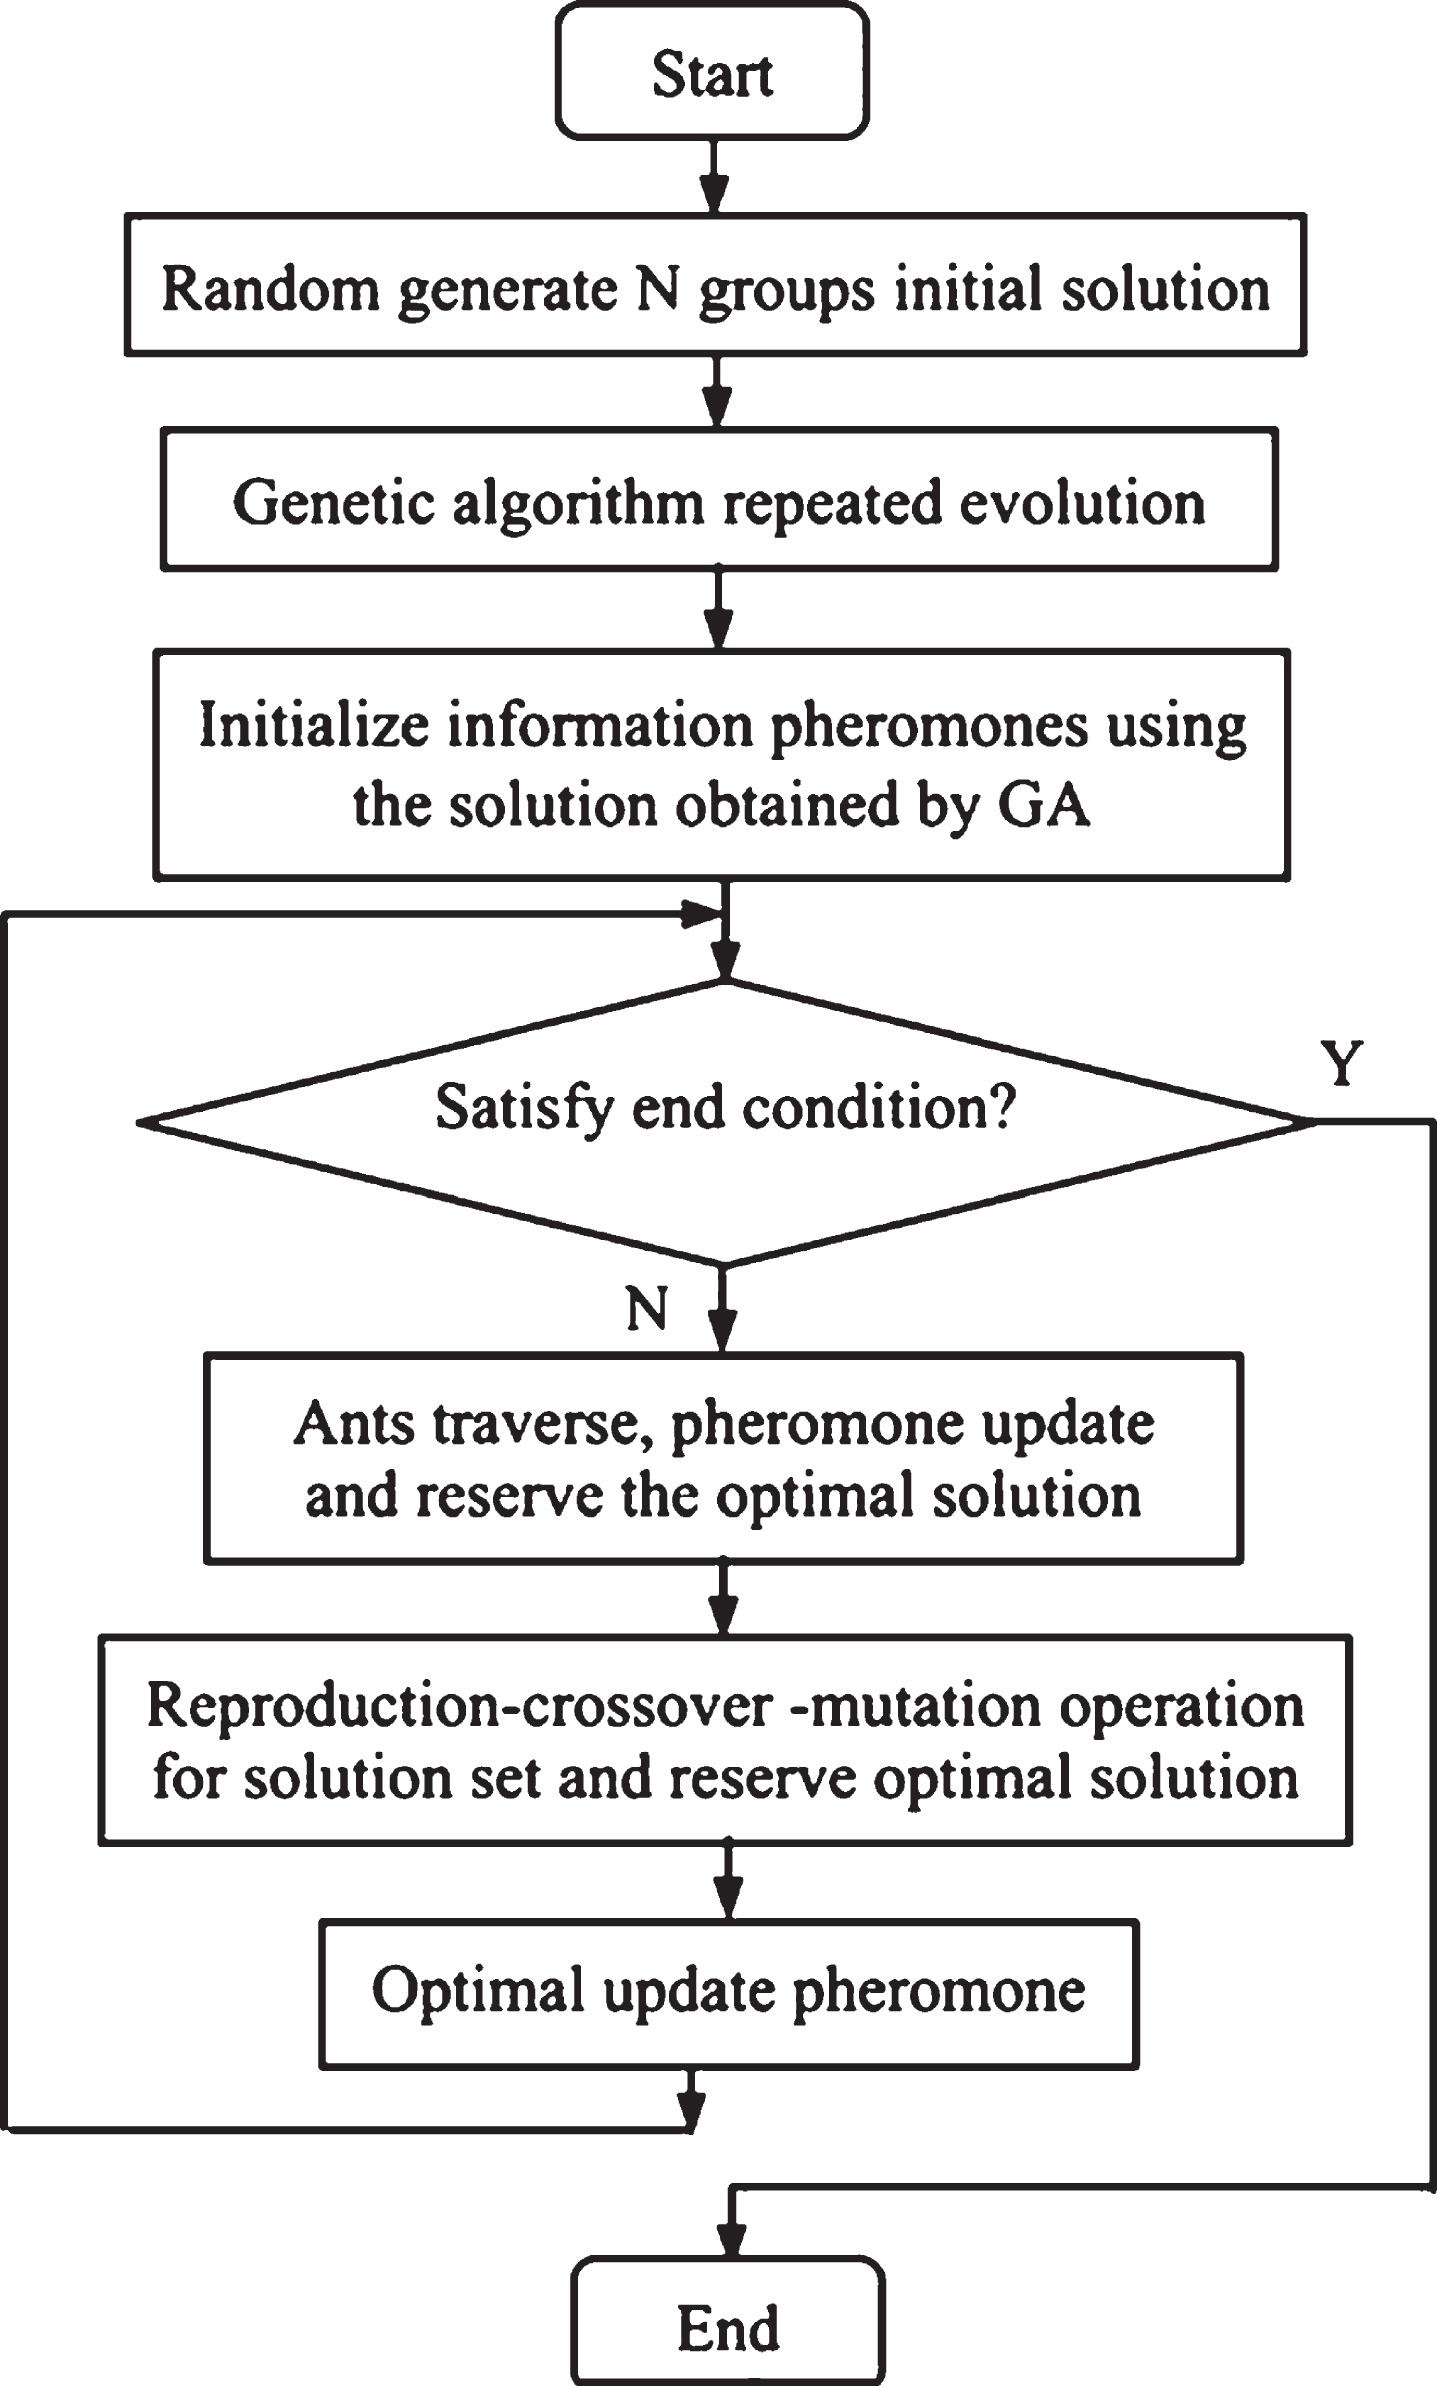
The basic process of the algorithm is given below and is expressed in pseudocode form: See as Fig. 3. Initialize the number N of ants in the ant colony, the maximum number of iterations is M, the length of the local region S, and some other parameters. Randomly distribute the data objects into a plane so that each data randomly obtains a coordinate value (x, y). A data object is randomly assigned to each ant to make it load state. Each ant is given a random motion velocity v. For i=1, 2,..., M, for j=1, 2,..., N, (the average similarity of the calculated objects). If the ant individual is not loaded, the picking probability Pp is calculated. If the picking probability Pp is greater than a random probability and the object is not picked up by other ant individuals, the ant individual picks up the object and randomly removes it, and marks the load, otherwise the ant individual randomly selects other objects. If the ant individual is already loaded, the drop probability Pd is calculated. If the drop probability Pd is greater than a random probability, the ant individual discards the object while marking that he has no load and selects a new object for judgment, otherwise the ant individual carries the object to move to a new location. For i=1, 2,..., n (for all objects). 1. If a data object is isolated, or the adjacent domain object of the data object is smaller than a certain constant, mark the data object as an isolated point; 2. Otherwise assign a cluster serial number to the data object, and recursively Neighborhood objects are marked with the same serial number. Basic flow of ant colony clustering algorithm.
When the ant finds the data o
i
at a certain location, the average similarity between the ant and the object oj is calculated by the following formula:
Where α represents the similarity parameter; v represents the velocity of the ant’s motion; vmax represents the maximum velocity; Neighs×s (r) represents the square local region around the location r with s as the side length; and d (o i , o j ) represents the distance of the objects o i and o j in the attribute space [7].
The Euclidean distance represents the geometric distance of a multidimensional space, which is defined as
Where m represents the number of attributes. The cosine distance is defined as follows
In the formula:
v is a random number: any number of ant speeds from 1 to the maximum speed. v is constant: all ants move at the same speed at any time. v is a decrementing random number: at the beginning, in order to make the clustering speed fast, the ant has a large initial velocity, and in order to make the clustering effect more accurate, the velocity is randomly reduced. The first speed definition method is used here for research convenience.
Probabilistic conversion is a function of the average similarity by which the probability of picking up or the probability of dropping can be obtained. When the similarity between the data of the domain and the data object encountered by the ant individual is small, indicating that the probability that the data does not belong to the domain is small, the probability that the data object is discarded is low, and the probability of picking up is high; The probability of an object being dropped is high and the probability of picking up is low. Through this principle, the symmetric Sigmoid function is selected as the probability conversion function. The probability of picking up a data object when a randomly moving ant individual has no load is defined as
When a randomly moving ant individual discards a data object, the probability is defined as
In the formula:
The function is in the form of a natural exponent. If the parameter c is large, the curve saturation speed is also faster, and the cluster convergence speed is also faster. It should be noted that in the process of clustering, since the individual data and the other data are greatly different, it will be difficult to put down when the ant individual picks up, so the c value is increased in the later stage of the algorithm, so that the ant can make the data. lay down.
The number of ants will have some influence on the clustering effect and convergence speed. If the number of ants is small, the convergence speed is slower; otherwise, the clustering effect is poor. When an ant individual picks up a data object, it will not calculate it when it calculates the average similarity. If the number of ants is large, it will make this phenomenon more, making the calculation result less accurate. Therefore, in practical applications, it is necessary to combine specific problems or trial calculation methods to determine the number of ants [9].
Determination and determination of coal and gas outburst prediction indicators
The analysis data was collected in a coal mine area. According to the analysis of the actual situation of the coal mine and the existing technical means, five indicators that can reflect the prominent factors and are easy to measure are selected: gas analysis index of drill cuttings, initial velocity of gas emission, coal the firmness factor, coal seam gas content and gas pressure. The gas analysis index of drill cuttings can correctly reflect the severity of the structural damage caused by the coal seam and the mechanical properties of the coal body. Generally, the gas desorption index of the drill cuttings is larger, and the risk of protrusion is greater. The initial velocity of gas emission reflects the changes of coal permeability, mechanical properties, coal seam gas pressure and content and ground stress. It is an important indicator for coal mine working face prediction. Generally, the initial velocity of gas emission is larger. The greater the danger. The solidity coefficient of coal reflects the mechanical properties of coal. Under the condition that the gas pressure and the ground stress are the same, the firmness coefficient of coal is larger, and the protrusion is less likely to occur. Gas pressure and content are an important factor in causing the outstanding, which plays an important role in the destruction of coal body and the carrying and pulverization of coal in the process of protrusion. Generally, the greater the pressure and content of gas, the greater the risk of protrusion [10].
Drill cuttings desorption index (K1) determination
This indicator (K1) is measured by the ATY type gas outburst parameter measuring instrument. The measuring method is to prepare 2m per drilling hole, and prepare the stopwatch and two sampling screens (the sieve of φ3 is on, the sieve of φ1 is below). Sampling, using a combination sieve to connect the drill powder to the orifice, and the stopwatch starts to count. After the coal sample is sieved, the coal powder is quickly put into the coal sample bottle, and the sieve is smoothed and the bottle cap is tightened. When the stopwatch reaches the predetermined time t0 (t0 is usually 1 to 2 minutes), the measurement is started, and after 5 minutes, the instrument prompts to input relevant data, and the display result isrecorded.
Determination of initial velocity of gas emission (Δp)
Gas release initial velocity Δp is an important indicator for predicting coal and gas outburst danger in underground working face. It refers to gas emission amount p2 and 0 within 45-60s expressed by mmHg after adsorption of coal sample at 1 atmosphere. The difference in the amount of p1 released within 10s. The initial velocity of gas dissipation is affected by factors such as pore surface properties, gas content and void structure of coal. When gas-containing coal bodies are prominent, the gas’s release and desorption capacity determine the outstanding destructiveness. Under the same conditions, the higher the initial velocity of gas scatter, the more easily the coal is destroyed and the greater the possibility of protrusion. This time, the WT-1 gas diffusion rate measuring instrument developed by Fushun Coal Research Institute was used. The operation interface is shown in Fig. 4.
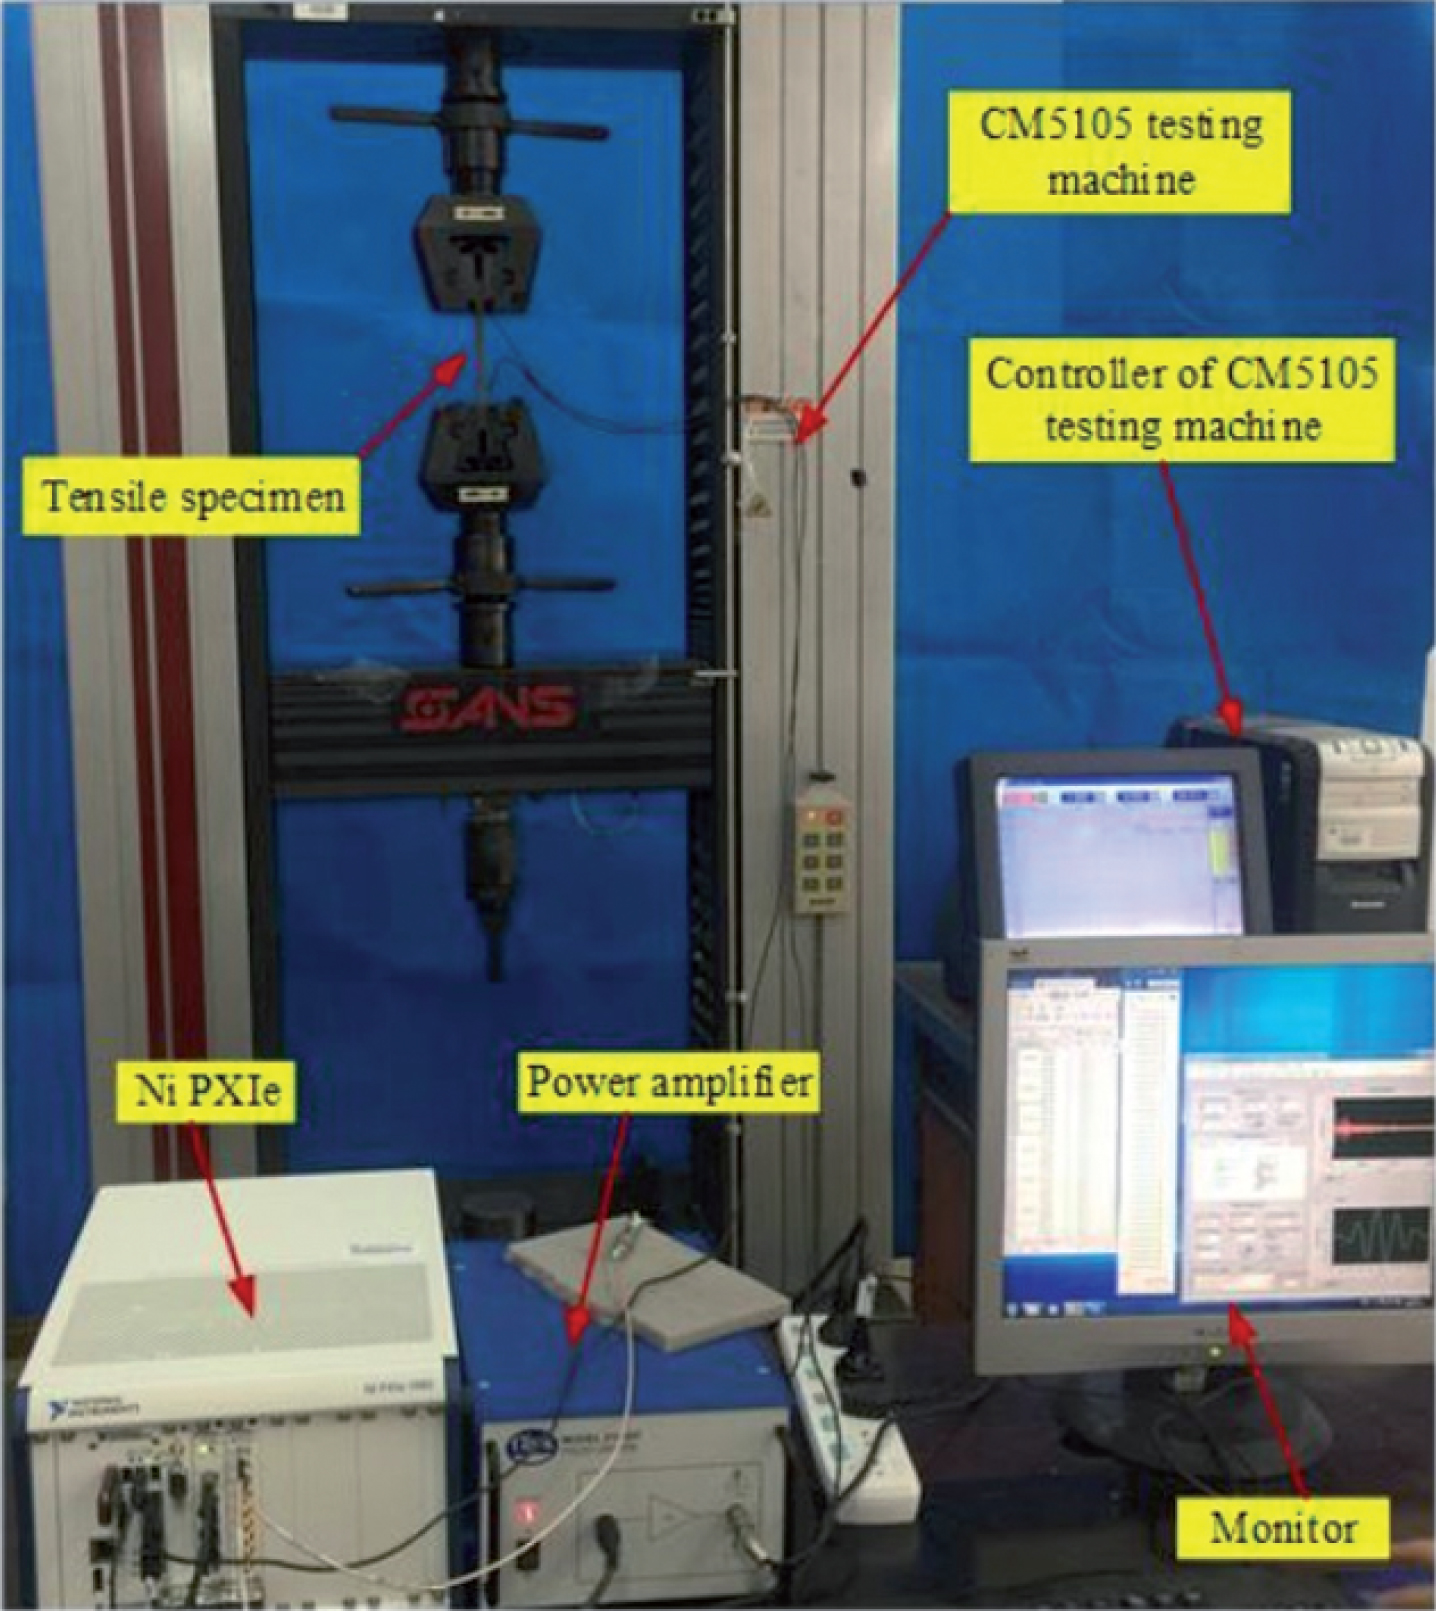
Monitoring console.
The firmness coefficient of coal is an important indicator for predicting coal seam outburst. Generally, under the same conditions, the greater the solidity coefficient of coal, the more difficult it is to protrude. The solidity coefficient of coal is determined by the drop weight method, and the degree of damage after the coal is chopped several times is determined. The solidity coefficient measuring device of coal is shown in FIG. In this measurement method, the energy (A) consumed by the crushing is proportional to the n-th power of the area (ΔS) in which the crushed material is increased, that is, A ∝ (ΔS) n (n is usually taken as 1). For the energy and average diameter of the crushed material, the larger the average diameter of the crushed material, the stronger the material, the larger the K; on the contrary, the smaller the average diameter of the crushed material, the less robust the material, and the smaller the K. It is inversely proportional to the material diameter and surface area per unit weight:
Take two coal samples with a block size of about 10cm from the new storm surface, crush them and divide them into five parts, each block is 20∼30mm, weighs 509, and put them into the measuring cylinder for the drop hammer crushing experiment. The sample is impacted 3 to 5 times, and the specific number is determined according to the firmness of the coal. All coal samples were poured into a 0.5 mm sample sieve, sieved into a graduated cylinder of less than 0.5 mm, and the height was measured. The calculation formula is: As shown in Fig. 5.
Where: f represents the firmness coefficient of coal; N represents the number of drop impacts, and H represents the height of the powder in the cylinder, mm. The measurement is performed three times in succession, and the average value is calculated as the firmness coefficient of the coal sample. In the case of soft coal, if the pellet does not meet the measurement requirements, it can be measured with a coal sample of 1-3 mm.
Coal solidity coefficient measuring device.
There are many methods for determining gas content in coal seams, including coal core desorption method for exploration drilling, coal dust desorption method for working face, gas content coefficient method and high-pressure adsorption method. High pressure adsorption method is one of the commonly used laboratory methods. The high-pressure adsorption method can be used to measure the gas content of the coal seam by collecting fresh coal samples, first conducting industrial analysis, then measuring the adsorption constant of the coal sample, and finally calculating the gas content. The methane adsorption constants a and b of coal are determined by high pressure adsorption. The principle is as follows: coal samples are taken on the newly exposed surface of the coal seam, and the coal samples with the particle size of 0.2mm to 0.25mm are vacuum-dried and then loaded into the adsorption tank [11]. Vacuum degassing, measuring the dead space volume of the adsorption tank; under a pressure of 0.1–5.0 MPa and a constant temperature of 300°C, a certain volume of methane is charged into the adsorption tank, so that the pressure in the adsorption tank is balanced, some gases are adsorbed, and some gases are adsorbed. Still in the free state in the dead space, it is known that the volume of methane charged, minus the free volume of the dead space, is the volume of the adsorbent. Repeating such a measurement, the equilibrium pressure and the adsorption volume of each pressure section are obtained, and the isothermal adsorption curve is connected; and the adsorption constants a and b can be obtained by data fitting according to the Langmuir equation.
The coal seam gas content can be calculated by using the adsorption constant a, b value, industrial analysis results and coal seam gas pressure values. The coal seam gas content includes free gas content and adsorption gas content. The free gas content of coal is obtained according to the gas state equation:
Wherein V represents the pore volume per unit weight of coal, m3/t;
P represents gas pressure, MPa;
p, T0 represents absolute temperature (273K) and pressure (0.101325MPa) under standard conditions;
T represents the absolute temperature of the gas (K), taking T = 293K;
ς represents the gas compression coefficient and can be obtained by looking up the table;
X y represents the free gas content of coal, m3/t.
Coal seam gas pressure is one of the powers of coal and gas outburst. It affects the gas content in the coal seam, the gas flow rate and the gas potential. Accurate determination of gas pressure can effectively predict the risk of coal seam gas outburst. The operation process is as follows: (1) Before the downhole test, the pressure test should be carried out on the ground (the pressure should be higher than the underground gas pressure of 0.5 to 1.0 MPa), so that the test system can be checked for reliability and ensure its safe and reliable use in the underground. (2) The pressure measuring point should be drilled in the vertical coal seam, and the diameter should be no more than 80mm. The emulsion should be filtered before use to prevent blockage of the pipeline. After placing the instrument at a predetermined position on the drilled hole, a pressure of about 2.0 MPa is applied to the emulsion, and the capsule is sealed after expansion. Later, the pressure is applied to the sealing section between the two capsules, and the mucus pressure is higher than the gas pressure by 0.3 to 0.5 MPa. (3) After the pressure gauge is installed, in order to prevent the pressure gauge from suddenly throwing out, it should be fixed on the special column. After sealing, the mucus pressure should be higher than the gas pressure by 0.3-0.5 MPa, and the emulsion pressure should be 1.5 MPa higher than the gas pressure. If the pressure drops, pressurize in time. When the pressure does not change for three consecutive days, this value is the gas pressure. (4) After the pressure measurement, pay attention to the recovery of the pressure gauge: first release the gas, then the mucus, and finally the emulsion.
Test results
The experimental data was collected from the No. 3 coal seam some District of a coal mine. Through the mining face’s prominent hazard measurement data, gas detection monitoring data and downhole measured data, the index data of different locations in some District of the mine were selected. According to the specific situation and the existing technical conditions, five indicators are selected to form a comprehensive prediction system for coal and gas outburst, and the results are normalized as shown in Table 1.
Normalized samples of coal and gas outburst prediction parameters
Normalized samples of coal and gas outburst prediction parameters
According to the hazard level of coal and gas outburst, it is divided into: no danger zone, highlighting threat zone and highlighting danger zone. The improved ant colony clustering algorithm is used to cluster the normalized sample data, and the parameters are set so that the number of iterations is L=1000, the number of ants is M=100, and the number of classifications is K=3. The clustering center was calculated by the K-means method, and the clustering mode was obtained as shown in Table 2. In the production practice, there is no prominent sign in the category I geological section, as the management of the non-prominent dangerous block; the geological block in category II has prominent signs in different degrees, so it should be managed as a prominent threat block; In the category III geological block, phenomena such as air-spraying, card drilling, top drilling, and roof caving have occurred, which should be managed as a prominent dangerous block. The prediction results are consistent with the actual results, indicating that the improved ant colony clustering algorithm is reliable in predicting the risk of coal and gas outburst.
Coal and gas outburst parameter clustering center
This chapter takes a coal mine as the research object, introduces the measurement method of coal and gas outburst prediction index, and observes and collects the data in the mine, the gas desorption index of the drill cuttings, the initial velocity of gas emission, the solidity coefficient of coal, Gas content and gas pressure are used as predictors of coal and gas outburst, and are programmed according to the improved ant colony clustering algorithm. This program is used to cluster the coal and gas outburst indicators, and the cluster center is obtained. The new sample to be predicted Compared with the clustering center, the outstanding risk degree is judged, and the obtained results are consistent with the measured data. It is proved that the improved ant colony clustering algorithm is feasible in coal and gas prediction.
Footnotes
Acknowledgments
The work reported in this paper was funded by the National Natural Science Foundation of China under NSFC Contract No. 51704102 and Heilongjiang Province General Undergraduate Higher Education Youth Innovative talent development plan (No. UNPYSCT-2017142).