
Abstract
The conventional image segmentation algorithm of the colorimetric sensor array is inefficient and vulnerable to the interferences of the environment. Therefore, in order to improve the conventional algorithm, an image segmentation algorithm based on fuzzy C-means clustering (FCM) algorithm is proposed in this study. Through the information of the gray-scale distribution histogram, the proposed algorithm divides the different wave-peak regions, where the pixels are relatively concentrated, into different clusters to determine the number of clusters. In addition, the gray values of these clusters are calculated to determine the initial cluster center. Next, the calculation results are used as the input of the FCM algorithm to complete the clustering segmentation of FCM. The research results show that the algorithm proposed in this study avoids the human participations of the traditional FCM algorithm. Also, based on the original algorithm, the proposed algorithm can reduce the calculation iterations, thereby improving the computational efficiency and obtaining the number of clusters with reference significance. As the results indicate, the proposed algorithm can better describe the fuzzy information in the image, thereby avoiding the problem of classifying the pixels into one category. Besides, the exponential function is used to control the influence weight of the neighboring pixels, and the adaptive weighting of the pixel grayscale is realized to improve the calculation accuracy of pixel grayscale and realize the image segmentation.
Introduction
Image segmentation is an important image technique. It is a critical step from narrow image processing to image analysis. Its main purpose is to divide an image into several meaningful regions with different features according to the features in the image [1]. Image segmentation plays a role in image engineering. On the one hand, it extracts information from the original image, transforms the image into more abstract and compact data, and has an important influence on various subsequent data measurements [2]. On the other hand, the data obtained by image segmentation is the basis of parameter measurement, feature extraction, and target expression, enabling higher-level image processing techniques such as image analysis and image understanding.
With the arrival of the digital age, most of the image information can be stored in the format of digital information, which are the components of electronic images. The essence of electronic images is a series of coding matrices, each of which represents the attribute value of a pixel [3]. Thus, the process of image segmentation is essentially the process of classifying elements with different attributes. The cluster analysis can categorize the same attributes and distinguish different attributes, which is suitable for image segmentation [4]. In addition, cluster analysis does not require much prior knowledge when segmenting the images; it segments the images according to the nature of the images themselves [5]. Researchers have found that in the process of segmentation of real images, the problem of pixel inconsistency between different regions often occurs, which indicates that image segmentation has ambiguity [6]. The fuzzy set theory can well describe the ambiguity in array image segmentation and help solve the fuzzy problem in array image segmentation. Therefore, the fuzzy set theory is gradually applied to image segmentation.
In this study, an improved algorithm is proposed to overcome the shortcomings of fuzzy C-means clustering (FCM) algorithm, which is applied to image segmentation of colorimetric sensor arrays and analyzed by the application of FCM algorithm in image segmentation of colorimetric sensor arrays. The image segmentation effect of the colorimetric sensor array based on the FCM algorithm has achieved excellent results. By continuously iterating and making the objective function gradually approach the minimum value, the membership relation between each sample (pixel point) in different clusters is obtained. Then, the different sample points are assigned to different categories by a certain method, thereby completing the image segmentation.
Related work
ShanmugaPriya and Valarmathi (2018) applied various learning techniques to tumor detection by comparing the extracted feature points of images involved in the research and the reference images; based on the edema and tumor segmentation of on fuzzy c-means, they combined multiple spatial information assembles to improve the clustering process [7]. The multi-level segmentation method used in their research relied on the global matching information between image distributions; also, it avoided the need for pixel information that reduced the computational complexity. Therefore, the edema could be observed more clearly, and the tumor was identified with additional space for proper removal. Kumar et al. (2019) explored that the FCM algorithm was suitable for area segmentation; the traditional FCM algorithm could effectively segment the noise-free images [8]. However, due to the negligence of spatial information, the segmentation results were highly sensitive to noises. In order to solve the noise-sensitive problem, they implemented a superpixel-based FCM (SPOFCM) that combined the effects of spatial adjacency and similar superpixels. Meanwhile, the crow search algorithm was used to optimize the influence degree, thereby improving the segmentation performance. Gupta et al. (2018) proposed an innovative approach to segment the multi-spectral color images. The proposed approach consists of two phases. In the first phase, on the input multi-spectral satellite color image on the HSV color space, the noise removal and contrast enhancement were performed on the selected frequency band. In the second phase, the fuzzy segmentation of the enhanced image obtained in the first phase is performed by the FCM algorithm through optimal parameter transfer [9]. The final conversion from the HSV to the RGB color space presented the segmentation results by separating the different regions of interest with appropriate and distinguishable color markers. The results were very promising and relatively better than other prior technical algorithms. Kumar and Harish (2018) proposed an improved intuitionistic fuzzy clustering (IFCM) algorithm for medical image segmentation. IFCM is a variant of traditional FCM based on the intuitionistic fuzzy set (IFS) theory [10]. Unlike FCM, IFCM considers the values of members and non-members. The current IFCM algorithm used the IFS generator of Sugeno and Yager to calculate the non-member values. However, for some parameters, the IFS constructed with the above supplementary generator do not satisfy the basic conditions of intuition. Therefore, a new IFS generator was used to overcome the problem. In addition, the Hausdorff distance was used as a distance metric to calculate the distance between the cluster center and the pixel.
Research by Lei et al. (2018) showed that since the FCM algorithm was sensitive to noise, the local spatial information was often introduced into the objective functions to improve the robustness of FCM algorithm in image segmentation [11]. However, the introduction of local spatial information often leads to high computational complexity, which is caused by the iterative computation of the distance between local spatial neighbors and pixels within the cluster center. In order to solve the problem, an improved FCM algorithm based on morphological reconstruction and membership filtering (FRFCM) was proposed, which was faster and more robust than FCM algorithm. First, by introducing a morphological reconstruction operation, the local spatial information of the image was incorporated into the FRFCM to ensure the noise proofs and image detail preservation. Second, based on the distance between the local spatial neighbors and the distance between pixels in the cluster centers, modifications to the membership partitions were replaced by spatially adjacent local membership filters that rely solely on the membership partition. Li et al. (2019) found that in terms of the sensitivity of the FCM algorithm to the initial clustering center and noise data, a single feature cannot effectively segment the image, and an image segmentation algorithm based on cellular automaton (CA) fuzzy clustering was proposed, as well as the functional weighting [12]. The grayscale was taken as the object. The image feature, the spatial feature weighting, and the FCM were combined. The fuzzy clustering of image segmentation was realized by CA self-iteration function. Eventually, the validity and feasibility of the algorithm were discussed. The experimental results showed that the proposed algorithm had fast convergence speed, strong anti-noise performance, and strong robustness. In order to effectively compensate the complexity and instability of image segmentation, Yan and Yang (2018) developed a segmentation scheme based on subtractive clustering and FCM algorithm. By applying FCM-based clustering algorithm, the target object was accurately obtained from the sample [13]. Meantime, the median filtering application eliminated the noise of the original image and verified the performance of the solution based on the experimental results. The results showed that SFCM could be used to extract valuable image information, which provided a promising basis for the application of brain magnetic resonance image segmentation. Wan et al. (2018) studied that the FCM algorithm and various improved algorithms combining spatial information were proved to be effective in image segmentation [14]. However, these methods and algorithms were not suitable for processing synthetic aperture radar (SAR) images due to the inherent speckle noise. The solution was to achieve effective segmentation of SAR images by simultaneously ensuring anti-noise and edge detail preservation. A robust FCM algorithm based on Bayesian non-local spatial information (RFCM_BNL) was proposed. The adaptation degree of non-local spatial information items to pixels was controlled by the entropy of the local gray histogram to ensure that the algorithm was robust to outliers. Experiments on simulation and real SAR images showed that RFCM_BNL could obtain the optimal results of SAR image segmentation compared with the other seven fuzzy clustering algorithms.
In summary, in this study, an image segmentation algorithm of the colorimetric sensor array based on the FCM algorithm is proposed. In view of the unsupervised classification, simple implementation, and suitable processing of image data, the FCM algorithm introduces color into the objective function. Some information is achieved in the accurate segmentation of the colorimetric sensor array. The proposed algorithm has been successfully applied to the field of array image segmentation. In addition, in the process of combining with other theories, the segmentation performance of the algorithm has been improved, which makes the algorithm suitable for segmenting different types of images.
The application of the FCM algorithm in the image segmentation of the colorimetric sensor array
The FCM algorithm
The FCM algorithm is based on the division of a clustering method. The core of this method is to maximize the similarity between objects in the same cluster, while the similarity between different clusters is the smallest [15]. The FCM algorithm is an improvement of the K-means algorithm. The division of the K-means algorithm is hard, while the division of the FCM algorithm is flexible.
The FCM algorithm performs clustering by dividing n vectors x
j
(1, 2... n) into c groups G
j
(i = 1, 2... c). Its objective function is defined as follows:
In Equation (1), ci represents the cluster center of the i-th group. When J obtains the minimum value, the best clustering result can be obtained.
The membership relation between each sample vector and the final group is represented by a c × n two-dimensional matrix U, where each element is uij, representing the membership relation between the j-th vector and the i-th group. The specific expression is as follows:
The algorithm should meet the following normalization constraints:
The ci that minimizes the Equation (1) can be obtained through the Lagrangian multiplier method:
The target function of the FCM algorithm is:
In Equation (6), u
ij
point j is the membership degree of cluster i; c
i
is the cluster center of the i-th group; m is the weighted index. The Lagrangian multiplier sub-equation of the following objective function can be constructed according to known conditions:
By deriving Equation (7), the necessary conditions for minimizing the Equation (6) are:
In the FCM algorithm, the number of clusters c and the parameter m should be determined in advance. In general, c is much smaller than the total number of samples and c > 1 should be guaranteed simultaneously. In addition, m is a flexible parameter. For an accurate segmentation result, the value of m must be noticed. If m is too large, it will affect the effect of clustering. If m is too small, the algorithm will approach the K-means clustering algorithm.
The output of the algorithm is c cluster center vector and a c × n fuzzy membership matrix. Since the algorithm uses fuzzy method to represent the membership information, the membership matrix can reflect the membership of the sample points more accurately [16]. The cluster center reflects the main features of the category and can also be used as a representative point for the entire category.
Due to the superiority of the FCM algorithm in the processing of fuzzy clustering problems, it has been widely used in the field of image processing, especially image segmentation. In the image processing process, all the pixels in each gray image are a sample set. The gray value of each pixel in the image is the feature of the sample point. The whole sample set is a one-dimensional vector x
j
(j = 1... n) [17]. Therefore, the problem of image segmentation can be translated into the following optimization problems for FCM objective functions:
The constraints are:
In Equation (11), m is the weighted exponent of the membership degree; n is the number of pixels in the image to be segmented; uij is the membership of the pixel point xj for the cluster i; the similarity measure is the Euclidean distance of the gray value between the pixel and the cluster center [18]. The membership matrix U ={ u ij } is a c × n matrix and the cluster center matrix V = {v1, v2... vc} is a 1×c matrix.
The FCM algorithm needs to iterate continually to make the objective function converge to the optimal value, thereby obtaining the final clustering result. If the initial value is closer to the result of the iterative convergence, the number of iterations will be greatly reduced, and the probability of convergence to the optimal global solution will be increased; otherwise, the computational complexity is increased, and it is easier to fall into the optimal local solution [19]. Therefore, choosing the appropriate initial value of the cluster center will have an important impact on the FCM process and results [20]. In the absence of prior knowledge, in many applications, only the random method can be used to determine the initial cluster center value. It is obviously difficult to obtain a suitable initial cluster center value, which will inevitably affect the segmentation efficiency of FCM algorithm in image segmentation of colorimetric sensor array.
The neighboring pixels of the image are processed by the colorimetric sensor to generate an influence matrix of the neighboring pixels. Each element of the matrix has a degree that the corresponding pixels of the matrix are affected by the neighboring pixels. Then, the matrix is called in each calculation to obtain the influence of neighboring pixels, thereby avoiding the multiple calculations for neighborhood pixels [21]. Generally, two filtering algorithms are used to calculate the neighboring pixels. One algorithm (FCMS1) uses mean filtering, and the other algorithm (FCMS2) uses median filtering. Both algorithms achieve excellent effects and improve the segmentation efficiency of the algorithms.
The analysis of FCM image segmentation
The image segmentation result of colorimetric sensor array based on global information of current FCM algorithm is prone to over-segmentation. In order to overcome the defect, based on the current FCM algorithm, by using the local information between regions, a merge strategy of segmentation region is introduced, and an improved FCM algorithm based on region merging is proposed [22]. The flowchart of the improved algorithm is shown in Fig. 1. Based on the current FCM algorithm, the segmentation result is used as the initial segmentation. First, each region is marked, and the adjacent relation between regions is determined, thereby establishing a region adjacency map [23]. Then, according to the gray level difference and the boundary gradient between adjacent regions, the inter-area integrated distance metric is calculated, and the weight of each side of the region adjacency map is obtained. Finally, according to the weight and area between the regions, by merging the mergeable regions into a multi-fork tree structure, the adjacent regions satisfying the conditions are merged to obtain the final segmentation result.
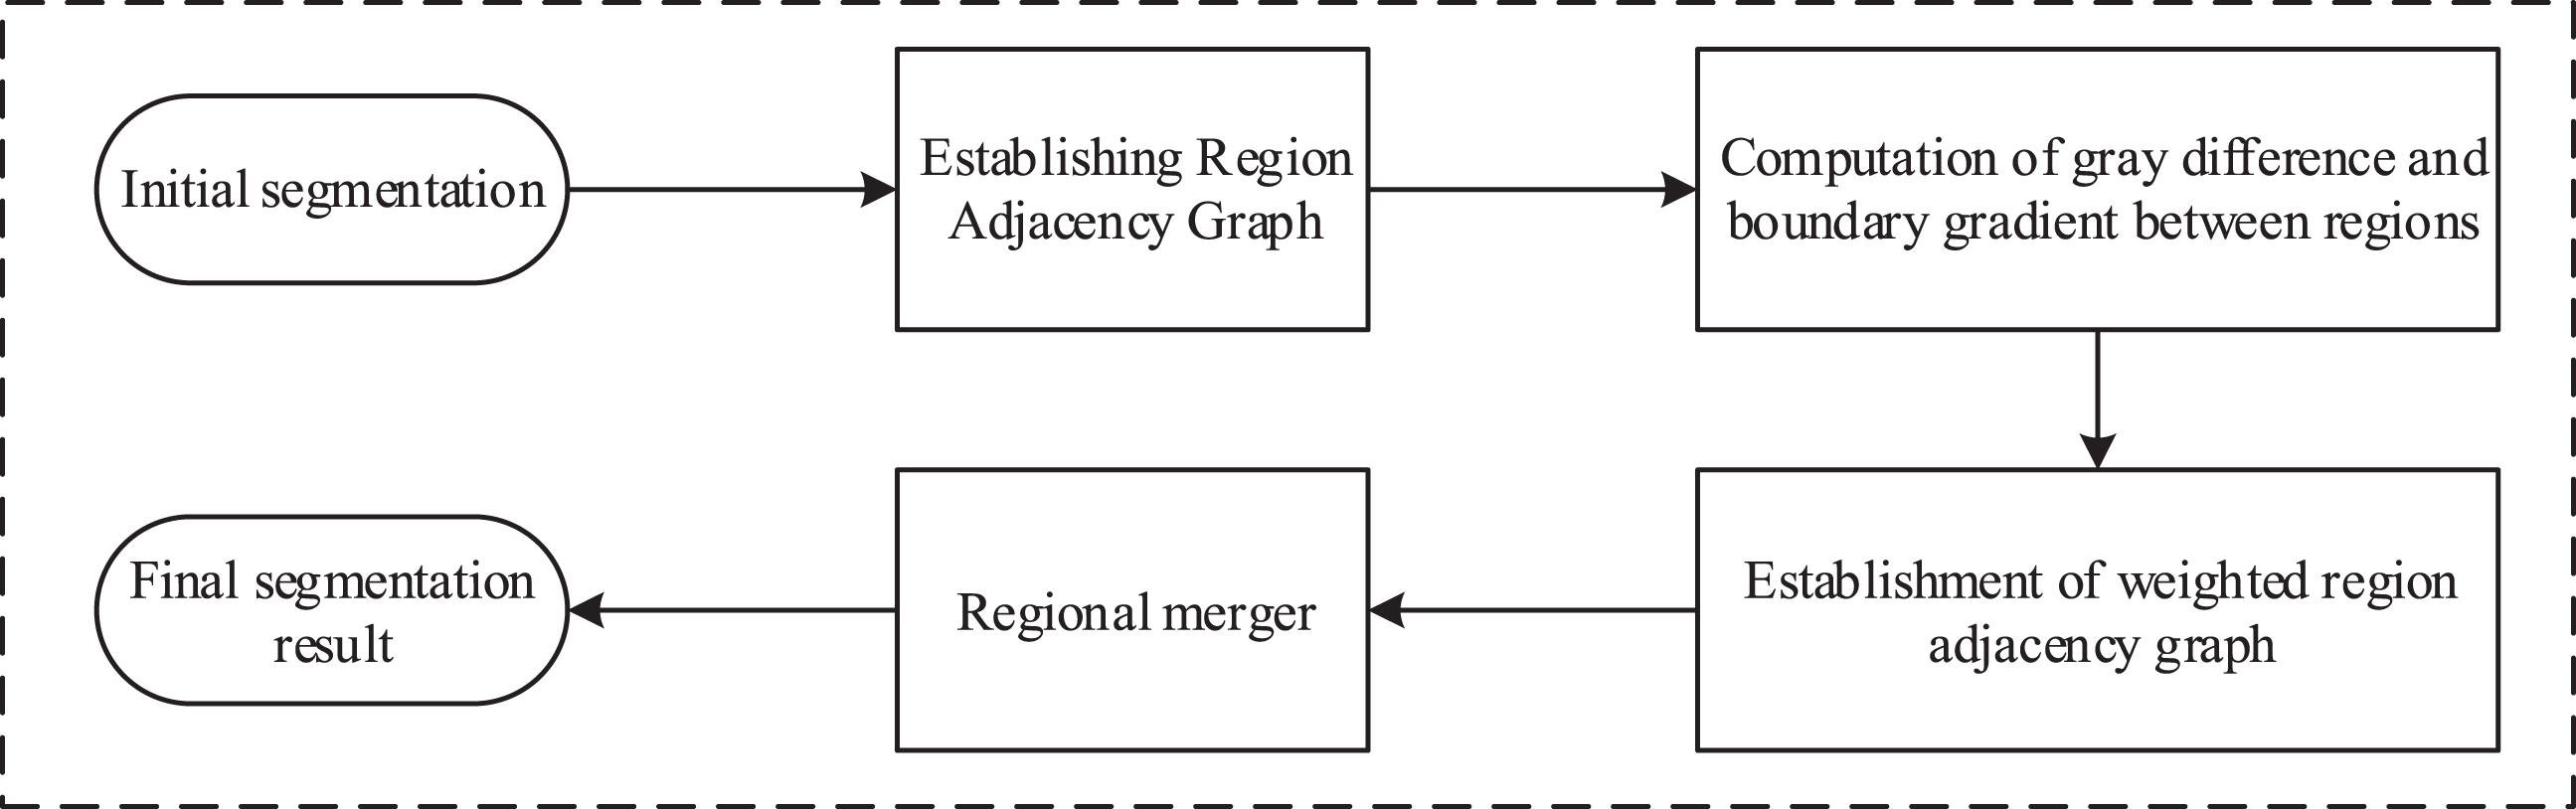
The workflow of the improved FCM algorithm based on region consolidation.
Among the region merging techniques, the weighted region adjacency map is an effective method for representing the relation between regions, which is defined as an undirected map G as follows:
In Equation (12), V is a collection of all regions in the image, which is called vertex set; E is the set of edges of each region in the image, which is called the edge set; W is the set of weights of the edges of all regions in the image. The weight of a pair of region edges is a constant greater than 0, which can be calculated from the inter-regional characteristics [24]. The weighted area adjacency map can be represented by a matrix.
First, a tag matrix of the same size as the image is created, which is named label. Each 4-connected region in the initial segmentation image is marked, the first connected domain is labeled 1, the second connected domain is labeled 2, and a total of v regions are obtained in the same manner. The value of each coordinate in the label is the tag number corresponding to the coordinate in the image [25]. For example, if the image size is M×N, the label size is M×N. If the pixel whose coordinates are (ij) in the image is marked as belonging to the second region, then in the label, the value at the coordinate (G) is l.
Then, the adjacency matrix is calculated by using the marking matrix. In the 4-connected region, including the up-and-below adjacencies and the left-and-right adjacencies, the processing methods for the cases are similar. Table 1 uses the pseudo code to describe the detection and storage methods of the up-and-below adjacent regions in detail, and the processing of the left-and-right adjacent regions is similar. Due to the constraints of length, a brief text description will be given based on Table 1.
Method for detecting and storing up-and-below adjacent regions
Among the above pseudo-code, the label matrix is an M×N matrix whose maximum value is v, indicating that there are v regions in total in the image. Label1 intercepts the first line to the (M-1)-th line of the label matrix, i.e., the upper half of the matrix; also, label2 intercepts the second line to the M-th line of the label matrix, i.e., the lower half of the matrix. Then, the upper and lower adjacent regions are found by misalignment comparison. The processing of the left-and-right adjacent regions is like the processing of the up-and-below adjacent regions. The second and third lines of the pseudo code are changed, and the first column to the (N-1)-th column and the second column to the N-th column of the label matrix are respectively intercepted. Then, the pseudo-codes 8 and 9 are respectively changed into vall = label (i,j) and val2 = label(i,j+1). Eventually, the 2 to 11 lines are run to detect and record the left-and-right adjacent regions in matrix A.
The corresponding program is programmed and implemented to test the segmentation effect of the proposed algorithm. The segmentation experiments of synthetic images and physical images are carried out to verify the effectiveness of the algorithm. The proposed algorithm is tested and compared with the conventional FCM algorithm, FCMS1 algorithm, FCMS2 algorithm, and NW-FCM algorithm. During the experiment, m = 2, the neighborhood of other improved methods used a 5×5 neighborhood slider with radius r = 2 (the neighborhood radius r was the distance from the center of the neighborhood to the boundary of the neighborhood), the penalty factor in FCMS1, FCMS2, NW-FCM, and the proposed algorithm was α=5. The noise added in the experiment was expected to be 0, and the variance was 0.01 Gaussian noise or salt and pepper noise.
A synthetic checkerboard image was partially used for segmentation experiments. Gaussian noise was added to the black, white, and gray checkers. The experimental results of FCM, FCMS1, FCMS2, NW-FCM, and the proposed algorithm are shown in Fig. 2.
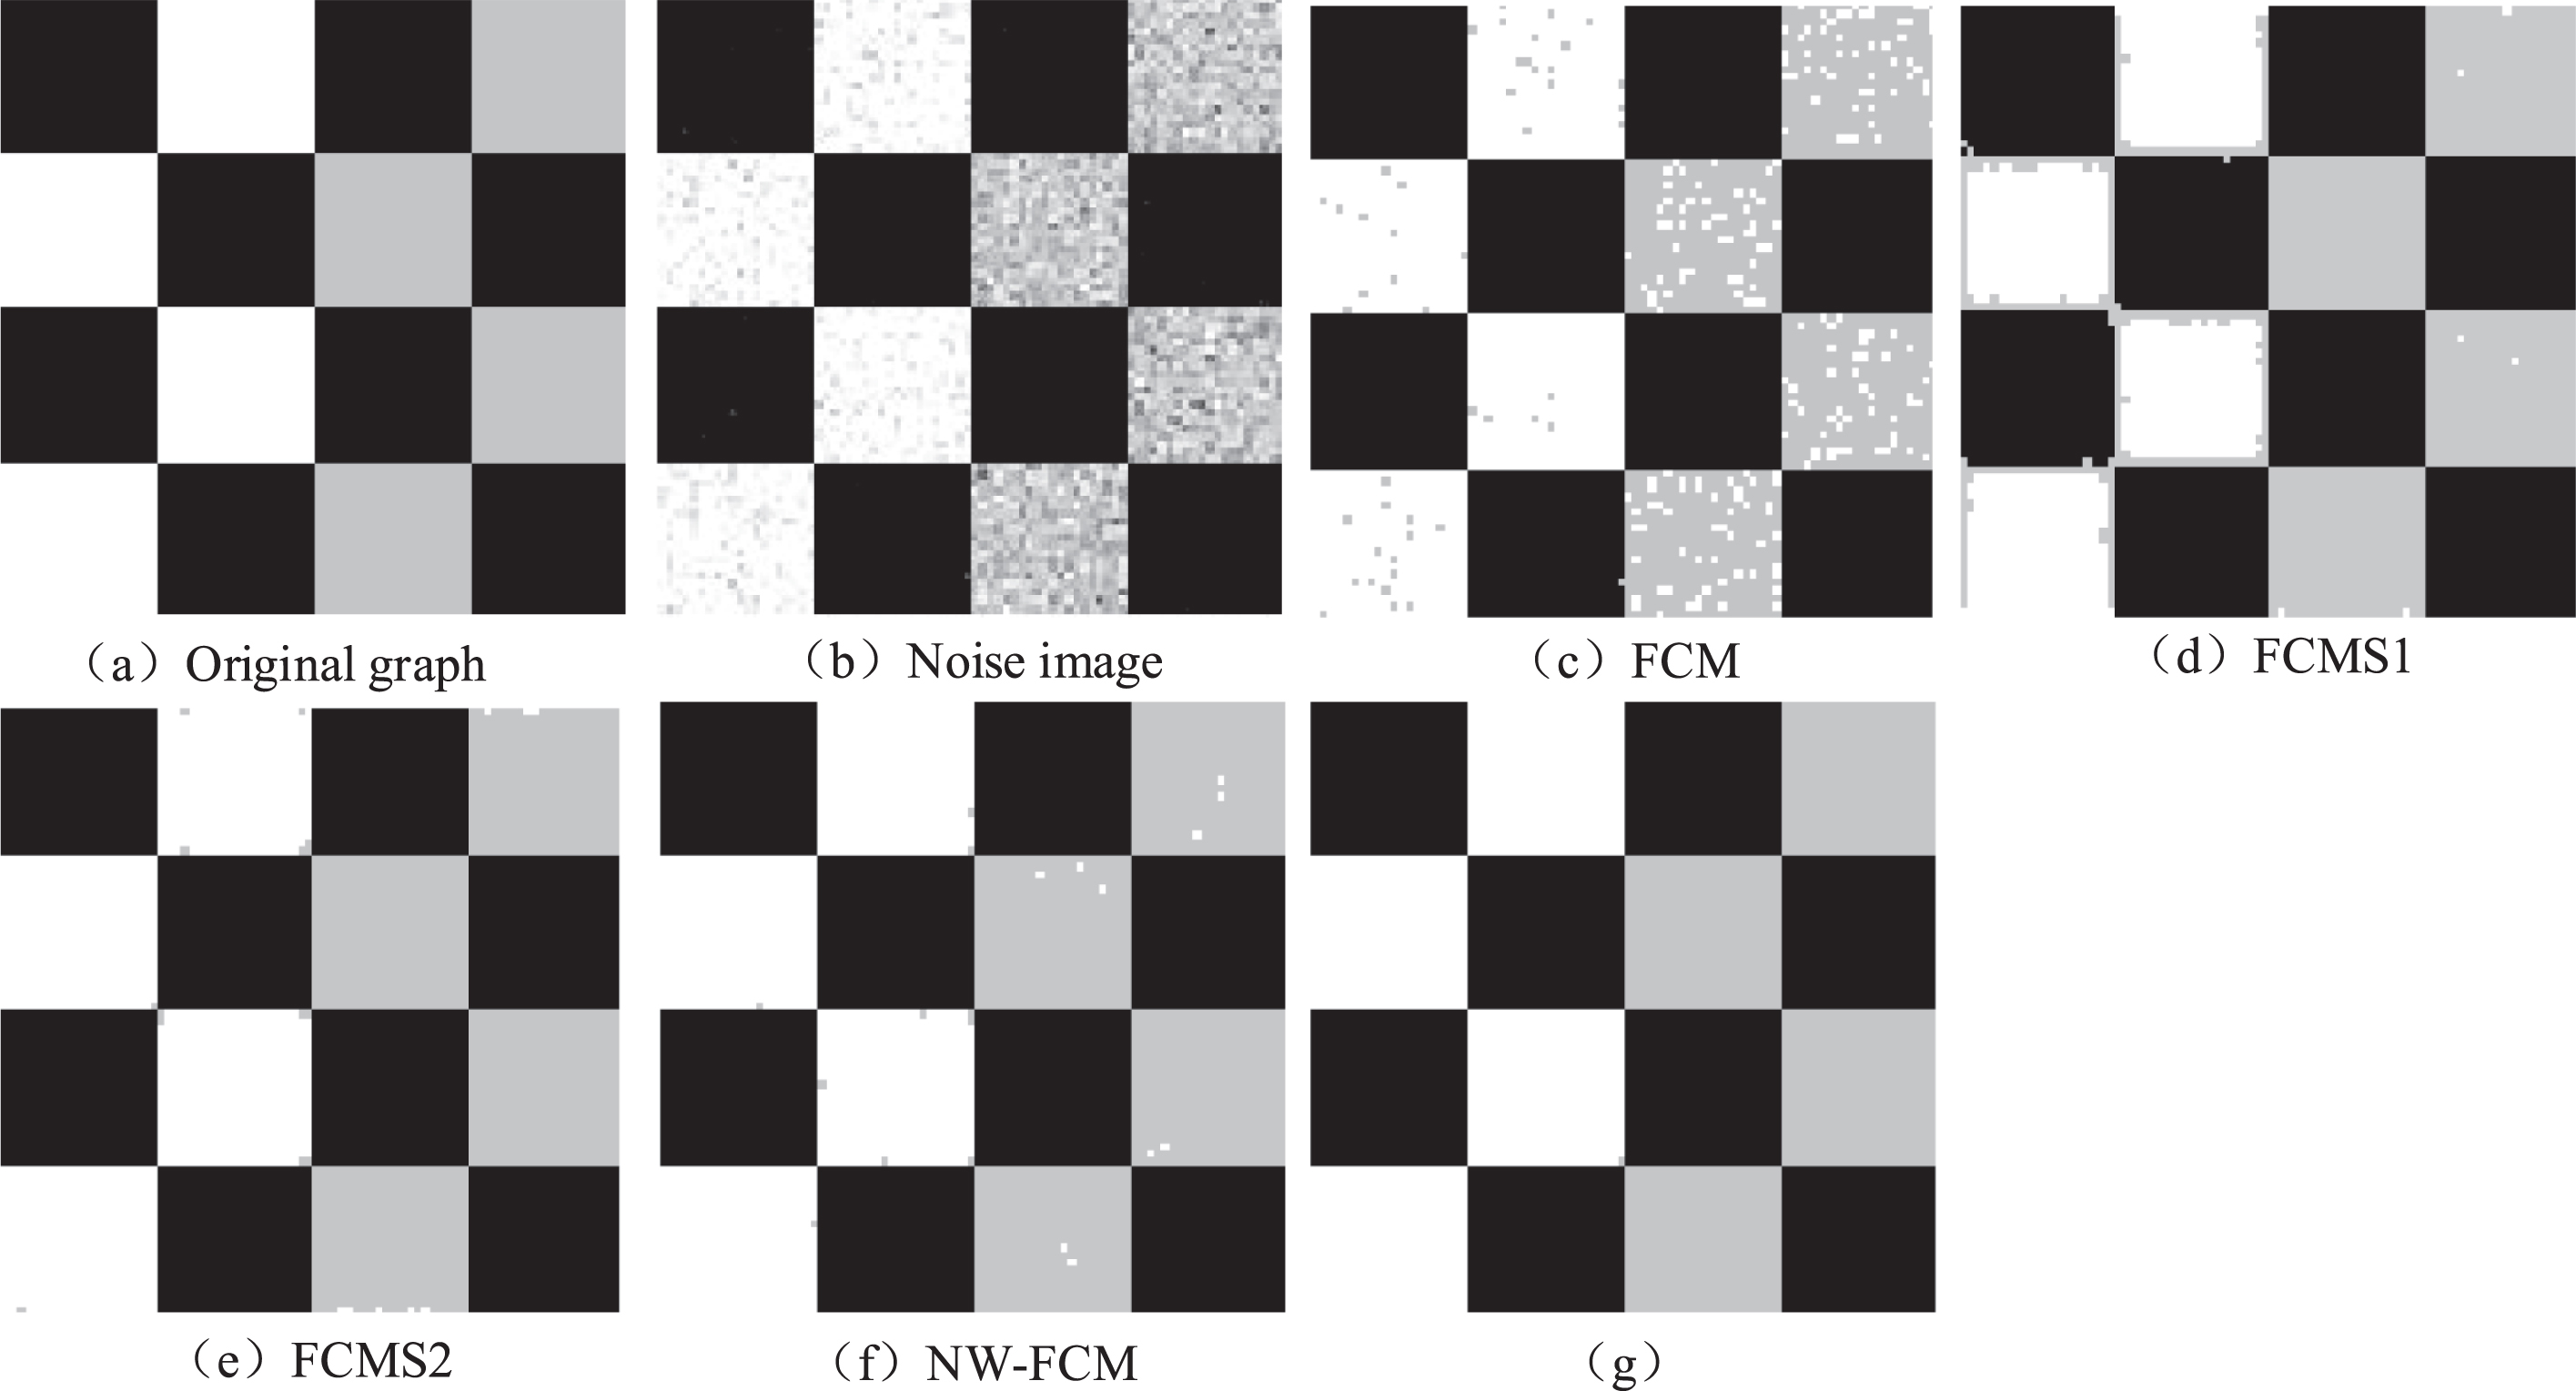
Comparison of synthetic images.
As shown in Fig. 2(c), since the classical FCM clustering algorithm lacks the addition of spatial information, a lot of noise still exists after the segmentation. Although the FCMS1 algorithm considers the influence of neighboring pixels, it adopts the method of directly finding the neighborhood mean; therefore, more noise will exist at the intersection of different gray values with different image differences, as shown in Fig. 2(d). In relative terms, the segmentation effect is not ideal. As shown in Fig. 2(e) (f) (g) that FCMS2, NW-FCM, and the proposed algorithm are ideal for the artificially synthesized image, while the segmentation effect of the proposed algorithm is most prominent with almost no residual noise. Figures 3–6 are the comparisons of each method.
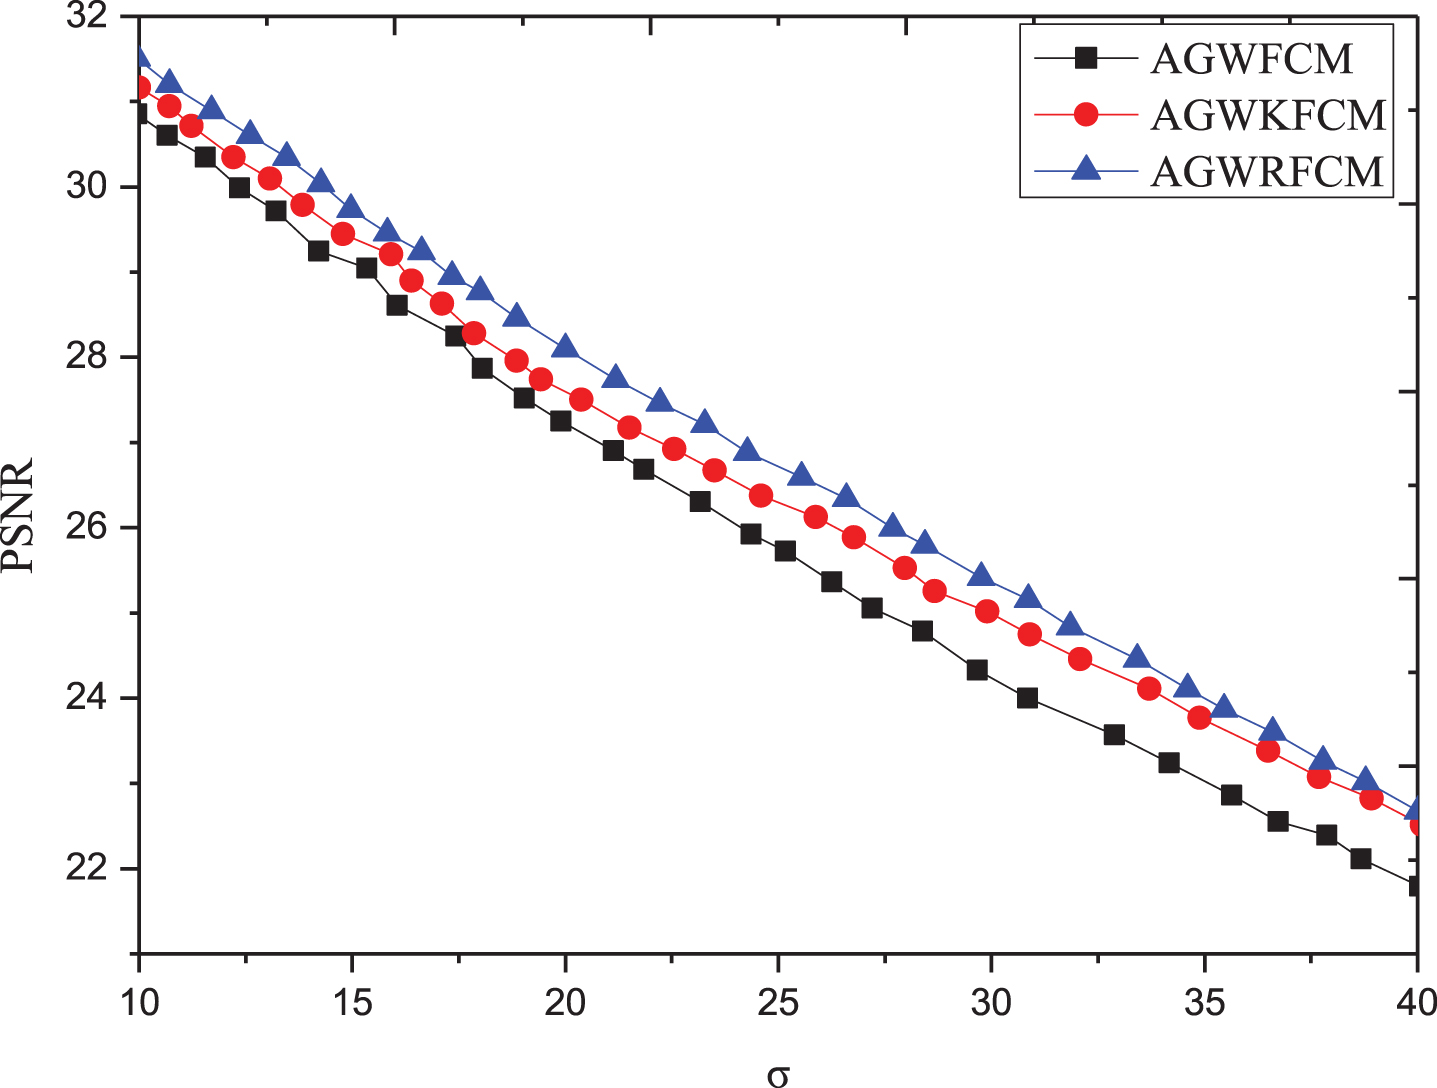
PSNR curve of the noisy synthetic image.
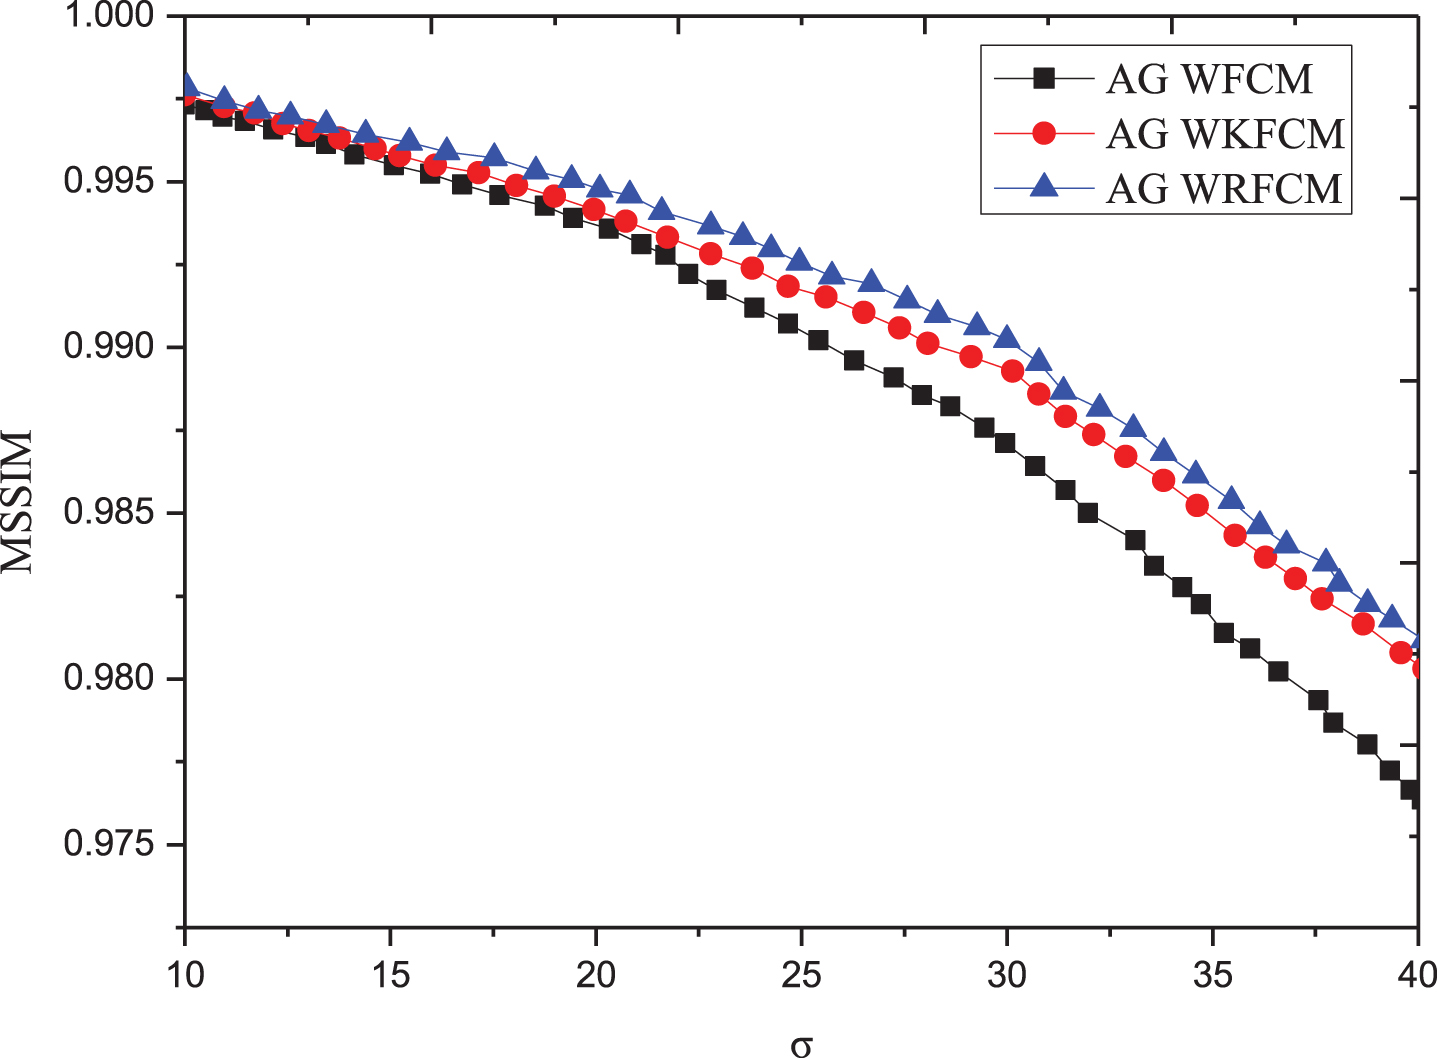
MSSIM curve of the noisy synthetic image.
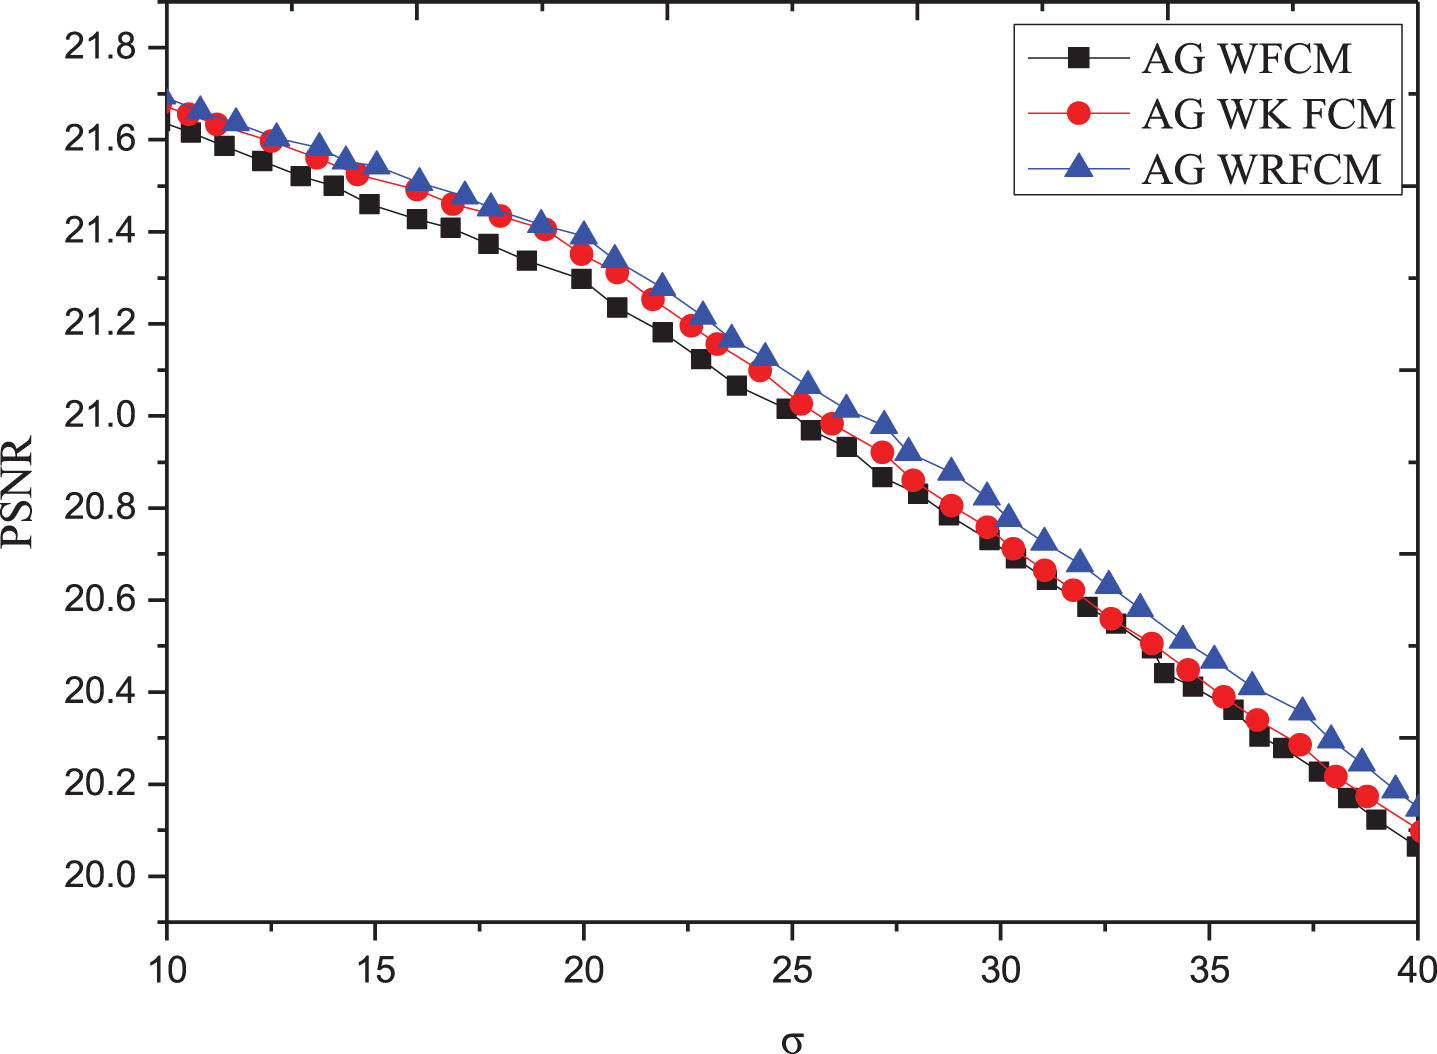
PSNR curve of noisy natural image.
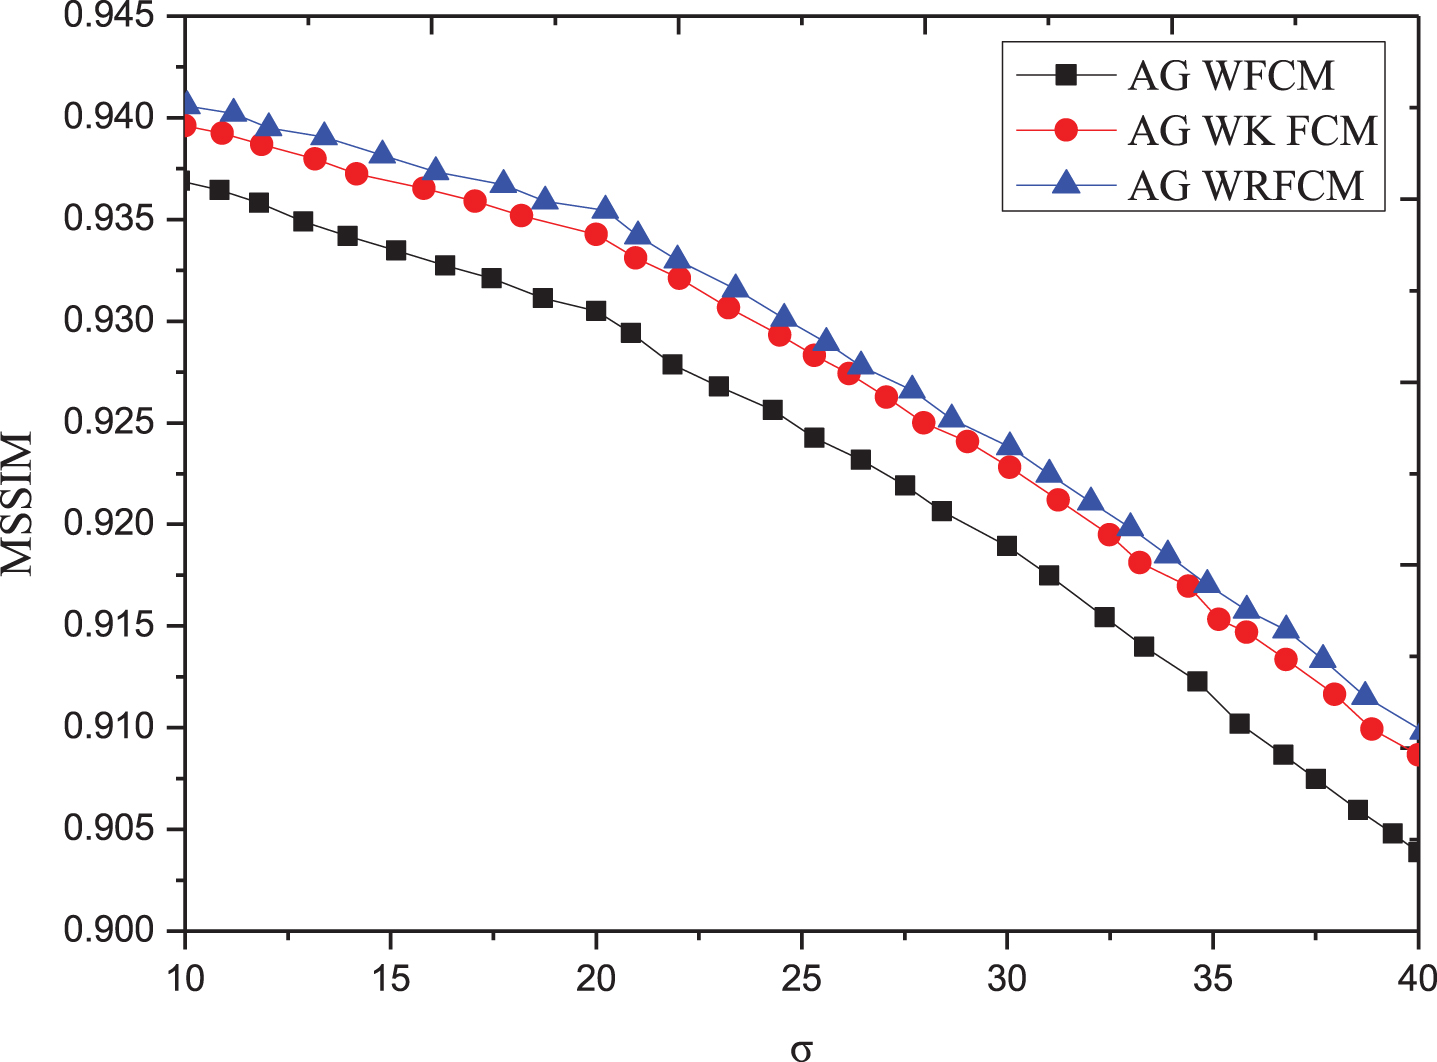
MSSIM curve of noisy natural image.
Table 2 shows the result data for FCM, FCMS1, FCMS2, NW-FCM, and the algorithm proposed in this study when segmenting a checkerboard image containing Gaussian noise. In the table, Vpc is the partition coefficient, Vpe is the partition entropy, and SA is the segmentation accuracy, which indicates the entropy of the correctly divided pixels and the total number of pixels.
The comparison of image segmentation results
As shown in Table 2, the segmentation effects and accuracy of FCM and FCMS1 algorithms are relatively weak, while the FCMS2, NW-FCM, and the proposed algorithm have achieved quite ideal results, and the proposed algorithm has the best segmentation effect.
As indicated in the time consumption, the proposed algorithm takes more computing time in the neighborhood processing, which also takes more running time than other algorithms.
In this study, an image segmentation algorithm of colorimetric sensor array based on fuzzy C-means clustering is proposed. The method determines the initial cluster center and the number of clusters by the gray-scale distribution histogram information of the image. Experiments on different types of images show that the proposed algorithm can better determine the initial cluster center and the number of clusters, thereby improving the efficiency and automation of the algorithm. An improved FCM image segmentation algorithm combining neighborhood information is proposed to solve the problem of image segmentation for noise sensitivity. The comparison with the original algorithm and several similar improved algorithms shows that the improved algorithm has excellent segmentation effects on different images. The algorithm proposed in this study could have further improvements. The image segmentation algorithm of colorimetric sensor array based on fuzzy C-means clustering is difficult to select the appropriate number of clusters when the image gray histogram distribution has only a single peak. Meanwhile, the image segmentation algorithm combined with neighborhood information needs artificially selection of noise influence parameters. The way to automatically determine such parameters according to the image could be improved in future works. In addition, new similarity measures could be added to the clustering algorithm to improve the segmentation effect of image segmentation in further.
Funding
Supported by “National Key R&D Plan”: 2016YFB1200402 Supported by “National Key R&D Plan”: 2018YFB0605504