
Abstract
In this paper, we designed a smart bracelet to realize human behavior recognition, remote monitoring, fall detection, alarm and other functions. We use a six-axis inertial measurement module to collect a large amount of human body posture data. The Kalman filter is used to preprocess the data of acceleration and gyroscope, and then the processed series data is segmented by sliding window method. At last these data are put into a convolutional neural network(CNN) to identify human activities. Furthermore, we designed a two-level fall behavior judgment, the first-level threshold determination is performed through smart bracelet, when a suspected fall behavior occurred, the sequence data are uploaded to the cloud platform, the second CNN discriminant model is triggered to accurately determine whether a fall behavior occurs.
Introduction
Human behavior recognition systems can be classified into video-based images [1], physical-based environment, and wearable-based devices. Among them, the fall detection system based on video image can realize more accurate human behavior recognition, but it needs to be fixed indoors, and can not be detected after leaving the fixed part of the environment, which greatly limits the user’s activities. At the same time, the collection of image and video may be involved in private privacy and cannot be accepted by most people. Human behavior systems based on physical environment, such as plantar pressure, infrared sensing, etc., can only be suitable for indoor use, and the monitoring range is limited. The high installation cost also makes it applicable only to specific places and cannot be accepted by the public [2]. Based on the human behavior system of the wearable device, its advantage is that it can be applied indoors and outdoors, the behavior of the user is not limited, privacy issues are not involved, the alarm mode is relatively flexible, and the low price is more suitable for widespread promotion [3].
In the latest research field of artificial intelligence, many different techniques are used to model and identify human behaviors [4]. The recognition accuracy of traditional machine learning methods depends largely on the quality of feature engineering [5]. It requires not only manual design and combination of features, but also a lot of time to extract and accurately reflect the relevance of the data. In recent years, deep learning has not only demonstrated its own powerful learning ability in image processing and natural language processing, but also in the aspect of human activity recognition, deep learning has achieved the best in the current situation with little or no data feature engineering [6]. As a result, the implementation steps are greatly simplified. In this paper, we use convolutional neural networks (CNN) to classify human behavior and compare the results [7].
The application of human behavior recognition is very extensive. In recent years, many countries are facing increasingly severe aging problems, the elderly people have suffered frequent injuries and death. The fall detection system based on human behavior recognition has gradually become a research hotspot for domestic and foreign scholars [8]. In response to this problem, we designed a fall detection system based on two-level decision on the side of the wristband, which can implement functions such as fall detection, fall alarm, and remote monitoring.
The other chapters of this paper are arranged as follows: Section 2 introduces the design and workflow of the bracelet; Section 3 preprocesses the human body activity data collected by the smart bracelet; Section 4 introduces the architecture of CNN classifier and analyzes the results; Section 5 introduces the algorithm of fall detection, and carries on the threshold selection and validity analysis; Section 6 summarizes our research work.
System design of fall detection bracelet
The scheme consists of three parts: a wearable device, a cloud platform, and APP. The overall design of the system is shown in Fig. 1.
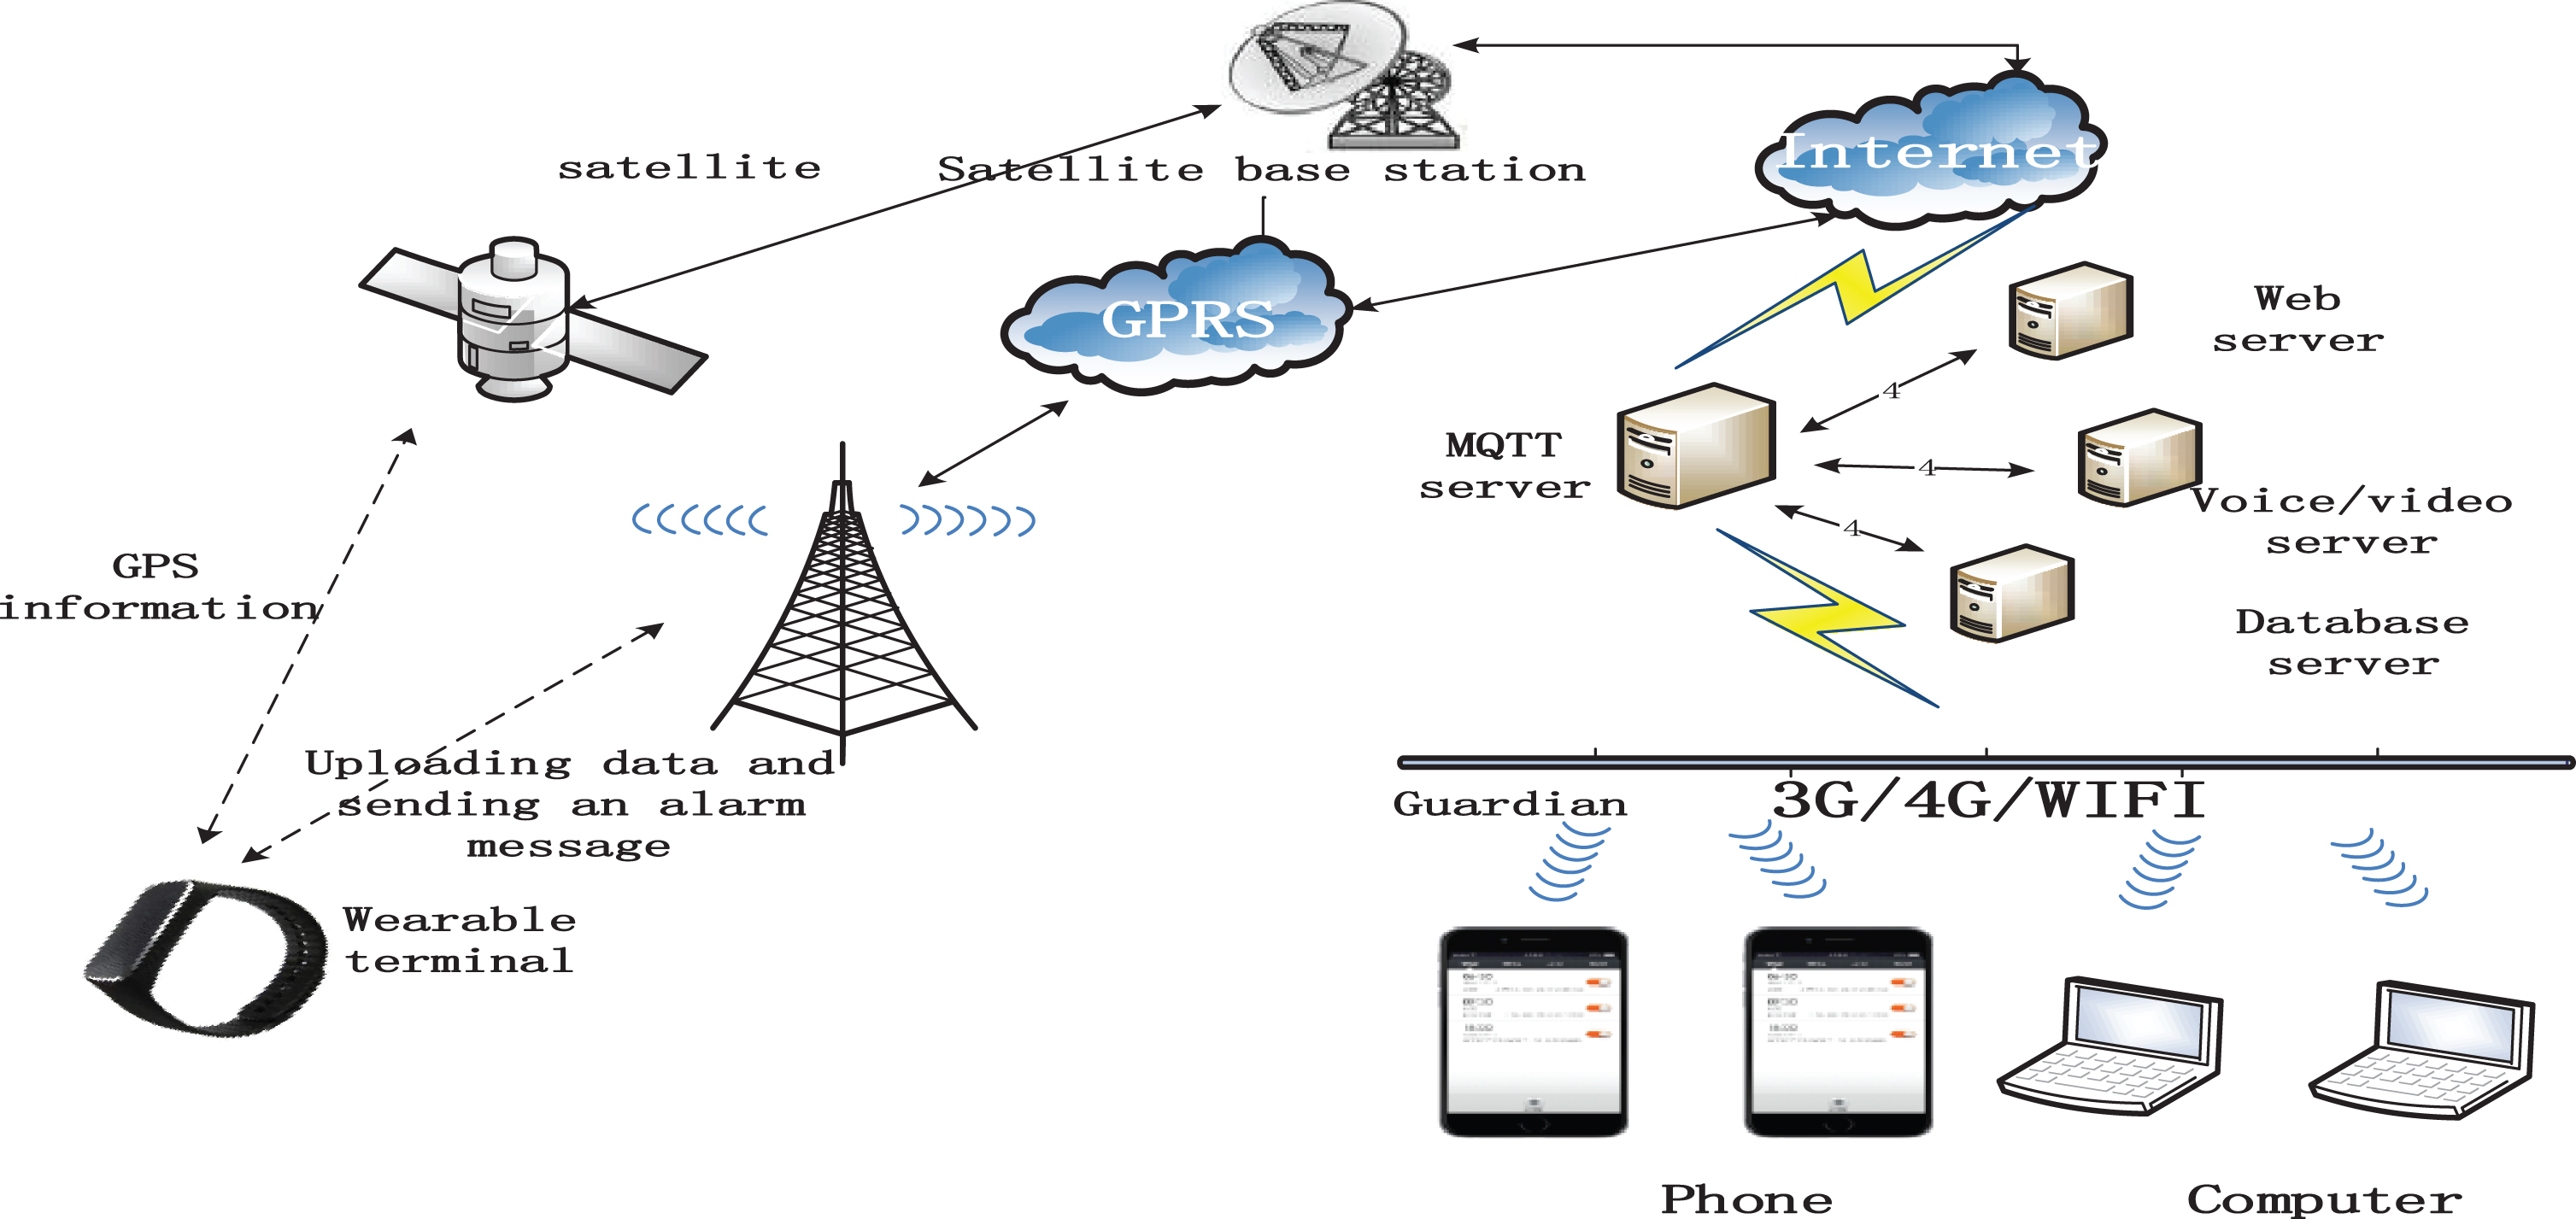
Overall design of the system.
The wearable device collects human posture information, conducts first-level fall detection, and uploads Global Positioning System (GPS) information to a cloud platform periodically. Meanwhile, a guardian can monitor a user’s current location and historical trajectory through the APP. When a fall is detected, the buzzer on the bracelet will alarm immediately and a user’s suspected fall message will be sent to the guardian. At the same time, the CNN model is triggered to record the secondary decision, and the cloud platform accurately determines whether the fall is caused by the CNN model. If it is true, the platform sends a confirmation message to the wearable device and dials the guardian’s phone or emergency center, so that the user will have medical treatment on time [9]. When the wearable device triggers an alarm, the user have a choice to cancel the alarm by pressing the cancellation button.
According to the design of the fall detection bracelet and the hardware function requirements analysis, the smart bracelet can be divided into five modules: MPU6050 six-axis inertial measurement module, STM32 microprocessor module, SIM808 communication positioning module, micro SD card storage module and power module [10].
The MPU6050 six-axis inertial measurement module collects human triaxial acceleration and angular velocity data. The SIM808 communication positioning module collects GPS human body positioning information. The collected data transmit to STM32 microprocessor module through I2 C communication mode and serial communication mode respectively. The microprocessor module realizes human posture signals pre-processing, first-level threshold fall judgment, data extraction, and so forth. The SD card data storage module is responsible for storing the collecting data. The lithium battery is selected to supply power to the hardware end of the system. The overall hardware design block diagram is shown in Fig. 2.
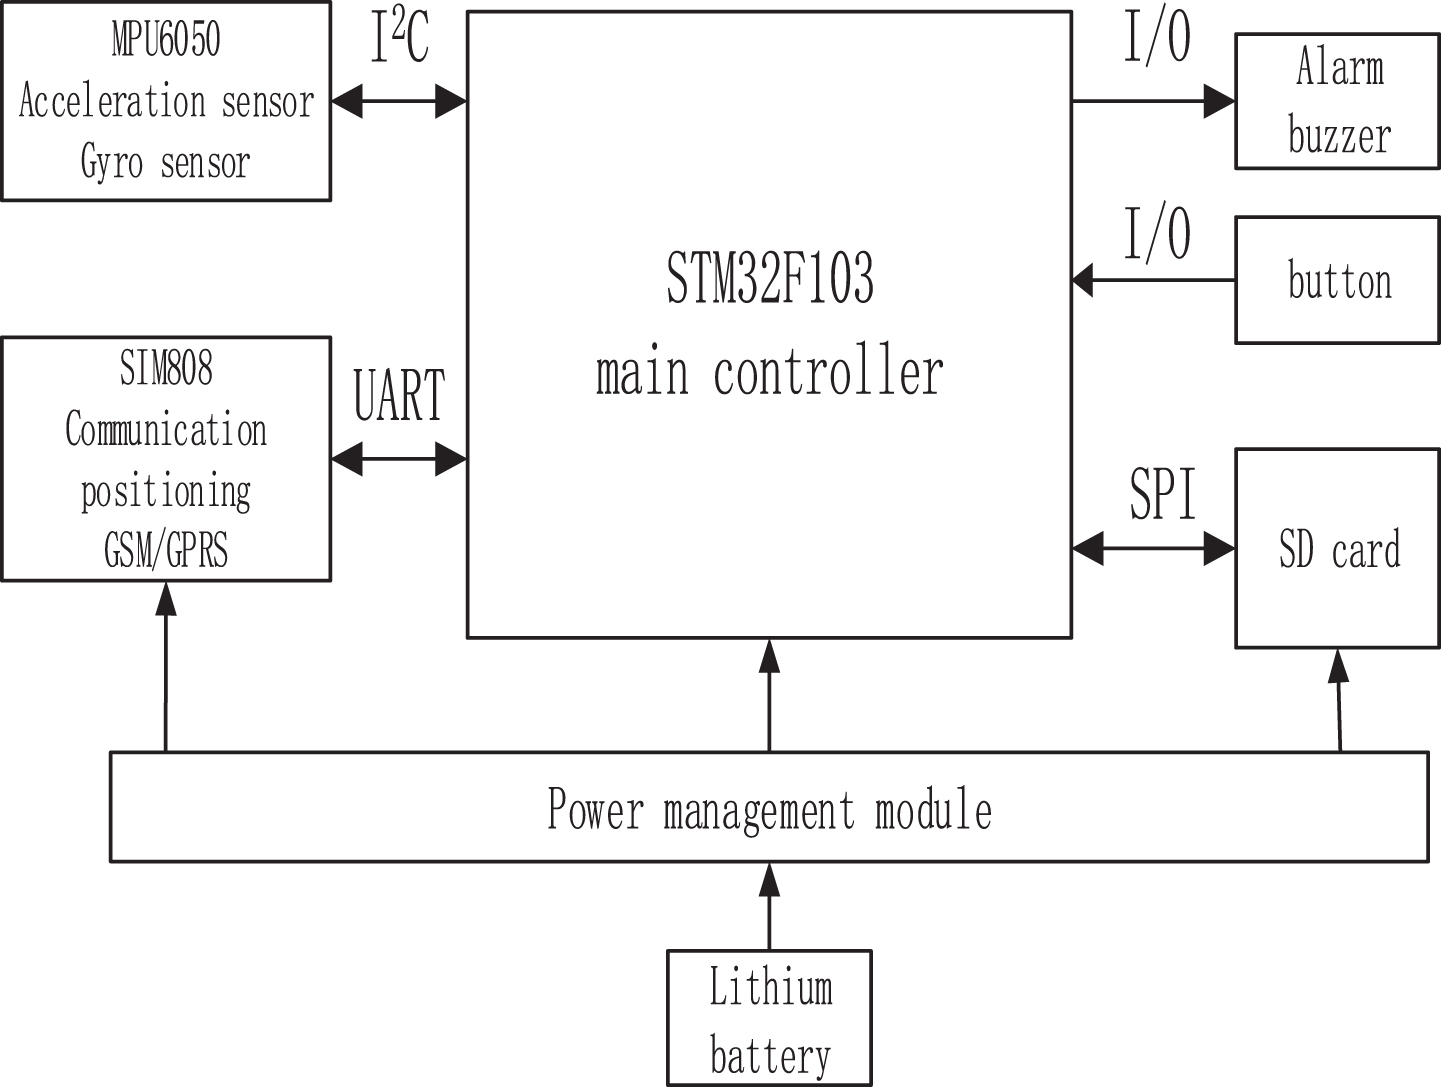
Overall hardware design.
When a suspected fall occurs, the buzzer on the bracelet will alarm and sound loudly to draw the attention of the surrounding people and make a local call for help. We designed two buttons. One is active button to initiate a call to the guardian. Another is cancelling button, if the fall is a misjudgment.
The problem of human behavior recognition is based on the deep learning method. The time series data collected by the built-in sensors of the bracelet are used for noise processing, data segmentation and data marking. The processed data are input into the CNN network for training, and then we obtained the training model [11].
The traditional machine learning methods mainly includes data collection and labeling, data preprocessing, data segmentation, feature extraction and selection, model training and testing. The deep learning-based method can automatically learn feature representations from data through a multi-layer network, and perform end-to-end training [12]. It includes: sensor data acquisition, data preprocessing, time series data segmentation, model training and classification.
Data collection
Based on the human behavior recognition of the bracelet, we must consider the sampling rate. If the sampling rate is too large, the data volume will be too large, which will increase the calculation difficult and timeliness. If the sampling rate is too small, the motion information in the original data will be lost, which will lead to the decrease of the recognition rate in the subsequent CNN network recognition [13]. In order to ensure that the collected human posture data signal can be restored to the original signal to the greatest extent, and to avoid the occurrence of spectrum aliasing, the sampling frequency of 20 Hz is used to sample the three-axis acceleration and the three-axis angular velocity when the MPU6050 six-axis inertial measurement module is used for acquisition, which can not only ensure the real-time and integrity of the fall data, but also reduce the complexity of fall data preprocessing.
The behavioral data for establishing the human behavior recognition model was performed by eight subjects wearing the smart bracelet, and six standard behaviors are carried out, As follows: Walking Going up the stairs Going down the stairs Falling Standing Standing up
The collected data are accelerometer data and gyroscope data from the x, y, and z axis recorded by MPU6050 sensor. The accelerometer data include triaxial acceleration and linear acceleration data, the linear acceleration data were separated by the mathematical method. So there are a total of 9 variables with sampling frequency of 20 Hz (i.e. 20 data points per second) [14]. Each subject performed six activities in turn, placing the bracelet on the left and right sides respectively.
Data preprocessing
The collected data from the MPU6050 sensor are stored in the SD card through the SPI interface. After reading the data, we need to carry out some preprocessing steps, which mainly include data filtering and data segmentation.
Data filtering
When the MPU6050 module collects three-axis acceleration data and three-axis angular velocity data, there will always be some noise due to external environmental factors or its own factors. It is necessary to minimize the noise before we process the original data. Body gravity acceleration, jitter acceleration and motion acceleration superimposed to form real acceleration data, noise must be removed from the raw data. The three-axis acceleration data were pre-processed by its own low-pass filter. At the same time, the low-pass Butterworth filter with a cutoff frequency of 0.3 Hz is used to separate the gravity acceleration and body acceleration. In this paper, Kalman filter is designed to preprocess the three-axis angular velocity data because of its high dynamic characteristics [15].
Kalman filtering can estimate the random signal and obtain the relative optimal estimate of the current time, which is also called the optimal estimation theory. In essence, it is a recursive algorithm to describe linear, discrete and finite dimensional systems with state space method. The Kalman filter equation consists of followings.
Pre-estimate the optimal value equation:
X (k|k - 1) is the estimated value of k time calculated at time (k-1), X (k - 1|k - 1) is the optimal value of k-1 time, A (k, k - 1) is the state transition matrix of the system, B (K) is the control weight matrix, u (k) is the control of k time signal.
Pre-estimate the optimal value covariance:
P (k|k - 1) and P (k - 1|k - 1) are both covariance, the former corresponds to the pre-estimation of the optimal value X (k|k - 1), the latter corresponds to X (k - 1|k - 1), U (k) is the dynamic noise at time k, Q (k) is the covariance of the systematic process at time k.
Calculate the Kalman gain matrix:
K (k) is the Kalman gain value, R (k) is the degree of trust in the measurement process during the measurement of k time, R (k) is the observed noise at time k, H (k) is the observation matrix.
Update estimate:
Z (k) is the measured value at time k, and I is the unit matrix.
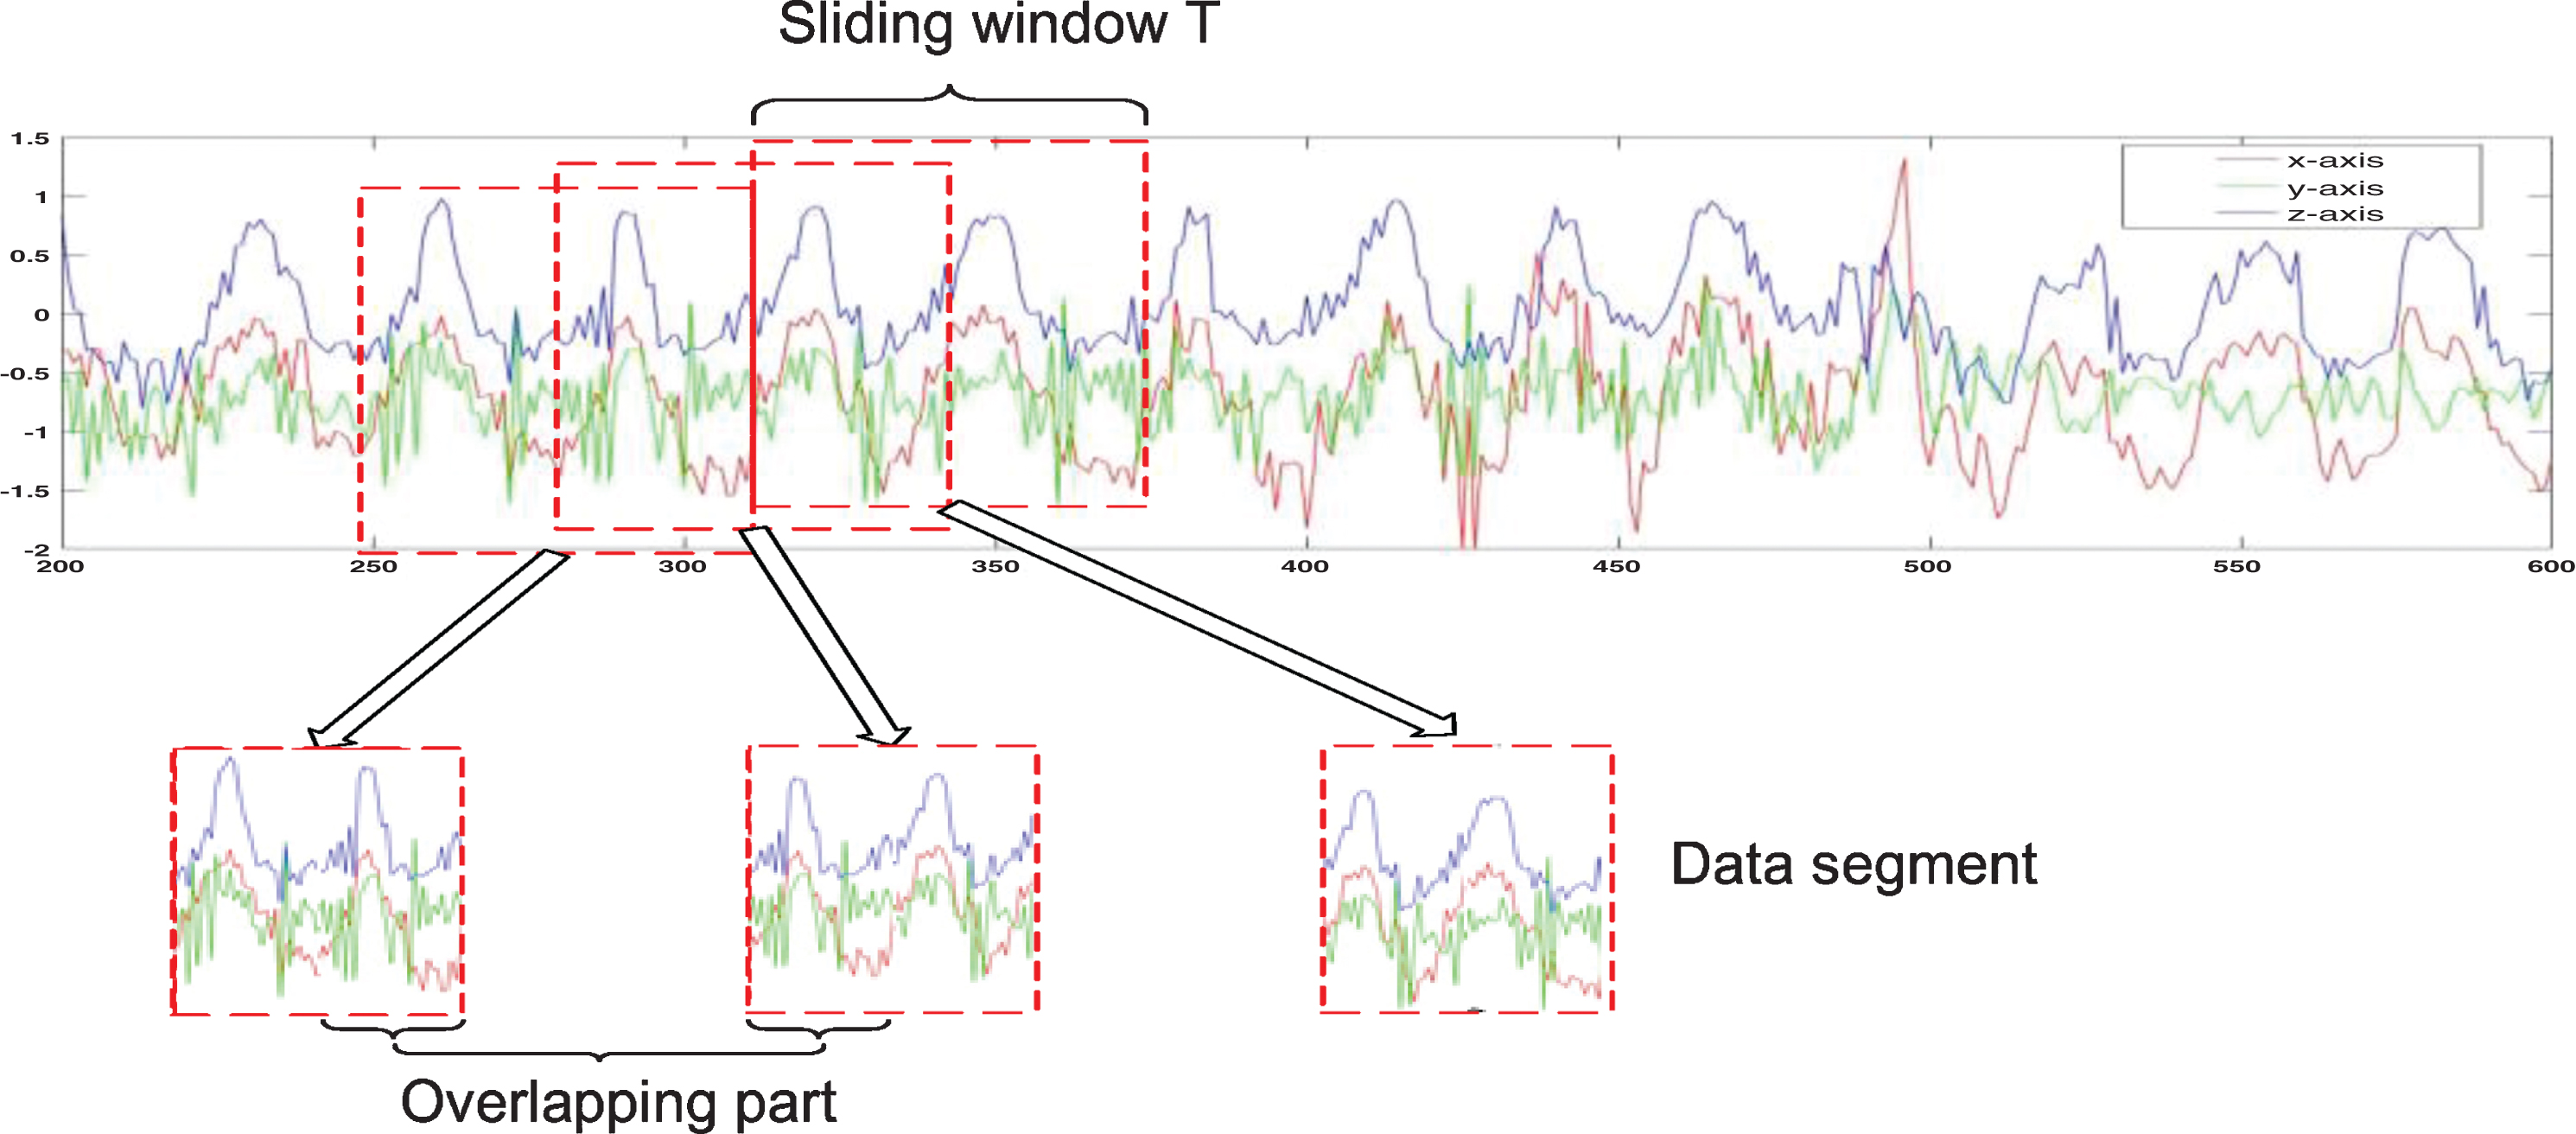
Data segmentation is one of the necessary steps to obtain the time domain characteristics of human behavior recognition. The filtered data are continuous time series data, and the duration is long. The model can’t process the long sequence data at one time. We need to segment the data, it helps to obtain the more obvious meaning of the data, and it is more conducive to the data calculation and storage. We use the sliding window method for data segmentation.
Sliding window method is the most widely used segmentation technology in human behavior recognition. The goal of sliding window method is to find a series of segmentation points to divide the whole range of data into a certain number of small intervals. Long time series data need to be divided into fixed size window data. There can be overlap between adjacent windows.
Six human activities can be divided into periodic activities (walking, going upstairs, going downstairs), static activities (stationary standing), and non-cyclical activities (standing, falling). The sliding window method has proven to be very effective for identifying periodic and static activities. For non-periodic activities, we need to consider the two main parameters of window length and window overlap: Window length: To find the appropriate window width, that is, to determine the number of discrete intervals, the selection of the window width needs to be specifically analyzed. If the width is too large, it will contain multiple actions, but the window has only one label. In a window length, at least Contains a complete human behavioral implementation cycle, according to the study of the rise and fall behavior of the implementation cycle of about 0.5s– 2.8 s, Secondly, the number of data contained in each group of windows should be set to the nth power of 2, which is convenient for FFT. Since the sampling frequency of our sensor is 20 Hz, we use a sliding window size of 3.2 s in this paper, and each window will contain 64 sampling values. Window overlap: In addition to considering the length of the window, it is also necessary to consider the degree of overlap between two adjacent windows, which can reduce the interference of the transition behavior on the data. For aperiodic activities, the collected data are a series of different sizes of intermittent time series, which may contain a small part of transition behavior. Transition behavior refers to the transition state which is different from any behavior during the transition from one behavior to another. In order to reduce the interference of transition behavior on data segmentation as much as possible, we will remove the part of the collected interval time series that exceeds the window length, that is, remove the series whose length exceeds 3.2 s, and set the overlapping degree of the window to 50%.
Through the above operation, we split the data into fixed windows of 64 data points (3.2 seconds) with 50% overlap between the windows. The separation process is shown in Fig. 3.
Data segmentation.
There are three main types of data after preprocessing: acceleration data, gyroscope data and linear acceleration data. Each class has x, y, z, and 3 coordinate dimensions, which means that there are 9 variables in a time point. In addition, each set of data is divided into overlapping windows of 3.2 seconds (64 time points). Thus each line has 64*9 (576) features. We put corresponding activity labels on each set of data, and divide the processed data into training data sets and test data sets. The training data set has 2029 training data, and the test data set has 606 test data. The training data set is used to extract features from time series and map internal features to different activity types to establish a CNN classification model. The test data set is used to test the generalization ability of the model. The entire experimental process is shown in Fig. 4.
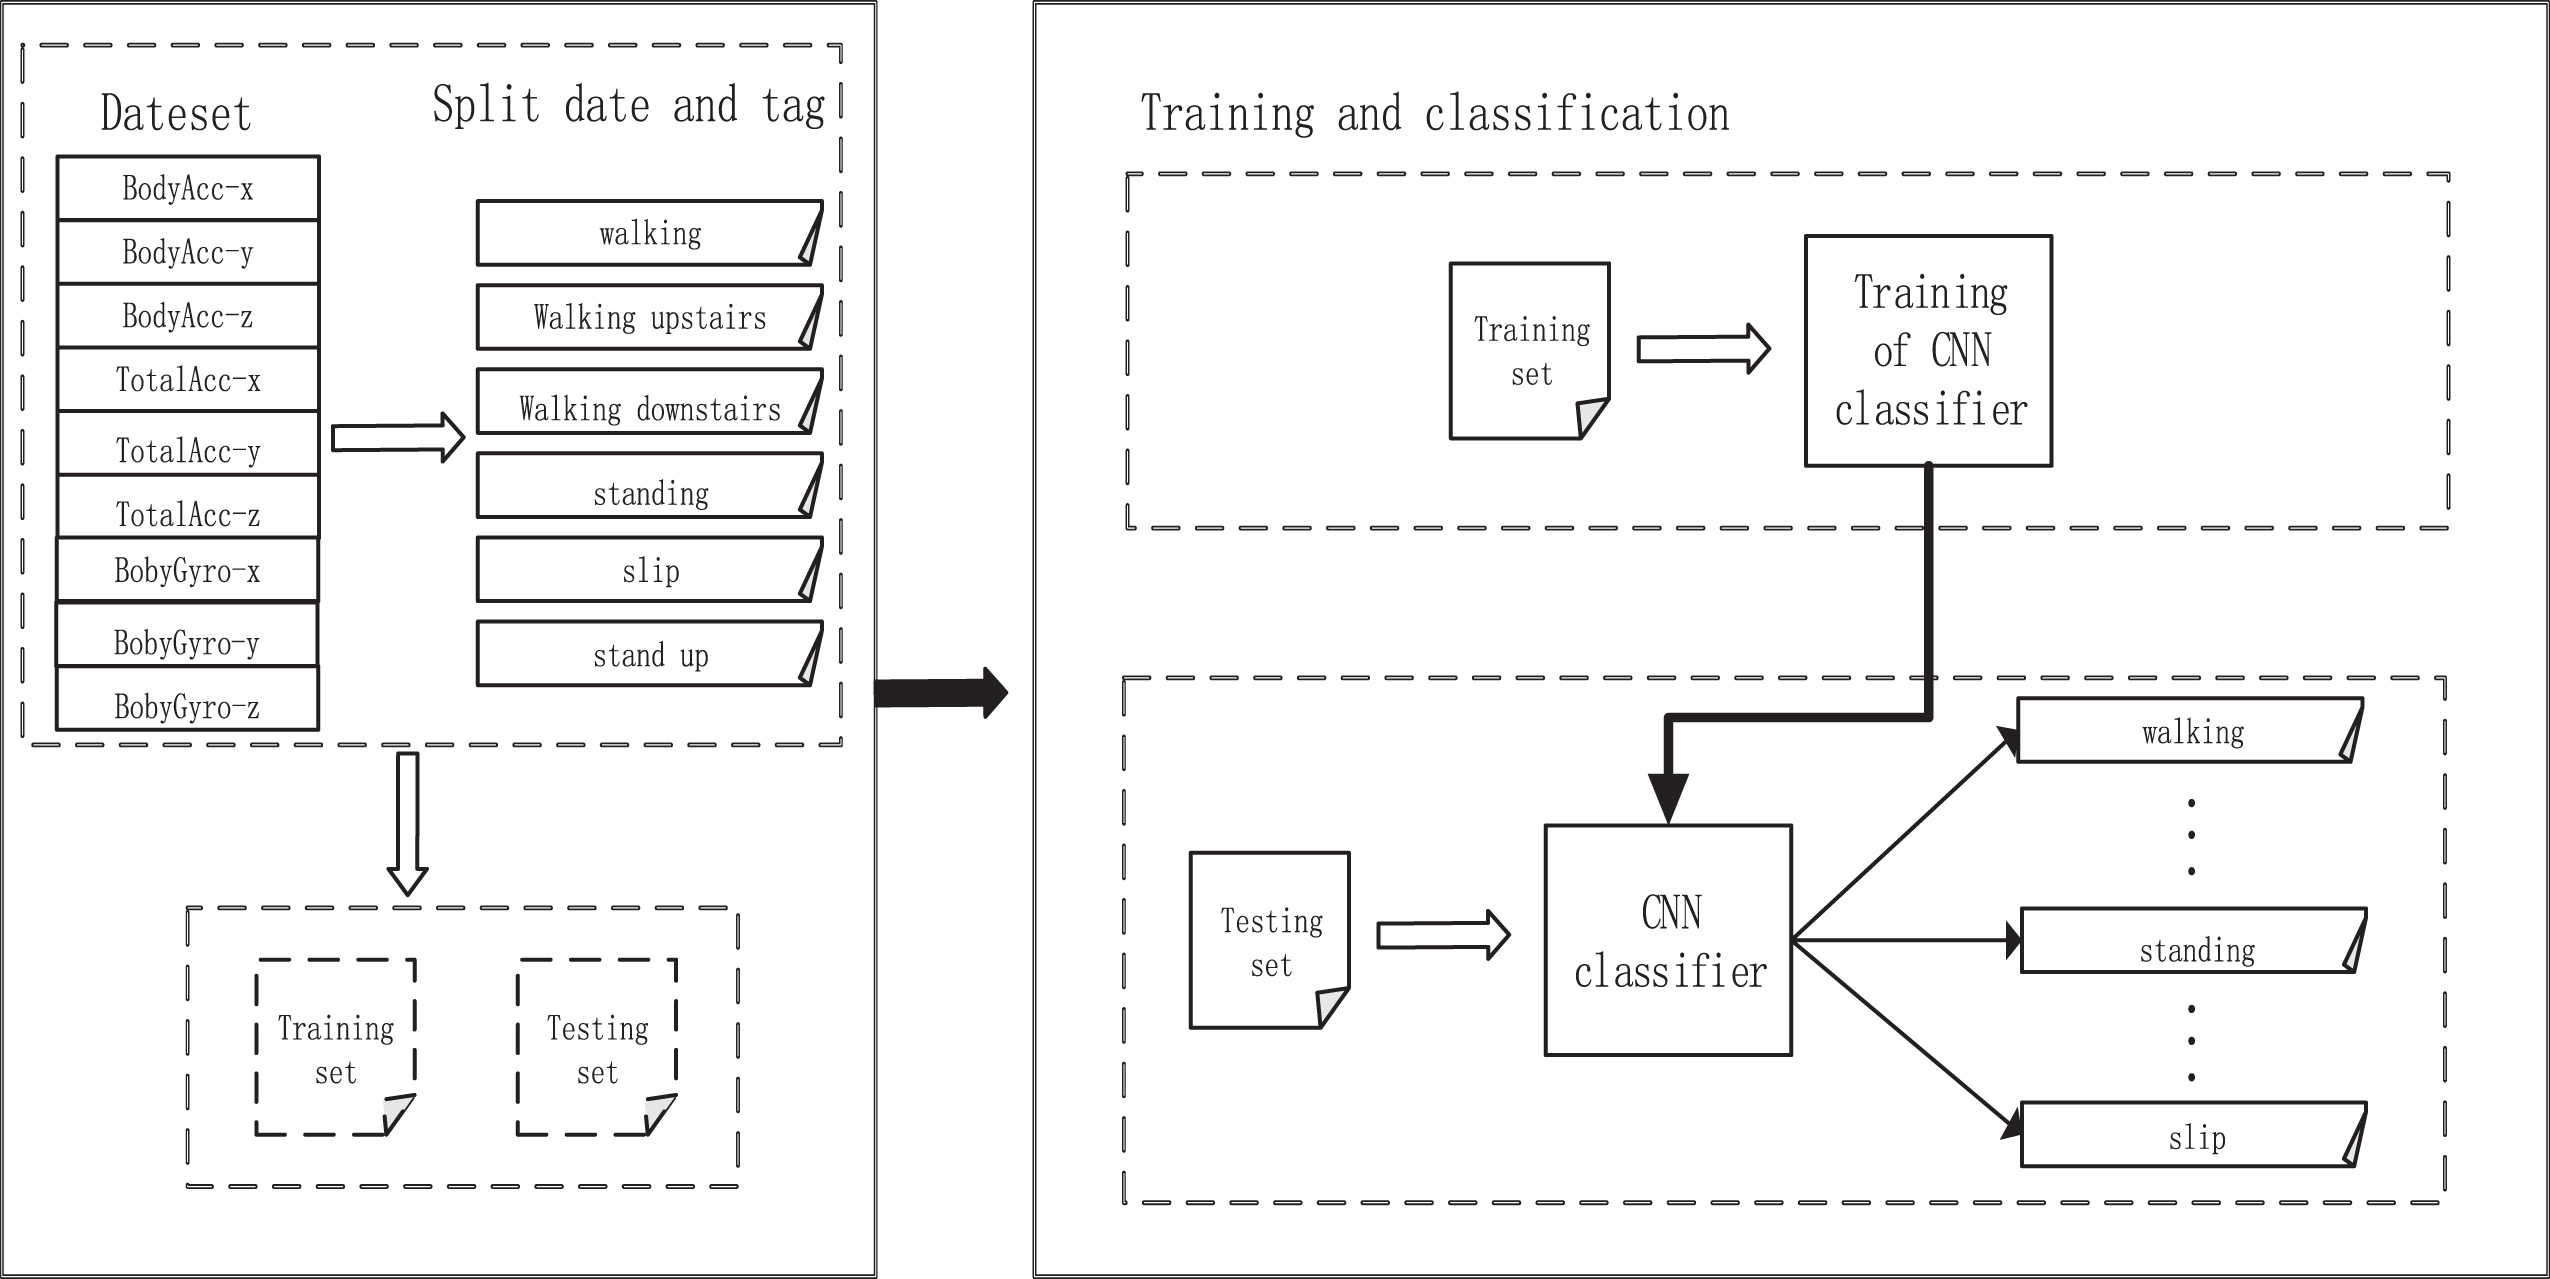
Experimental process.
The architecture of the proposed CNN classifier for human behavior recognition is illustrated in Fig. 5. The proposed model has two conventional layers and one fully-connected layer. Each convolutional layer contains feature filters of size 1×2 to optimise the values during the training phase. Each convolutional layer is followed by a max-pooling layer that has a window size of 1×2 or 1×4 to ensure the outputs from each conventional layer are smaller than the inputs. Rectified Linear Unit (ReLU) is added after each convolutional to operate as an activation function. The fully-connected layer used in this proposed architecture is a traditional Multi-Layer Perceptron (MLP) that operates a Softmax activation function for the output layer. By using the Softmax activation function for the output layer, the CNN classifier model will be able to classify the input features into various classes (activities) based on the learned relations during the training stage.
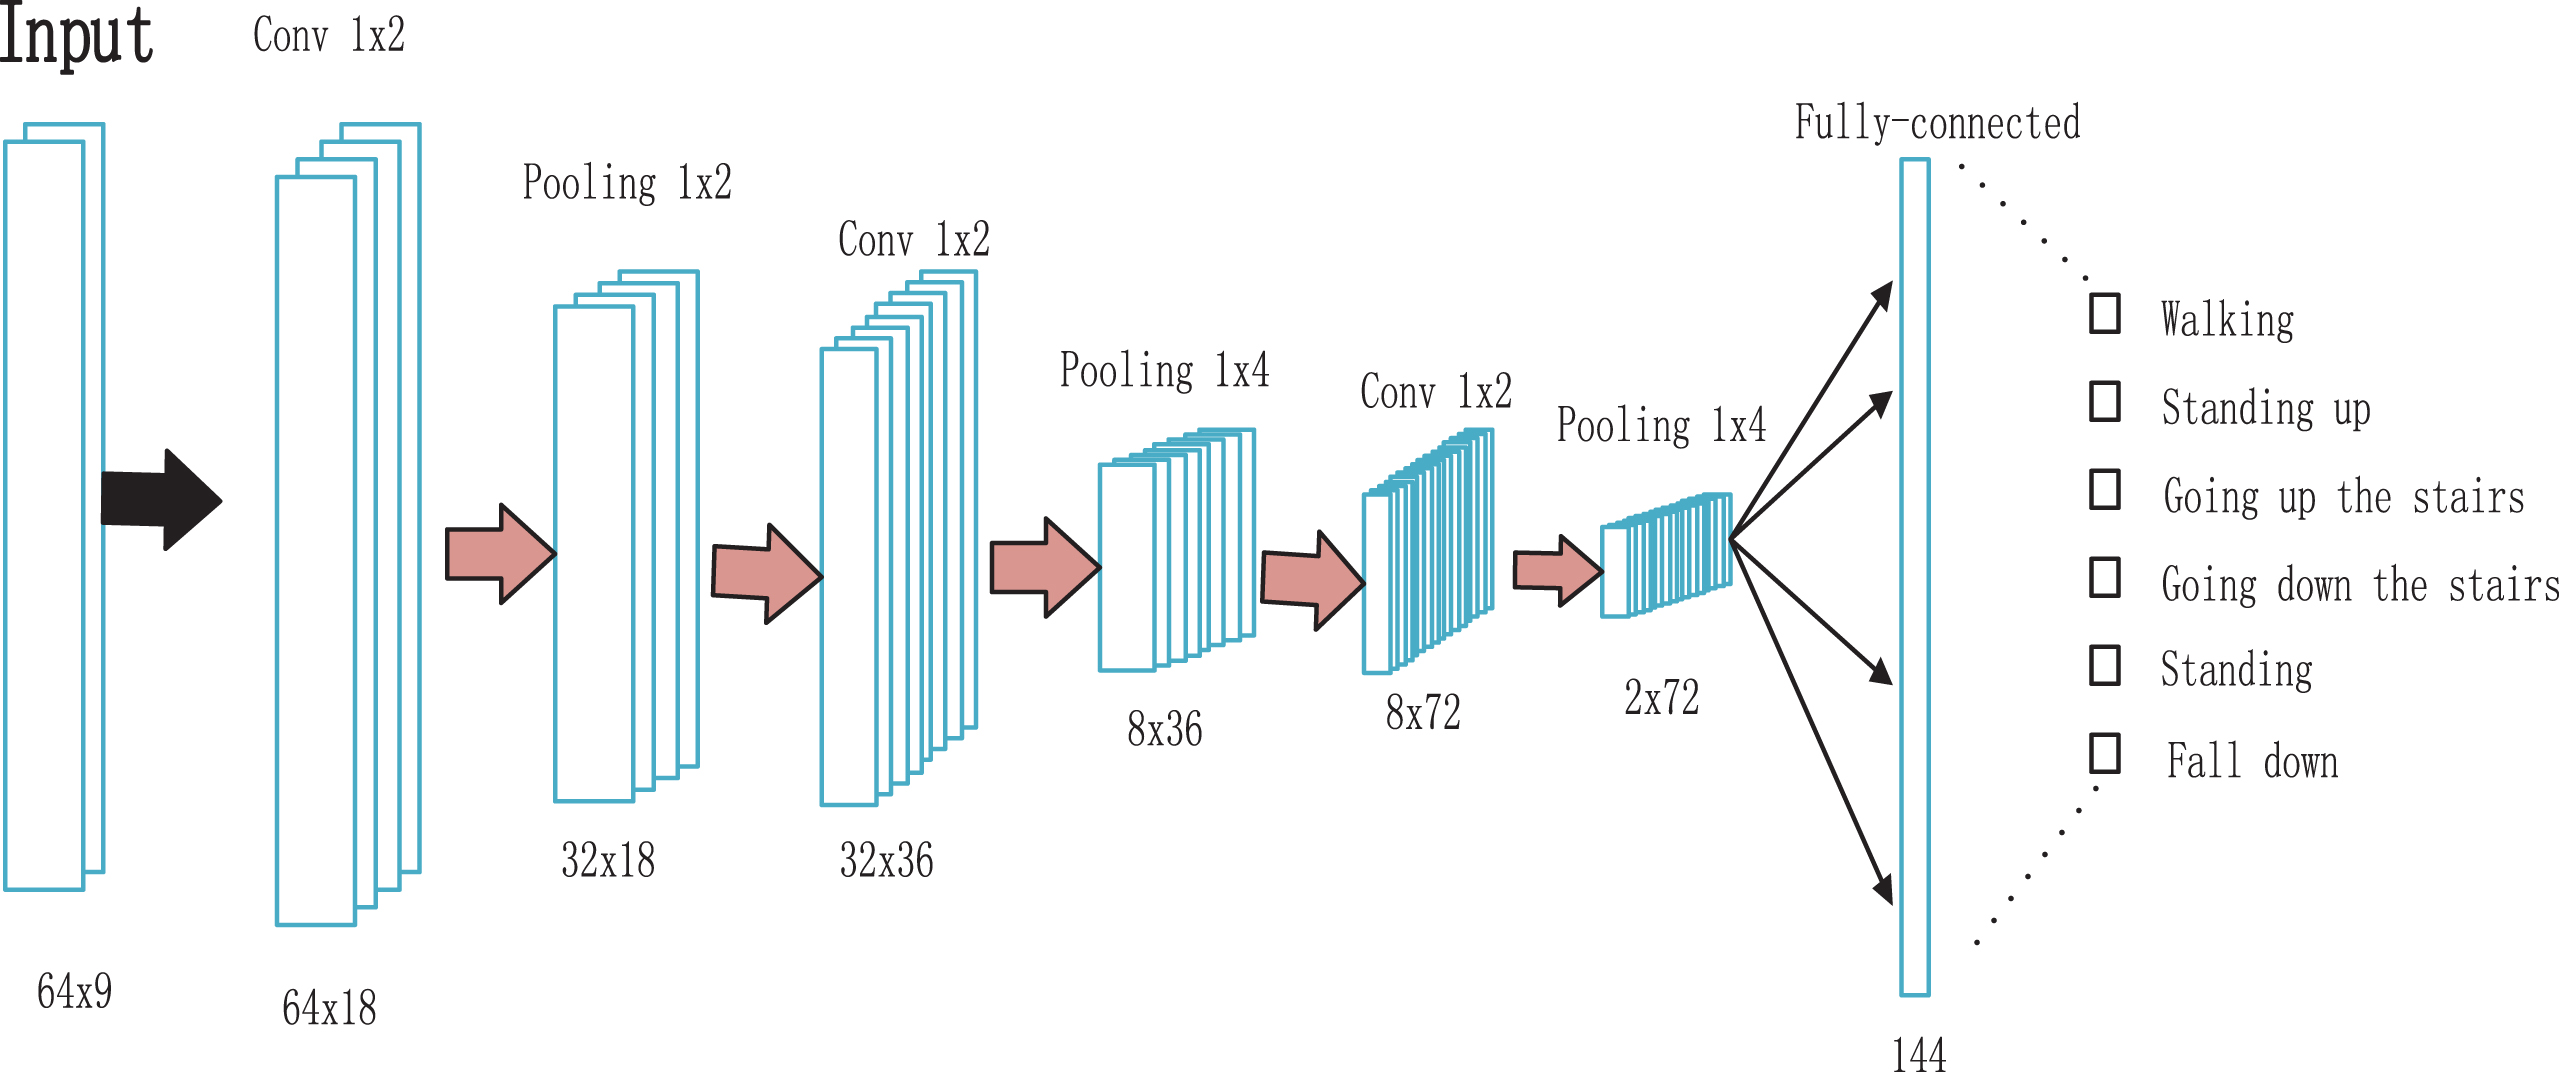
CNN model.
The experimental environment of this paper is centos7 system, the model of the processor is Inter (R) Xeon (R) CPU E5-2670 V3 @ 2.30 GHZ X 12, the model of the graphics card is NVIDIA GeForce GTX 1080 Ti, and the experimental framework is Tensorflow1.2.0 open source framework.
The learning rate is 0.001, and the parameters are optimized using a small batch gradient descent algorithm and a momentum optimization algorithm, where the mini-batch size is 200 and the iterative epoch number is 300. Accuracy and loss values during the training are shown in Figs. 6 and 7.
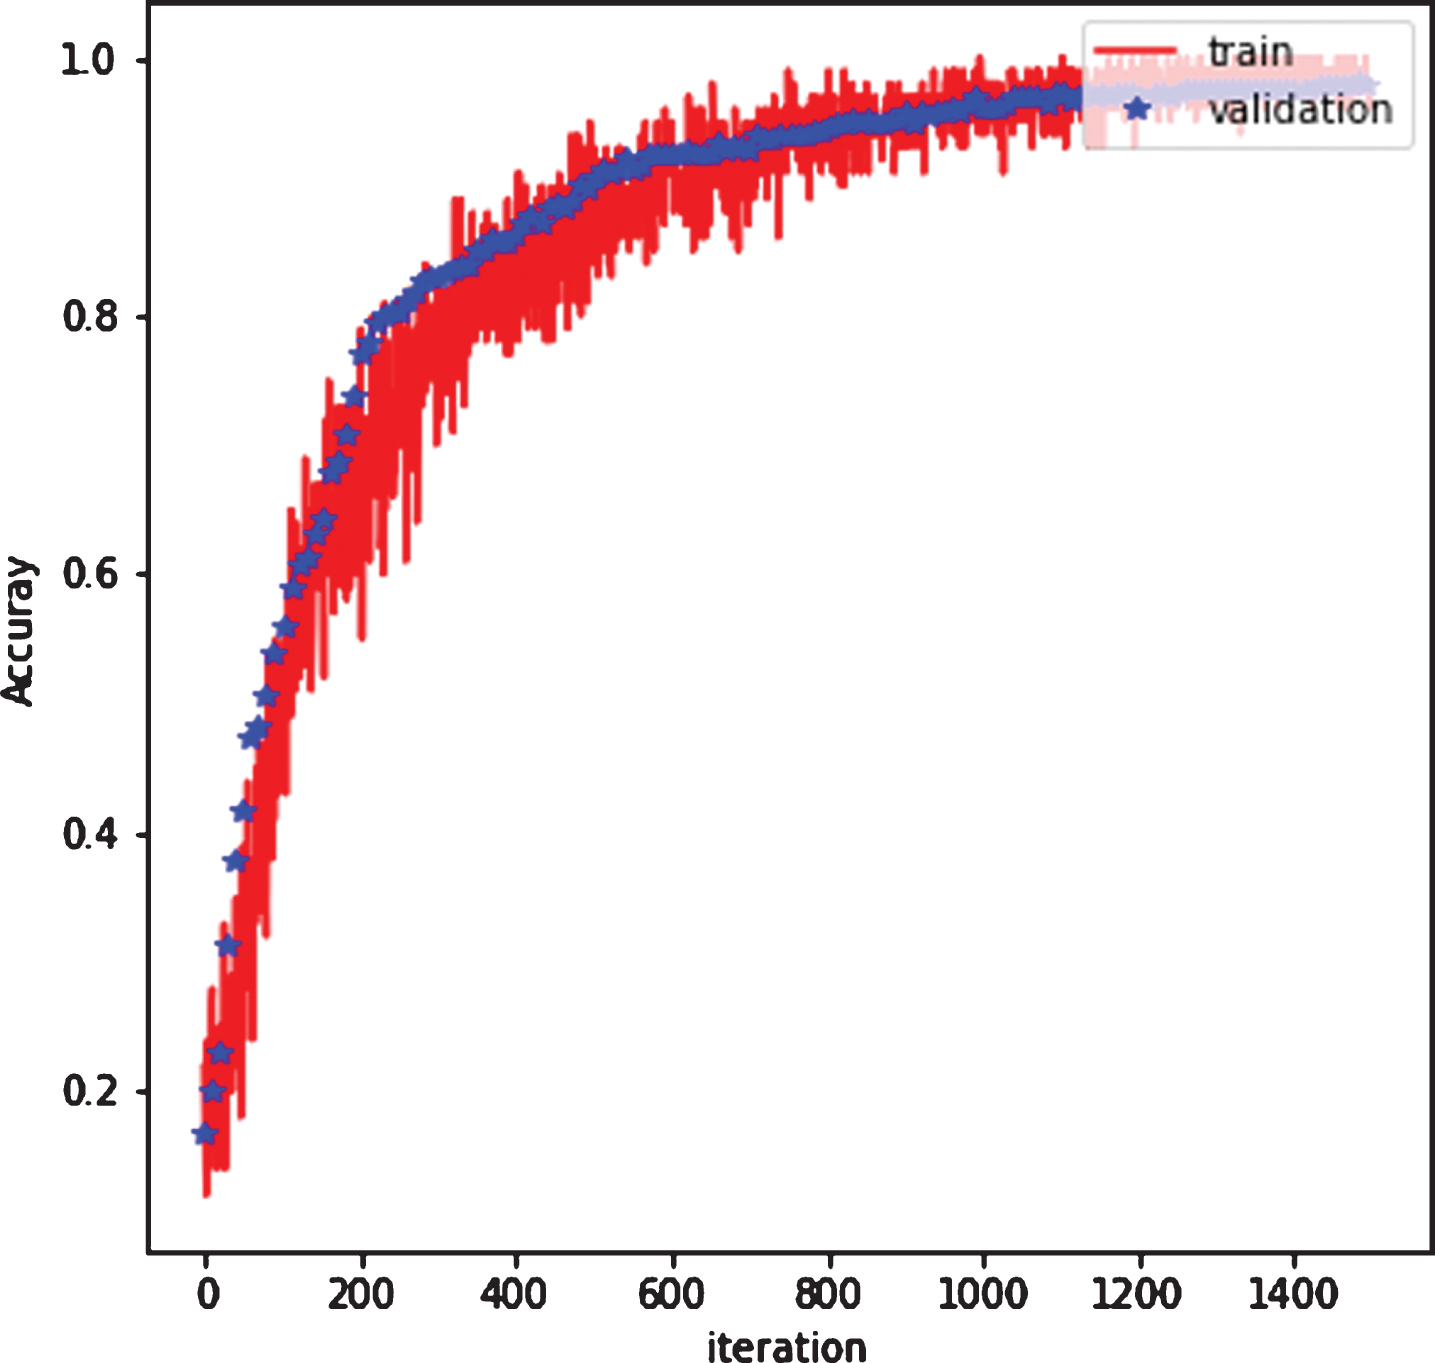
Training accuracy.
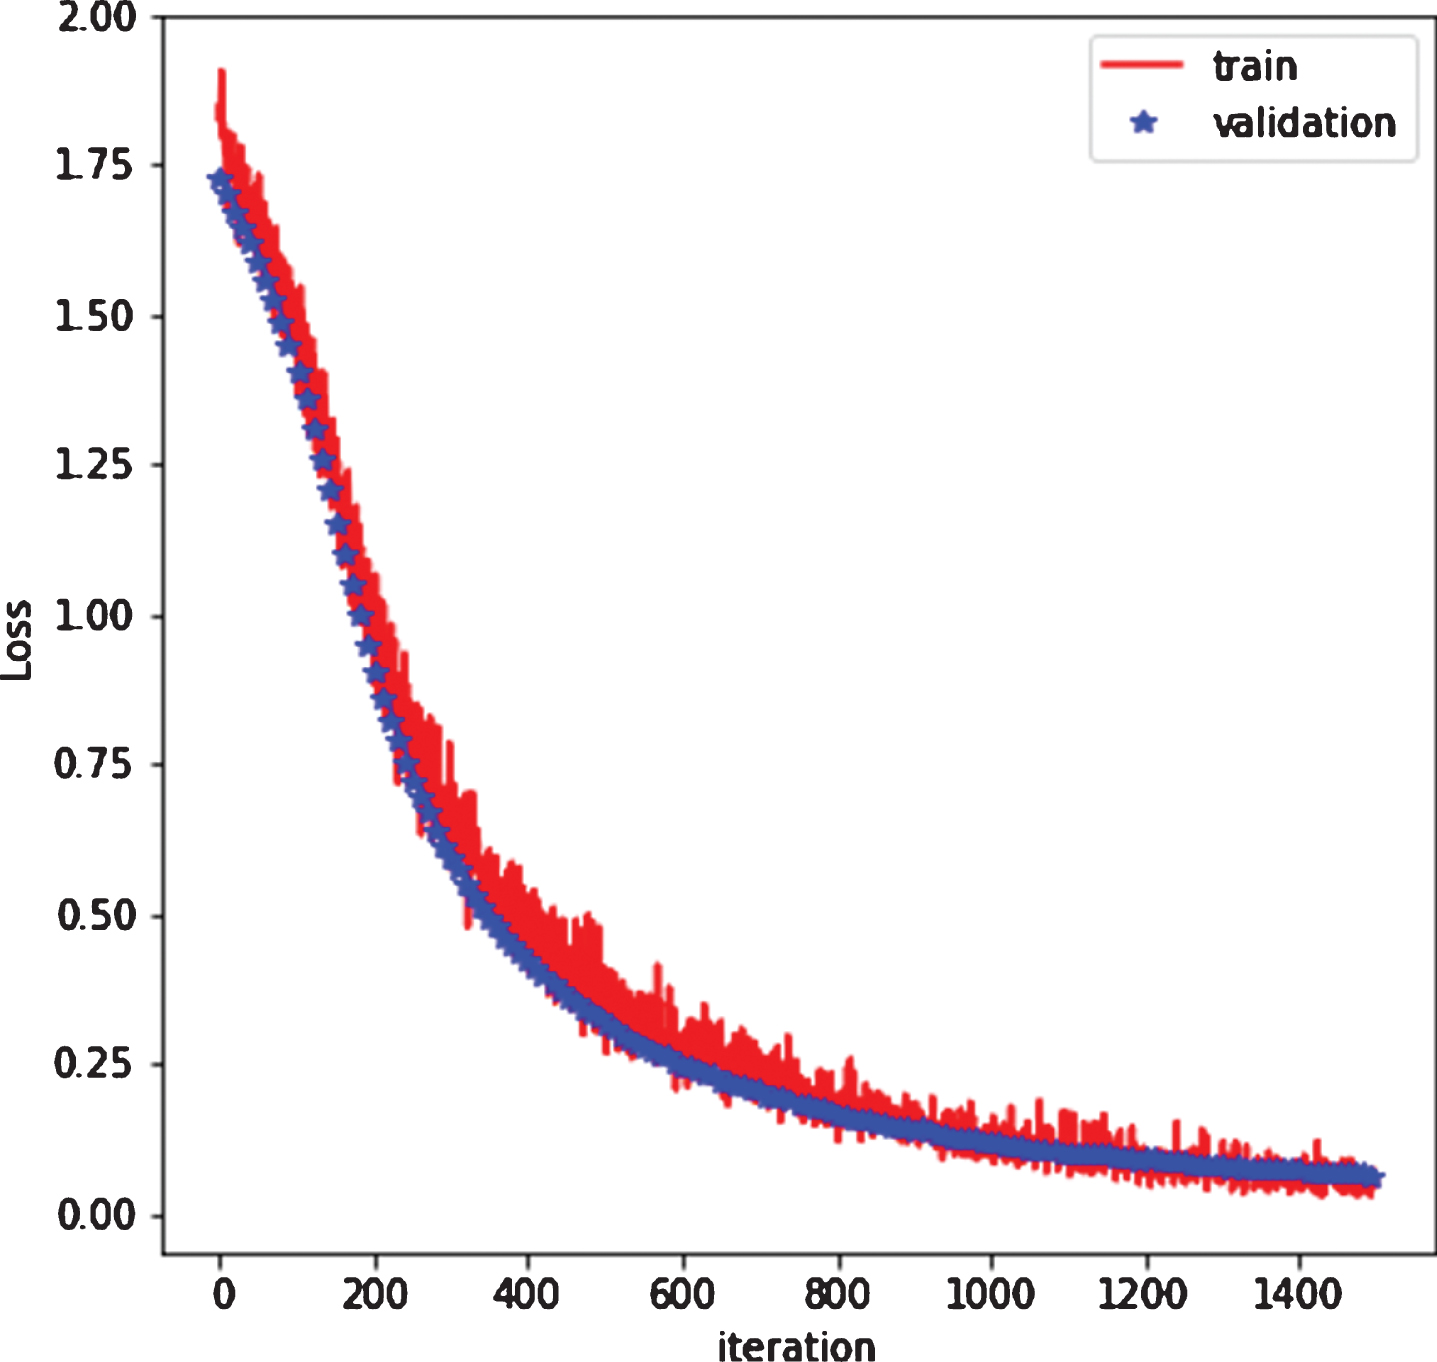
Training loss.
After the model is trained, the generalization ability of the model is verified by the test set. This paper uses the confusion matrix to analyze the recognition effect of each class. The confusion matrix is shown in Fig. 8. The accuracy of the model in the whole test set is 95.16%, and the recognition rate of the static standing is the highest, which is 100%. Because the posture of the human body changes very little when standing still, it is obviously different from other activities; the recognition rate of the fall behavior is 94%. Some behaviors are identified as going down the stairs because the physical characteristics of the behavior are very similar to the fall behavior. In order to improve the recognition rate of fall behavior, we need to analyze the physical characteristics of each behavior.
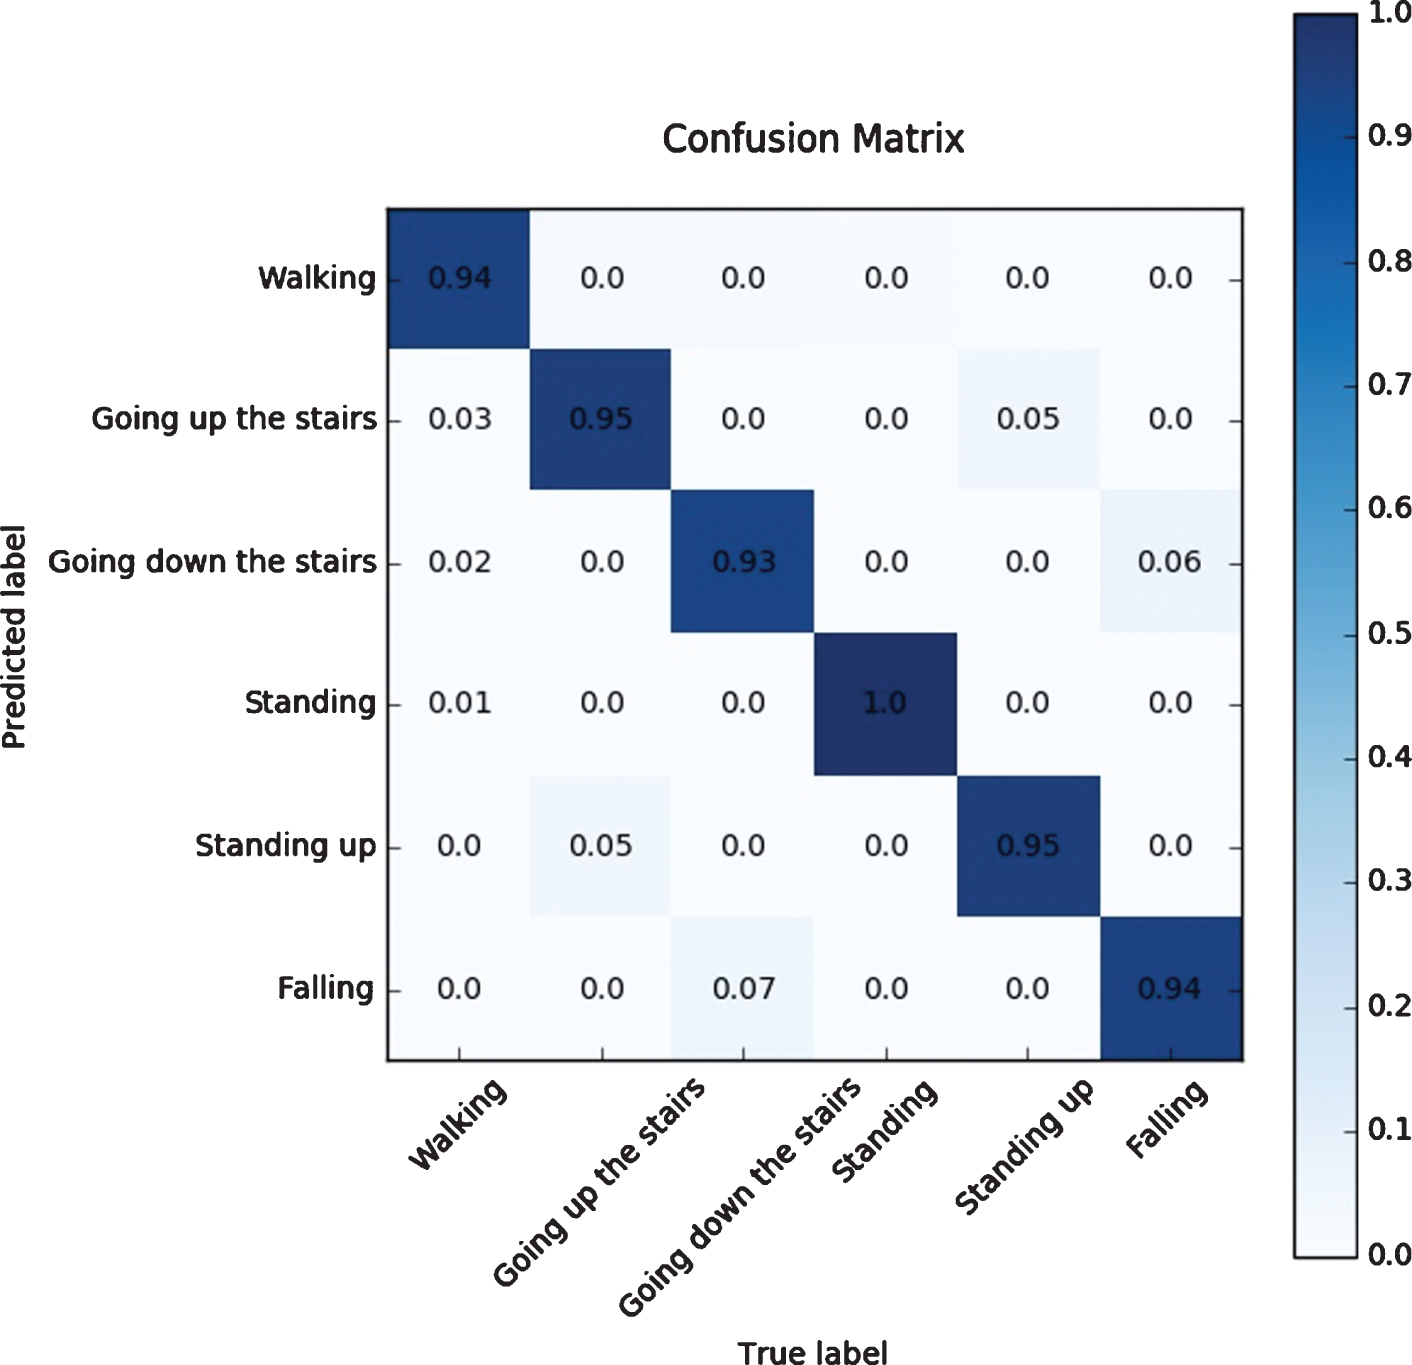
Confusion matrix.
Due to human activities, fall behavior can cause harm to the human body. Especially for the elderly, the elderly fall to death and the incident is frequent [16]. In this paper, in addition to the identification of human activities, we designed an alarm system to detection the fall behavior. We use a two-level threshold decision in the determination of the dangerous behavior. The first threshold is based on the combined acceleration data to determine whether a suspected fall occurs. If so, extract the data of 1.6 s before and after the combined acceleration peak to input the trained CNN judgment model for accurate judgment. The wristband uploads GPS positioning information to the cloud platform at regular intervals during the user’s daily activities. The guardian can view the user’s real-time location information and historical activity trajectory in the corresponding page of the WeChat public account; when a suspected fall event occurs (the combined acceleration exceeds the level-1 detection threshold), the bracelet will send the suspected fall alarm information to the guardian by SIM808. At the same time, the second level CNN detection judgment is triggered. The bracelet uploads the sensor data collected in a period of time before and after the time point to the cloud platform, and the platform uses the trained fall detection model for identification [17]. When the fall behavior is determined again, the platform sends an acknowledgement alarm command to the wristband, and the wristband sends a confirmation of the fall information and calls the guardian’s phone. The specific flow chart of the algorithm is shown in Fig. 9.
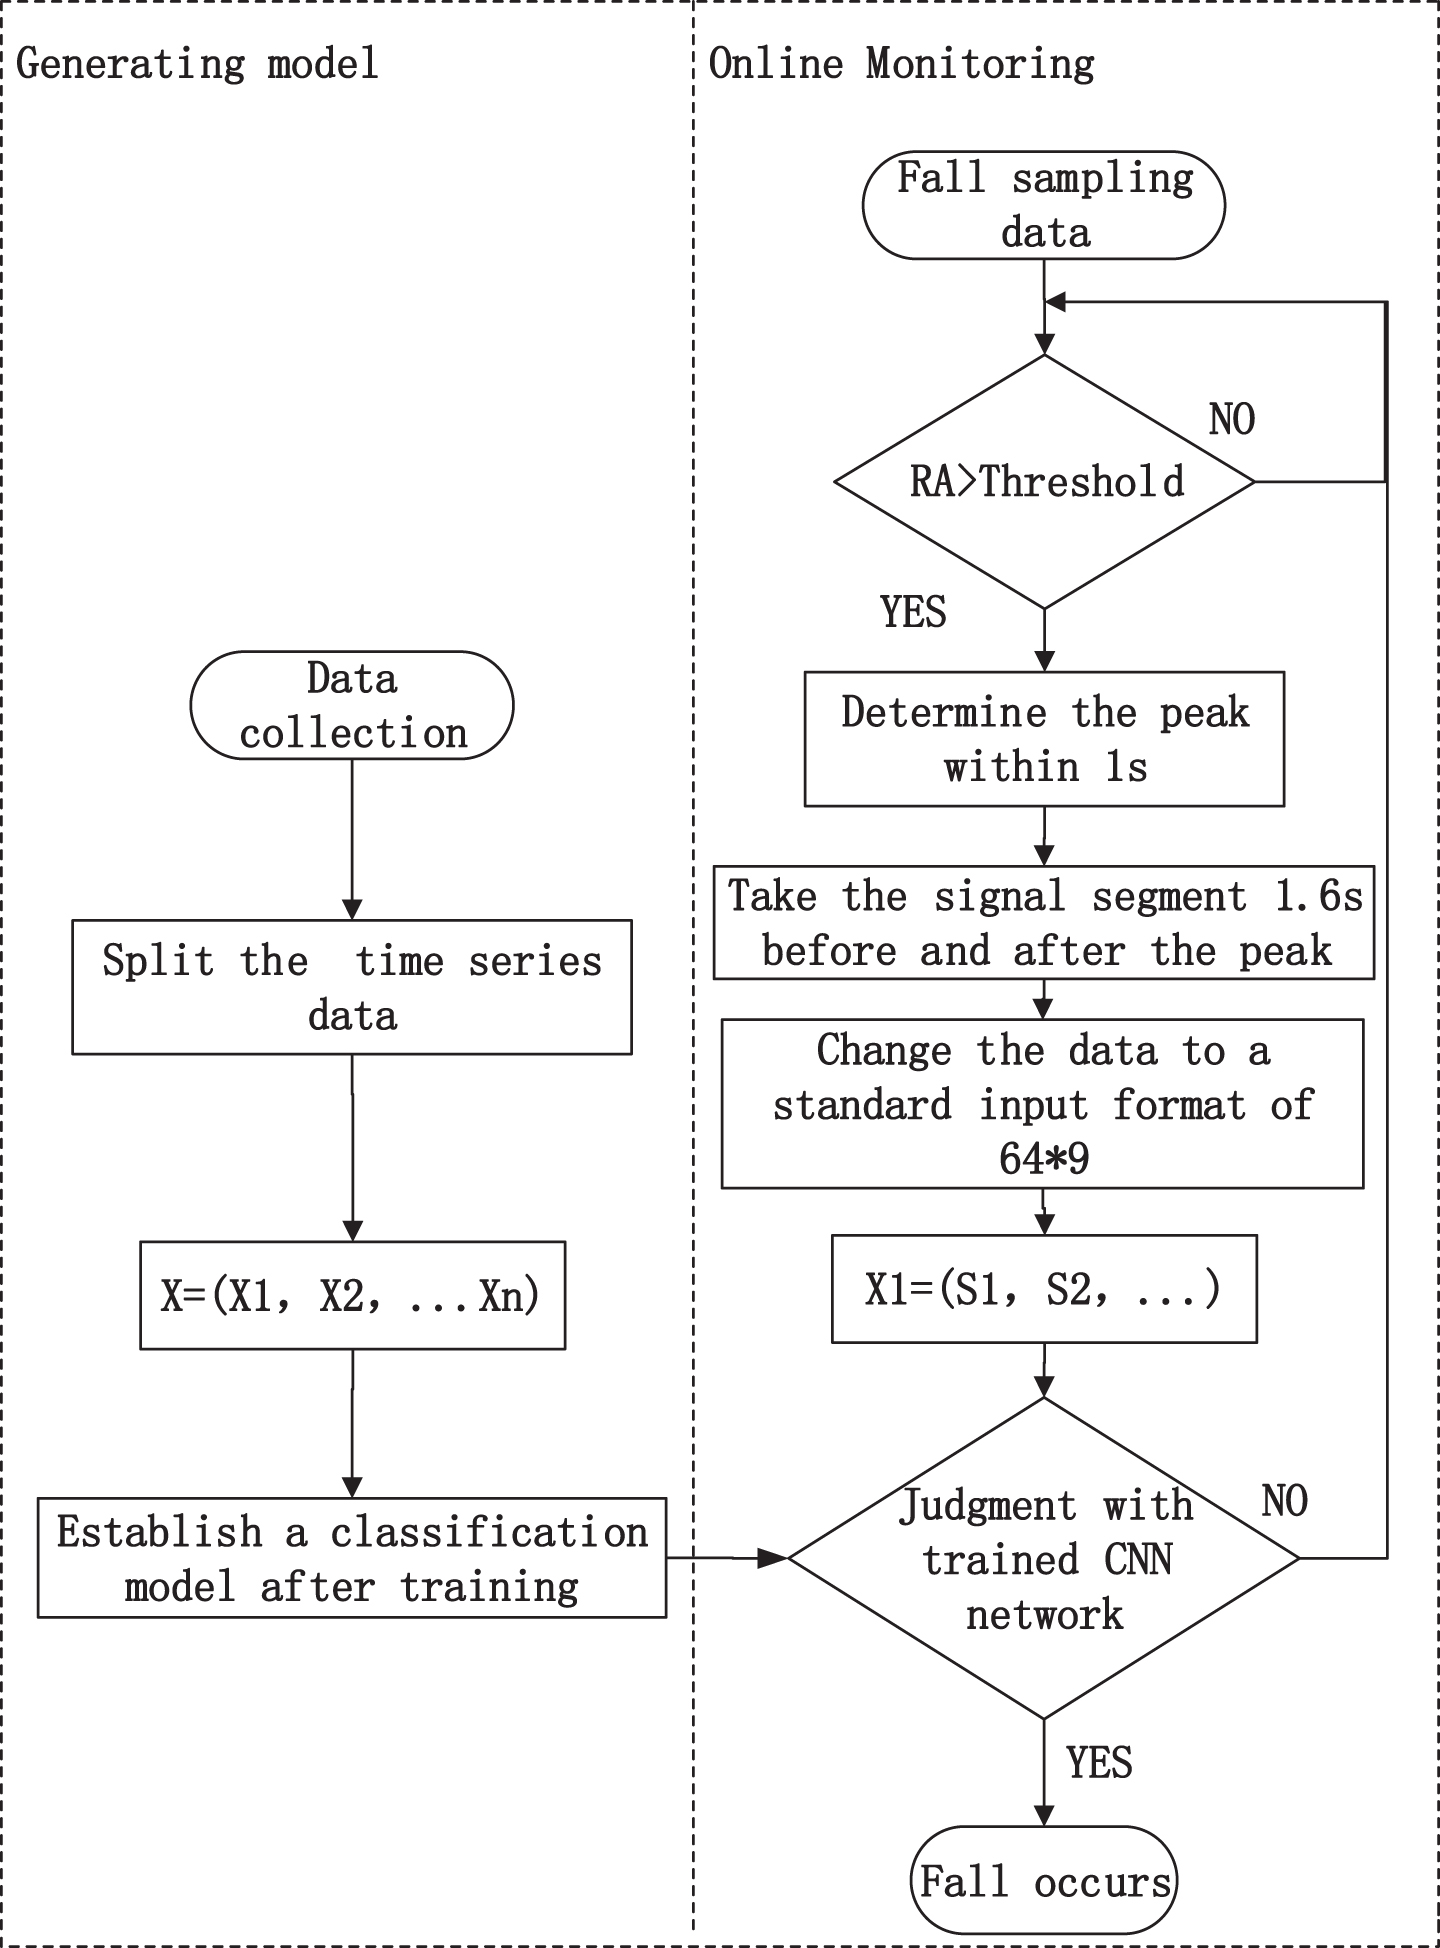
Flow chart of the fall detection algorithm.
Due to the complex structure of the human body, there are different behavior patterns when performing different movements in motion. In the six standard activities we collect, we can divide it into daily activity behavior and fall behavior. Daily behavior includes static standing, standing up, walking, going up the stairs and going down the stairs. The fall behavior mainly refers to the fall of the human body in different directions, such as: falling forward, falling backwards, falling to the left, falling to the right. On the basis of these five kinds of daily behaviors, the transformation from one behavior to another constitutes more activity patterns, such as: standing up (from sitting to standing), going upstairs, going downstairs, etc., in these behaviors. The physical characteristics of some behaviors are very similar to those of falls, so they are called fall-like behaviors. Fall-like behavior is a daily activity behavior. It is a difficult point in the fall algorithm to distinguish between fall behavior and daily behavior. Only accurate distinction can be made to better improve the false positive rate and recognition rate of fall detection. The human activity classification is shown in Fig. 10.
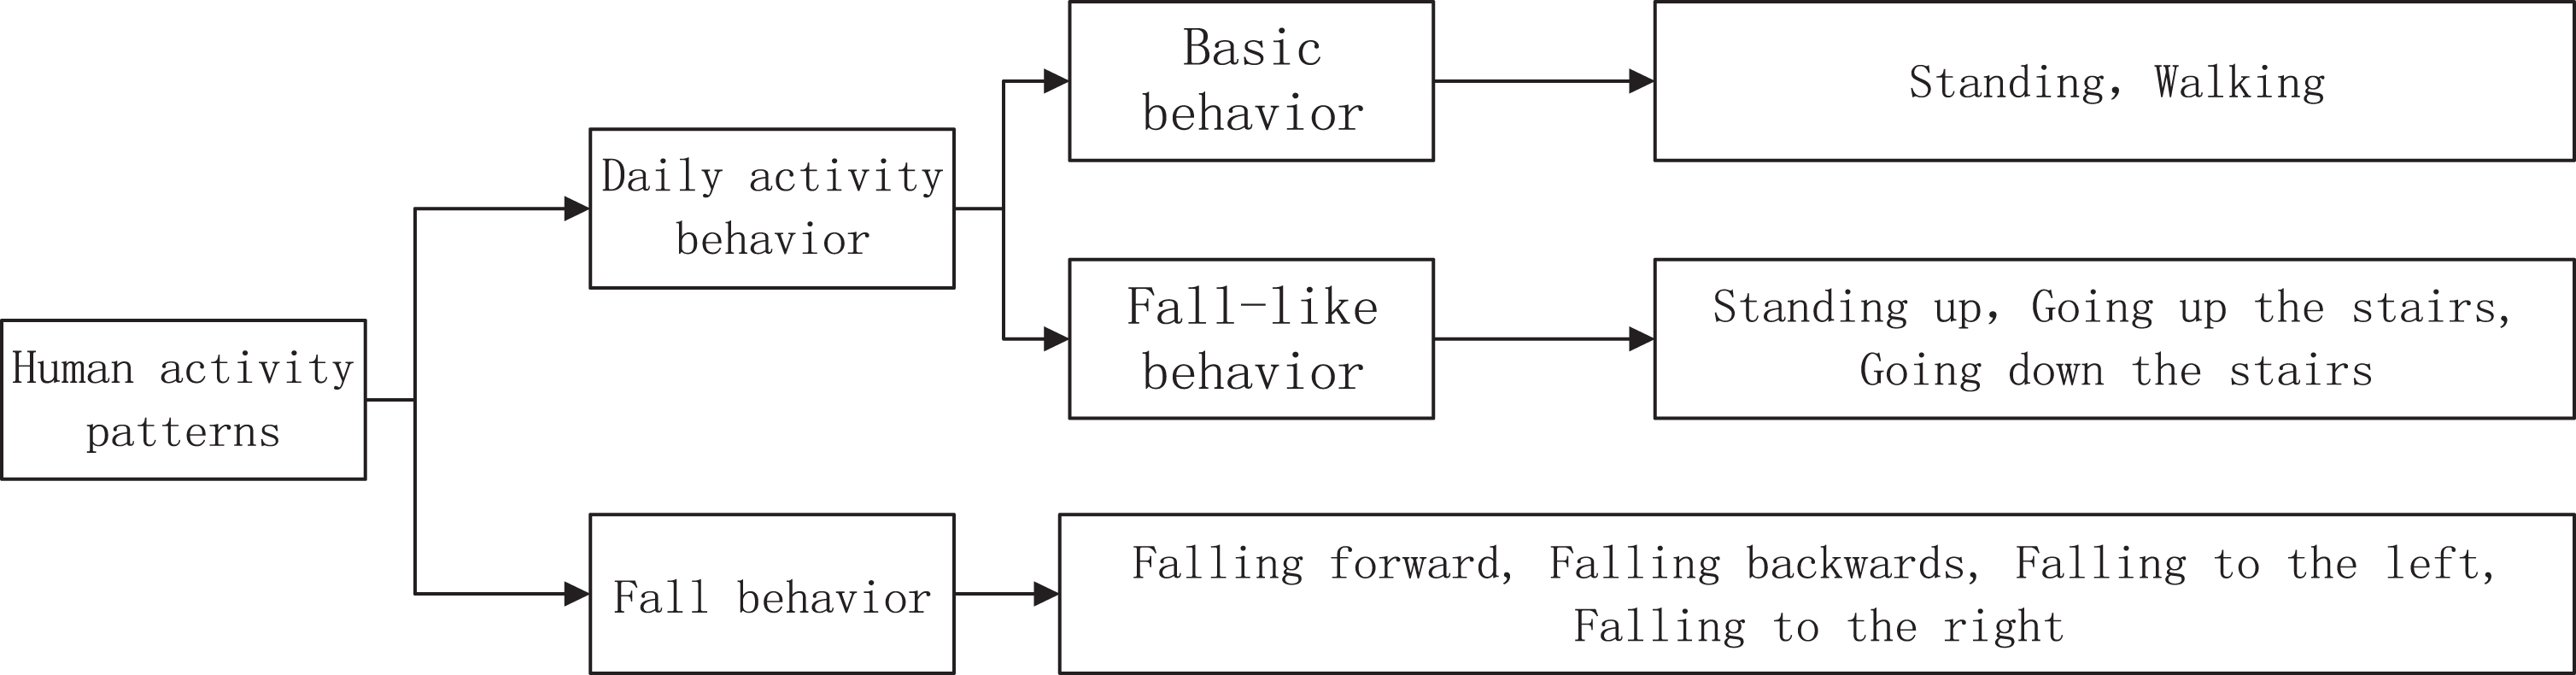
Human activity classification.
Fall behavior can be divided into three stages from the beginning to the end: the imbalance phase, the weightlessness phase, and the collision phase [18]. The imbalance phase refers to that the human body loses its balance due to physiological, disease, external and other reasons, and has a tendency of toppling in one direction from a stable state. In this stage, the human body has not yet taken a big action, so it is difficult to distinguish with the attitude sensor; The second stage is the weightlessness phase. The body will lose weight during this period of time. The change of the combined acceleration caused by the weight loss can be used as an important basis during the determination of the fall detection. This stage is the effective time period for the fall detection judgment; The last phase is the collision phase, in which the human body and the ground collide violently, with great ability change, which can also be shown through resultant acceleration [19]. Finally, the change trend of resultant acceleration extracted from the collision stage is also a good basis for fall judgment.
Data analysis of typical behaviors
In this study, the square root of the added up triaxial acceleration is set to the judgment unit to eliminate the effect of the direction uncertainty [20]. With the Acc set as a resultant acceleration, the expression is as follows:
Where A x , A y , and A z represent the acceleration data of x-axis, y-axis, and z-axis respectively, and the data are collected by the six-axis inertial measurement module MPU6050. Acc is termed as resultant acceleration. Thus, data can be used for the analysis of human daily activities and fall behavior.
The resultant acceleration and human activities are inseparable, according to the analysis of the fall model. With the resultant acceleration as a basis for determination, researchers can accurately distinguish between normal movements and the fall behavior. Two boys and one girl with different heights and weights were selected in the experiment, and the acceleration data of typical human activities were collected. Typical activity behaviors include walking, standing still, standing up, going up the stairs, going down the stairs, and falling. In the experiment, the three-axis acceleration data is collected by the MPU6050, and the three-axis acceleration data are processed into the resultant acceleration and output by the serial port assistant. The typical activity behaviors of the MATLAB simulation are shown in Fig. 11.
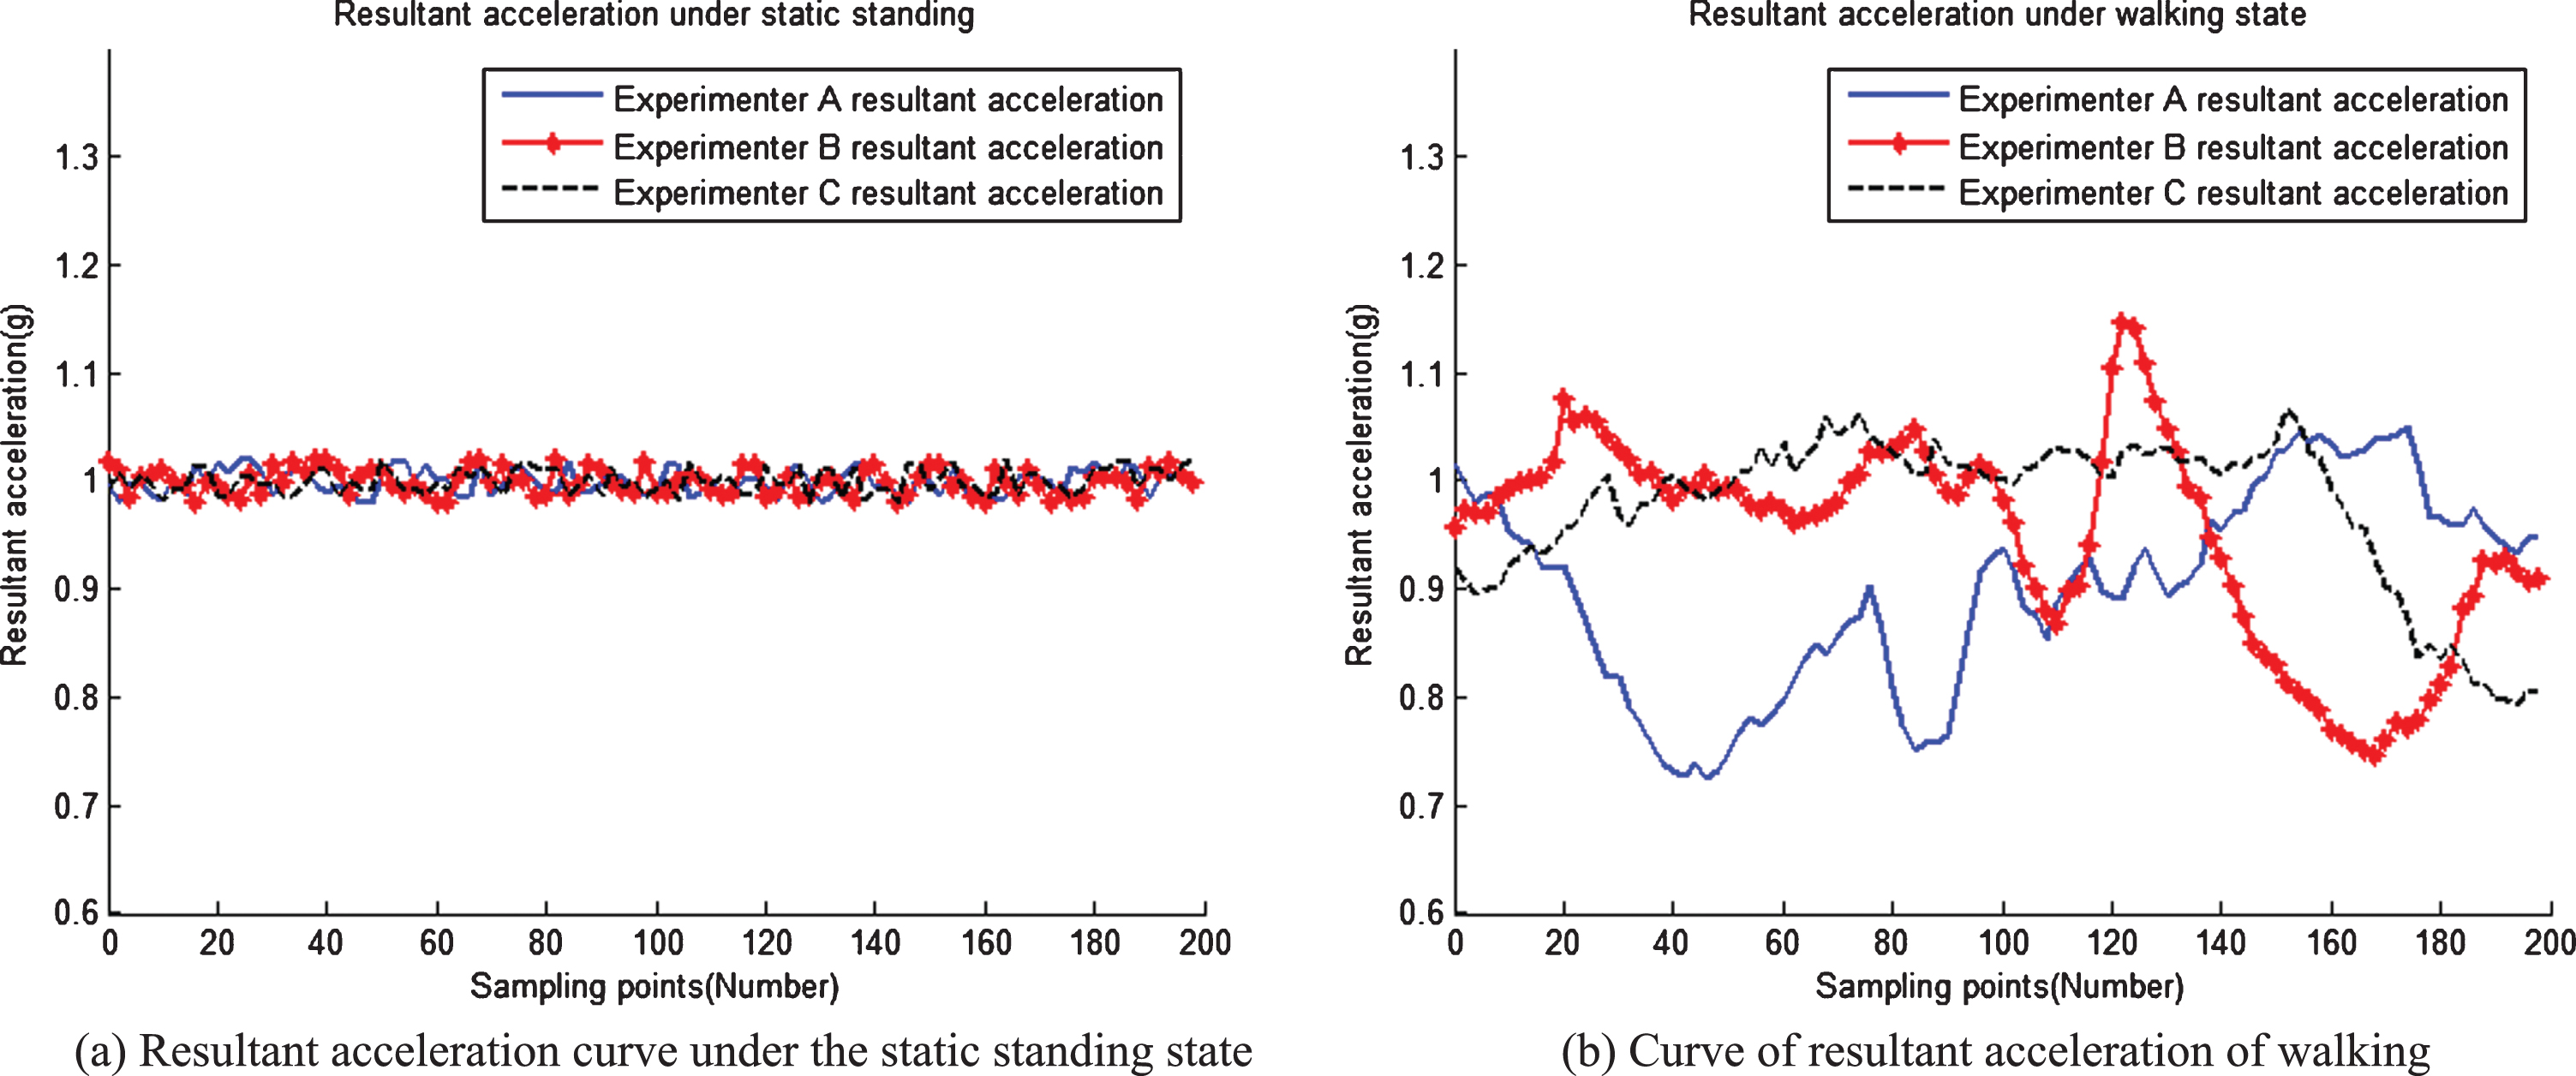
Simulation diagram of typical activity behaviors.
According to the analysis of different human behaviors, we counted the range of daily activities and fall behaviors of the human body, as showed in Table 1.
Synthetic acceleration range statistics table of various active modes of human body
It can be seen from the above table that the synthetic acceleration range of daily activity is from 0.483373 g to 1.917394 g, and the synthetic acceleration range of fall behavior is from 0.294463 g to 5.175019 g. There is an obvious division between daily activity behavior and fall behavior, so the acceleration can be used as the eigenvalue of the first-level threshold determination.
One male and one female were selected to contribute 10 sets of fall behavior data and 20 groups of normal movement, respectively. The test results are shown in Table 2. Among them, g = 9.8 N/kg.
Comparison of the first- and second-level thresholds
Comparison of the first- and second-level thresholds
From the above table, to ensure a lower missing rate, 3.2 g is selected in this experiment as the first-level decision threshold. It can be seen from the above table that when the threshold is between 2.8 g and 3.6 g, the first-level threshold judgment has almost no false report of fall. When the threshold is between 3.8 g and 4.4 g, there is a false report. According to the experimental results, there are more false positives in the first-level judgment between 2.8 g and 3.2 g, so it is more reasonable to select 3.2g– 3.6 g. To ensure a lower false negative rate, 3.2 g is selected in this experiment as a first-level decision threshold.
After selecting the first-level threshold values, we will use the sample data set collected via the experiment to evaluate the effectiveness of the fall detection algorithm completely through three indicators, namely, recognition rate (CR), missing rate (MR), and false rate (FR) [21].
Suppose n experiments are performed, in which the number of normal behaviors are performed a times and the fall behavior is n-a times. The number of triggering the CNN secondary fall determination is p, and the number of times the CNN accurately identifies the fall and the secondary acknowledgement alarm is q.
Recognition rate (
Missing rate (
False rate (
In a fall detection system, the missing rate should be reduced to 0 as much as possible to better ensure the safety of the user groups. At the same time, the higher the recognition rate, the higher the effectiveness of the fall detection algorithm. In addition to a comparatively low false rate, the user will have a satisfactory experience with the product [22].
In the experiment to verify validity, eight experimenters respectively simulated ten groups of six normal behaviors including standing, walking, sitting down, standing up, going up the stairs, and going down the stairs, and participated in a fall detection experiment. In the normal behavior testing, the recognition rate and false rate were used as the evaluation criteria. Results are shown in Table 3.
Experimental evaluation of normal behaviors
Experimental evaluation of normal behaviors
The same group of experimenters simulated ten groups of falling, including fall forward, fall backwards, fall to the left, and fall to the right. The experimental results based on the criteria of recognition rate and missed rate are shown in Table 4.
Experimental evaluation of fall behaviors
From Tables 3 and 4, the fall detection bracelet has a recognition rate of 98.75% and a false rate of 2.0% in the normal behavior detection. In the fall behavior detection, the system recognition rate reaches 96.25%, and the missing rate is at 1.875%. The reason for the high missing rate of leftward fall is that the wristband is worn on the right side of the tester, and the left hand has a buffering action to push the body up over the ground, which reduces the acceleration. The missing report of the forward fall lies in the reduced acceleration caused by the experimenters’ knee-buffering action [23–26].
In this paper, we collect a large amount of human behavior data through the self-designed smart bracelet, and then input the data into the convolutional neural network classifier for training, and establish a human behavior recognition model. The recognition accuracy of the model in the test set is 98.80%, and the recognition rate of the fall behavior is 94.06%. At the same time, aiming at the frequent occurrence of falls accidents in the elderly, a human fall detection algorithm combining human posture, convolutional neural network and secondary threshold decision is proposed. On the side of the bracelet we designed fall detection, fall alarms, remote monitoring and other functions. The experimental results show that the fall detection bracelet, with a recognition rate of 96.25%, a false rate of 2.0%, and an under-reporting rate of 1.875%, can well distinguish falls from other nonfall actions.