
Abstract
The loose logistics market, the weak value-added service capabilities of enterprises, and the backward construction and operation of logistics networks have led to high logistics costs and low efficiency in some enterprises. In order to improve the comprehensive evaluation effect of enterprise logistics enterprise competitiveness, this paper builds a comprehensive evaluation model of logistics enterprise competitiveness based on SEM model based on machine learning technology. Moreover, in order to more accurately grasp the law of customer logistics mode selection behavior, this paper adds the adaptive value of the latent variables of the logistics mode service characteristics obtained through the SEM model to the utility function of the logistics mode to obtain the SEM-NL integrated model. In addition, starting from the analysis of the key factors affecting the competitiveness of enterprise logistics, this paper constructs an evaluation model of enterprise logistics competitiveness, and analyzes and studies the comprehensive competitiveness of enterprise logistics through two aspects of logistics actual competitiveness and logistics future development potential. The research results show that the model constructed in this paper is suitable for the comprehensive evaluation of the competitiveness of logistics enterprises.
Introduction
In recent years, although my country’s logistics infrastructure and technical equipment have made considerable progress, there is still a large gap with Western developed countries and even some developing countries. For example, the density of the transportation network calculated by land area and population is only 19.7% of the United States, 10% of Germany and 25% of India. In the construction process of logistics parks and logistics centers, there are also problems such as unscientific layout, unsound functions, low level of informatization, and poor organizational connectivity. On the one hand, it is difficult to meet the needs of logistics service integration, resulting in poor connectivity between different transportation methods and increasing the number of invalid transportations. On the other hand, due to the lack of coordination between nodes, the supporting and compatibility of logistics infrastructure is poor, resulting in weak overall system functions and difficulty in playing the role of the network; In addition, the degree of logistics standardization is generally low, and there are few logistics collection and storage facilities. Among them, professional freight vehicles with large cargo capacity are generally insufficient, and the logistics equipment that undertakes the equipment handling task is generally backward and lacks standardized measurement indicators, which cannot give full play to the efficiency of logistics operations [1].
With the deepening of economic integration, my country has become the world’s processing and manufacturing center, which has driven the rapid development of the manufacturing industry. At present, the manufacturing industry is in the industrial stage, and most of it itself uses self-operated logistics, and the demand for logistics outsourcing is insufficient. Outsourcing only involves some businesses such as warehousing and transportation. This has caused the problem of low logistics market share and relatively high logistics costs. At present, my country’s largest logistics companies account for less than 2% of the logistics market, which is still far behind the 6% of developed countries such as the United States. The linkage between manufacturing and logistics industries is insufficient. In addition, my country’s third-party logistics services (3PL) are developing rapidly, but the entire logistics industry is still in the expansion stage of extensive management and has not yet formed a logistics service system with intensive management, professional services, and networking. In addition, most logistics companies are unable to scale up and only provide a single service such as transportation or warehousing, and do not provide value-added services such as scientific cost control, integrated information services, and real-time cargo tracking. Logistics companies have poor organizational capabilities and low market concentration. They cannot provide integrated logistics solutions for manufacturing companies and cannot meet the development needs of high-end services. At the same time, the lack of linkage between the manufacturing industry and the development of logistics services affects the full utilization of productivity of the manufacturing industry and the effective improvement of production efficiency, while restricting the further expansion of the logistics service market and the improvement of comprehensive competitiveness [2].
The logistics industry is an emerging industry in my country, and it is still in its infancy. At present, the characteristics of the research on the competitiveness of the logistics industry in academia are that the research on logistics enterprises from the micro perspective accounts for the majority, while the research on logistics enterprises from the meso perspective is relatively small. In particular, the research on the competitiveness of regional logistics industry is even rarer. Therefore, this paper focuses on the level of industrial competitiveness and conducts research on the competitiveness of the regional logistics industry through empirical analysis, which will help to further enrich the research scope of the logistics industry [3].
Related work
The literature [4] proposed a national logistics grading system, and selected four indicators: infrastructure construction level, supplier service level, logistics information system, and human resources to evaluate the development of logistics. Moreover, it evaluated the level of the logistics system through subjective scoring and weighted aggregation, and finally divided the country into three levels: advanced countries, developing countries and backward countries. The literature [5] constructed a regional logistics competitiveness evaluation index system. Through the constructed logistics industry competitiveness evaluation model, it compared the logistics development environment of Asia and Europe and analyzed the advantages and disadvantages of Asia and Europe in the process of developing the logistics industry. The literature [6] divided the logistics systems in Asia and Europe into several levels. By analyzing the transportation background in Asia and Europe, starting from the actual situation of transportation in Asia and Europe, it selected corresponding logistics competitiveness indicators. At the same time, it has constructed an international logistics evaluation system, which provides a research foundation for the study of logistics systems in various countries around the world. The literature [7] used the cluster analysis method to comprehensively compare the logistics systems of Asia and Europe, and finally divides the logistics systems of Asia and Europe into three levels. The literature [8] used quantitative statistical analysis methods. Compared with ordinary scholars only using qualitative methods to analyze regional competitiveness, it constructs a regional logistics evaluation system to analyze, and the conclusions obtained are more convincing.
The literature [9] described the evolution process of the logistics industry from the three aspects of the micro-subject, macro-subject, and industrial association of the logistics industry system evolution. The literature [10] obtained the evolution and integration path of the logistics industry from the perspective of industrial integration and obtained the conclusion that the logistics industry promotes enterprise innovation by optimizing resource allocation in the process of industrial integration, thereby improving industrial performance. The literature [11] comprehensively analyzed the development of the logistics industry from four aspects: logistics development demand status, logistics enterprise development status, logistics enterprise development status, and logistics development effectiveness. Moreover, it pointed out that the logistics industry has problems such as insufficient logistics demand, small logistics scale, and scattered logistics resources. The literature [12] used the SWOT method to study the development status of the modern logistics industry in Jilin Province, and used the support vector machine prediction method to predict the regional logistics demand in Jilin Province, so as to put forward the development countermeasures of the modern logistics industry in Jilin Province. The literature [13] used the gray correlation model to empirically analyze the vertical and horizontal correlations between the logistics industry and the manufacturing industry and other service industries in Guizhou Province, and put forward suggestions for the development of the integration of logistics industry and manufacturing industry and integration with other service industries. The literature [14] used the input-output method to empirically analyze the relevance of the logistics industry in Jiangxi Province to other industries, and obtained the industrial spillover effects of the logistics industry, and put forward countermeasures and suggestions for the development of the logistics industry in Jiangxi Province from the perspective of industrial relevance. The literature [15] used the methods of collecting data and research activities to propose that factors such as the number of routes, service capabilities, related costs, and congestion have varying degrees of impact on port logistics competitiveness. Through a series of studies, the literature [16] put forward the most representative five main factors, namely, collection and distribution capacity, railway connection rate, labor cost and production efficiency. Taking the British ports and hinterland as the research object, the literature [17] found that changes in technology and organization will weaken the density of connections between ports and regions, and will also cause the influence of port distance and direct economic hinterland on port competitiveness to gradually weaken, and the cross hinterland has gradually become the main influencing factor of port logistics competitiveness. The literature [18] regarded technological progress and organizational development as key factors to enhance port logistics competitiveness. Improvements in means of transportation and innovations in transportation methods have led to changes in port functions. The port is no longer just a node of transportation, but a logistics system integrating transportation and storage. This has increased the scope of port competition and intensified competition. The literature [19] proposed that the combination of port, shipping, and railway is more conducive to enhancing the competitiveness of port logistics based on the perspective of technology and management innovation. The literature [20] respectively proposed that deep water channels, efficiency, technical equipment and service levels have a huge influence on the competitive advantages of port logistics based on Hong Kong, Kaohsiung and Busan Port in South Korea.
The literature [21] focused on many European ports and summarized and categorizes port logistics competitiveness indicators. Moreover, it substituted the indicators into the constructed port logistics competitiveness evaluation model and concluded that there is a coordination factor and operational relationship between the reference indicators and the port logistics competitiveness. The literature [22] applied the discrete model to the evaluation of port logistics competitiveness. Moreover, based on the Logit model, it measured the competitiveness of port logistics through five factors: the average capacity of the port ship, the distance between the sea and land, whether it is the last call at the port, and the average time between ship voyages. Based on the economies of scale, the literature [23] focused on the study of ports in major regions and showed that scientific intensive and coordinated operation of logistics resources between ports will achieve the effect of decentralizing ports to create benefits and improve logistics competitiveness. The literature [24] regarded the efficiency of the supply chain system as the main factor to measure the competitiveness of port logistics from the perspective of the integrated logistics service system. Moreover, the two scholars used the reference factors of the supply chain system to establish a data model to monitor the strength of port logistics competitiveness. The literature [25] put forward the key factors affecting the competitiveness of port logistics, such as service quality, potential sources of goods, operating costs, and regional centrality based on relevant data of East Asian ports.
SEM-NL model
The evaluation model constructed in this paper based on the SEM and NL model is shown in Fig. 1.

Schematic diagram of the structure of the SEM-NL integrated model.
In the structural equation model, each latent variable has a corresponding observation variable. The measurement of latent variable η
ikn
can be represented by its corresponding observed variable y
itn
on the one hand, and can also be represented by the following formula on the other hand.
Among them:
r——the number of obvious variables of individual socioeconomic characteristics that have an influence relationship with the latent variable;
t——the number of observed variables corresponding to latent variables;
x irn ——The obvious variables of personal socio-economic characteristics that have an influential relationship with the latent variables;
y itn ——The observed variable corresponding to the latent variable;
λ ikn , γ ikt ——parameter to be estimated;
ζ ikn , ξ itn ——error variable.
In the discrete choice model, personal utility U
in
can be represented by fixed term V
in
and random term ɛ
in
. The improved utility function can be expressed as:
i——decision method;
n——Logistics enterprise;
l——the number of characteristic variables;
q——the number of obvious variables of the characteristics of the logistics mode;
k——the number of latent variables;
s iln ——obvious variables of economic characteristics;
z iqn ——Significant variables;
η ikn ——latent variable;
a il , b iq , c ik ——parameter to be estimated.
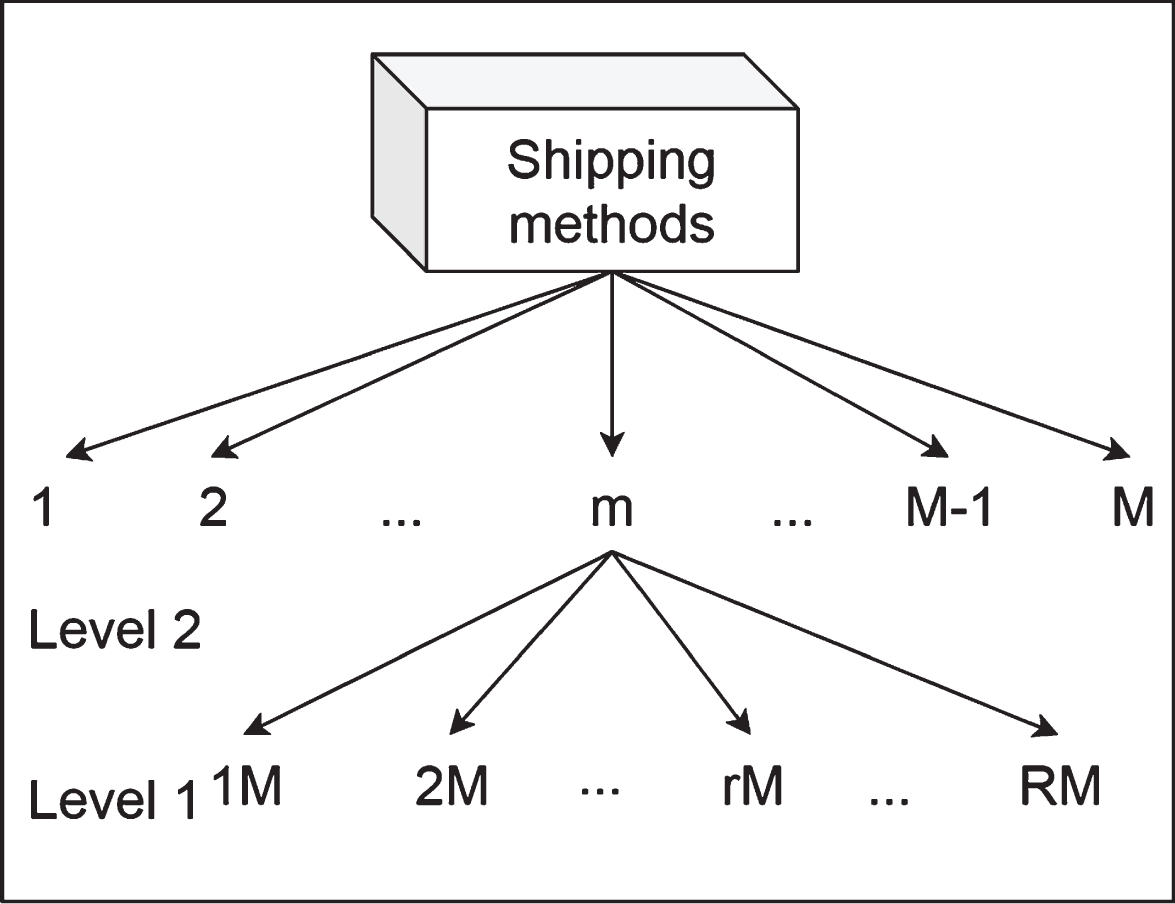
For the sake of simplicity, the following takes the two-layer NL model as an example to introduce its selection probability. The model structure is shown in the figure below.
The selection probability P
n
(rm) of n’s selection plan rm can be expressed as:
Rmn is the number of options available for the m-th option of n at level 2 under level 1, and Mn is the number of options available for n at level 1.
Among them, P
n
(r|m) and P
n
(m) can be specifically expressed as:
In the formula,
V (r|m)n——Under the condition that the upper-level program m has been selected, n selects the fixed item of the utility obtained by the lower-level program of m at r.
V rm ——When the scheme rm is selected, the utility fixity of n only changes with the upper scheme m.
λ Logsum ——tolerance factor. Its value can reflect the impact of the utility of the lower-level program on the utility of the upper-level program.
Model solving
At present, there are two methods for parameter estimation of the NL model: The first method is to estimate all the parameters in the multi-layer model at the same time, which is called “holographic estimation method". The second method is to decompose the NL model into multiple MNL models and perform parameter estimation from bottom to top, which is called “sequential estimation method". For the selection model of inter-city logistics mode for urban agglomeration established in this paper, in order to reflect the feedback effect of low-level to adjacent high-level and reflect the mutual influence and relevance of logistics behavior decision-making, this paper selects the sequential estimation method and uses Trans CAD software to estimate the NL model parameters.
The specific steps for solving the SEM-NL integrated model are as follows: Data is input. The raw data obtained from the questionnaire was input into the SPSS software. AMOS software is used to solve structural equations. First, according to the determined path diagrams between the latent variables of the structural equation and between the latent variables and their corresponding observation variables, the corresponding data in SPSS is imported into AMOS, and after multiple corrections, the adaptive value of the latent variables is obtained. The Trans CAD software layer is used to calculate the NL model. The lowest level models are all regarded as independent MNL models. It defines and estimates each MNL model separately by specifying the model table and running Planning-Mode Split-Multinomial Logit Estimation and calculates the Logsum value of each MNL model at the bottom through the formula field. The Logsum value is substituted into the upper model to which it belongs, and the selection tree is estimated layer by layer. When estimating the top MNL model, the latent variable adaptation value obtained in the second step is added to the utility function of the model, and the Logsum value of the nested lower model is used as the explanatory variable of the model. At the same time, all the parameter values of the NL model including them are estimated. The t value is calculated and tested. If the absolute value of the t value of each variable parameter is greater than 1.96, it means that there is 95% confidence that these factors have a significant impact on the choice of logistics mode. Otherwise, the variable needs to be eliminated. At the same time, the third step is returned to re-estimate the variable coefficients and calculate the t value until the t values of all variables meet the requirements.
In addition to the t-value test, the Logit model also has an ρ2-parameter test statistic, which is also called the goodness ratio. ρ2 is the overall evaluation of model fit. The closer its value is to 1, the higher the accuracy of the model and the more explainable the selection behavior. However, in actual operation, when the ρ2 value reaches 0.2–0.4, the model accuracy can be considered to meet the requirements.
The basic idea of structural equation model
The modeling process of structural equation model can usually be divided into five steps: model expression, model identification, model estimation, model evaluation and model modification.
(1) Model expression
Model expression refers to the initial theoretical model formed before model estimation, which can be represented by two basic models: measurement model and structural model. The measurement model reflects the relationship between latent variables and observed variables. Because it usually uses a model to verify certain presumptions, it is also called a confirmatory factor model. The structural model reflects the causal relationship between latent variables. In SEM, the number of endogenous latent variables should be the same as the number of structural models, that is, each endogenous latent variable corresponds to an equation.
The measurement equation of the exogenous latent variable (independent variable) is:
The measurement equation of the endogenous latent variable (dependent variable) is:
The structural equation is:
X——observed variable of latent variable ξ;
Y——observed variable of latent variable η;
ξ-Exogenous latent variable (independent variable);
η——Endogenous latent variable (dependent variable);
Λ X ——Regression coefficient or factor loading matrix between observed variable X and latent variable ξ;
Λ Y -the regression coefficient or factor loading matrix between the observed variable Y and the latent variable η;
δ——The vector formed by the observation error of X;
ɛ——The vector formed by the observation error of Y;
B——Regression coefficient matrix of mutual influence between endogenous latent variables η;
Γ——Regression coefficient matrix of the influence of exogenous latent variable ξ on endogenous latent variable η;
ζ——Residual term vector
Model identification is to determine whether there is a unique solution for a given model. If the model is set incorrectly, the model estimation may not converge or have no solution (the parameter estimation has no unique solution). Model identification is mainly based on the t rule. If the relationship of the following formula is met, the model can be identified at this time, otherwise the model cannot be identified.
In the formula: t is the number of parameters to be estimated, p is the number of endogenous variables, and q is the number of exogenous variables.
(3) Model estimation
In SEM analysis, there are a variety of commonly used parameter estimation methods, including maximum likelihood estimation (ML), unweighted least square estimation (ULS), generalized least square estimation (GLS) and so on. Among them, the most widely used parameter estimation methods are the ML method and the GLS method.
(4) Model evaluation
After the parameters of the structural equation model are estimated, the model needs to be tested and evaluated. Without model fit evaluation, any conclusions of model estimation may be misleading. Therefore, before interpreting model parameters, an overall model fit evaluation should be performed. Common model fitting indicators and evaluation criteria are shown in Table 1.
Common model fitting indicators and their evaluation criteria
(5) Model modification
After the structural equation model is evaluated, it may be found that the hypothetical model is not appropriate, so it will face the question of whether the hypothetical model needs to be revised. There are two directions for model modification: one is to modify the model to simplify, that is, to delete or restrict some paths. At this time, the critical ratio (CR for short) changes are used for correction. The second is to modify the model extension, that is, to relax some path restrictions. At this time, the size of the modification index (MI) is used to adjust to improve the fit of the model.
Variable selection
In addition to personal socioeconomic characteristics, logistics mode characteristics, and logistics characteristics, the factors that affect the choice of intercity mode in tourist city groups also include psychological factors. In the intercity logistics of urban agglomeration, logistics psychology can be divided into general psychology and individual psychology. The requirements for convenience, comfort, safety, economy, and speed of transportation are common psychology. In previous studies, the measurement and use of service characteristics of transportation modes including convenience and comfort are objective indicators. For example, the “comfort” is measured by vibration acceleration and per capita space, while ignoring the subjective feeling of comfort is a latent variable that cannot be directly measured. Combined with the theory of planned behavior, this paper selects seven latent variables including convenience, comfort, safety, economy, speed, perceived value and behavioral intentions in the analysis of the choice behavior of the intercity trunk line logistics mode.
Structural equation modeling is a confirmatory analysis method. It starts from the theoretical framework of the hypothesis and uses relevant data to verify the validity of this hypothesis. Therefore, after the latent and observed variables have been determined, the next step is to make assumptions about the relationship between the latent variables. In this paper, the relationship between latent variables is set as follows: H1: The subjective evaluation of the convenience of transportation will have a positive and direct impact on the perceived value. H2: The subjective evaluation of the safety of the transportation mode will have a positive and direct impact on the perceived value. H3: The subjective evaluation of the comfort of the mode of transportation will have a positive and direct impact on the perceived value. H4: The subjective evaluation of the economic aspects of transportation will have a positive and direct impact on the perceived value. H5: The subjective evaluation of the speed of transportation will have a positive and direct impact on the perceived value. H6: The perceived value of the mode of transportation will have a positive direct impact on the behavioral intention.
The research hypothesizes that in the process of personal logistics decision-making, their behavioral intentions will be affected by their own subjective evaluation of the logistics plan (that is, perceived value). Moreover, the perceptual value is affected by factors such as convenience, comfort, safety, economy, and speed. The above hypothesis can be expressed succinctly through the path diagram 3.
The expected parameters of time and cost variables are all negative values, which means that the more time and cost of decision-making methods will bring greater negative effects.
In this model, the latent variables of service characteristics include convenience, comfort, safety, economy and speed. These factors are all factors that cannot be directly measured, and it is necessary to use the structural equation model to reflect these latent variables through the set measurement indicators. The expected parameter values of this variable are all positive, indicating that the higher the subjective evaluation of the convenience, comfort, safety, economy, and speed of a certain intercity trunk line logistics method, the greater the probability of the method being big.
According to the above setting, the utility function of each option in the mode selection can be written, as shown in the following formulas (19)∼(22).
In order to comprehensively investigate the logistics competitiveness of enterprises, this paper selects 12 enterprises as examples for analysis, and this paper uses SPSS 18.0 statistical analysis software to compare and analyze the regional competitiveness. The index data of enterprise logistics competitiveness is shown in Table 2 and Fig. 4.
Index data of enterprise logistics competitiveness
Index data of enterprise logistics competitiveness
NL model selection tree structure diagram.

The initial model diagram of the latent variables of the inter-city logistics mode of the city.
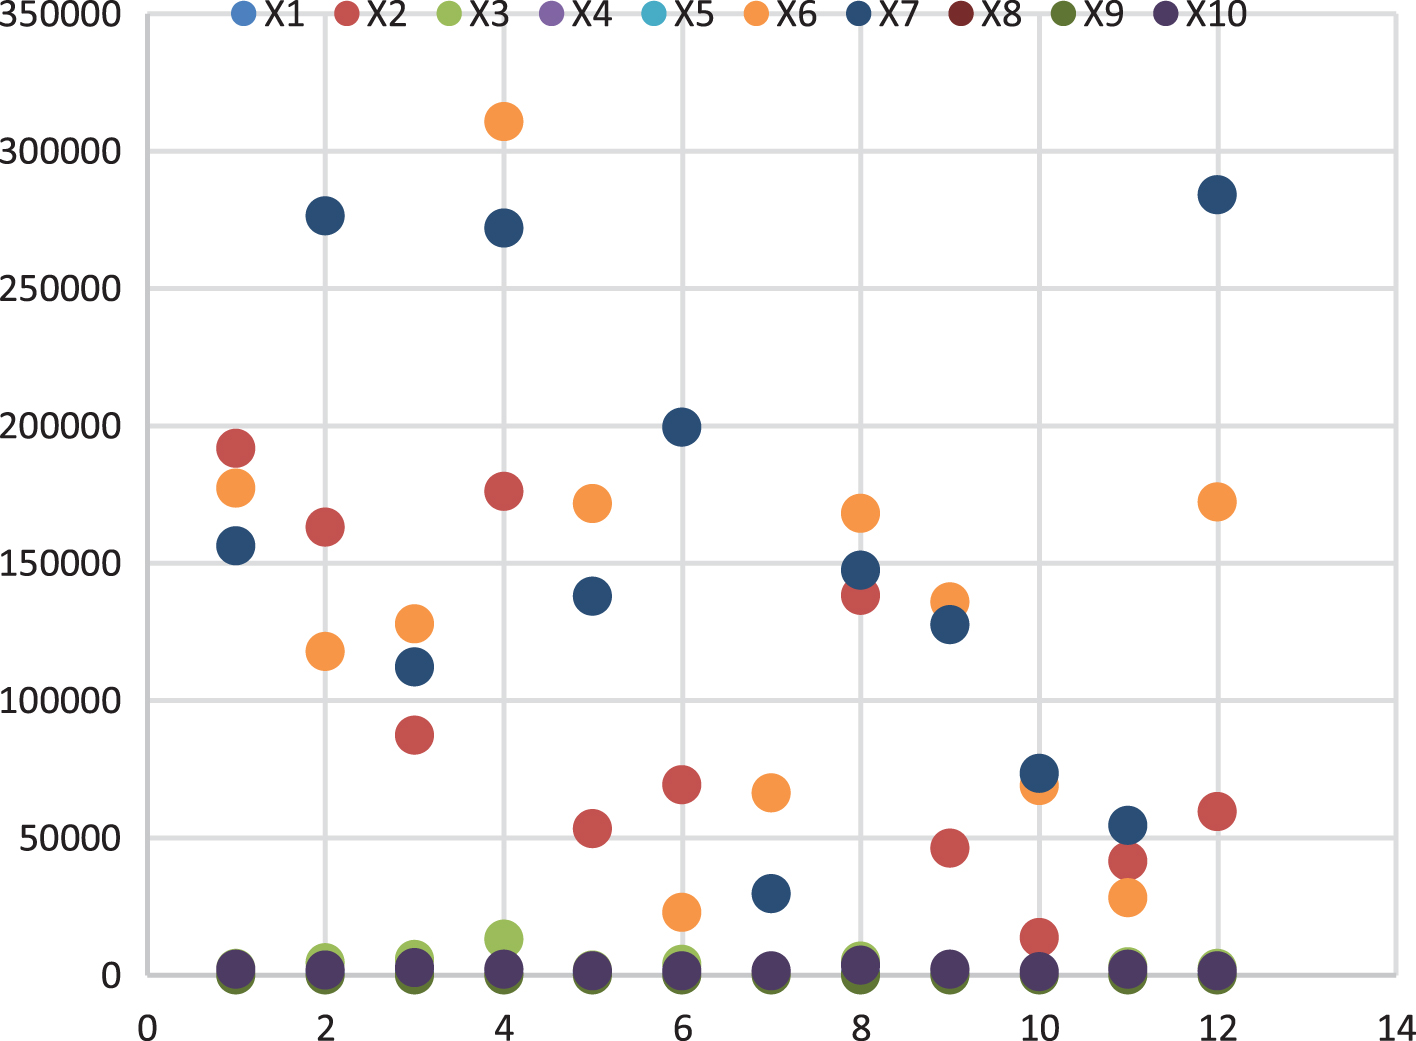
Statistical diagram of index data of enterprise logistics competitiveness.
The index data of enterprise logistics competition potential is shown in Table 3 and Fig. 5.
Index data of enterprise logistics competitiveness potential
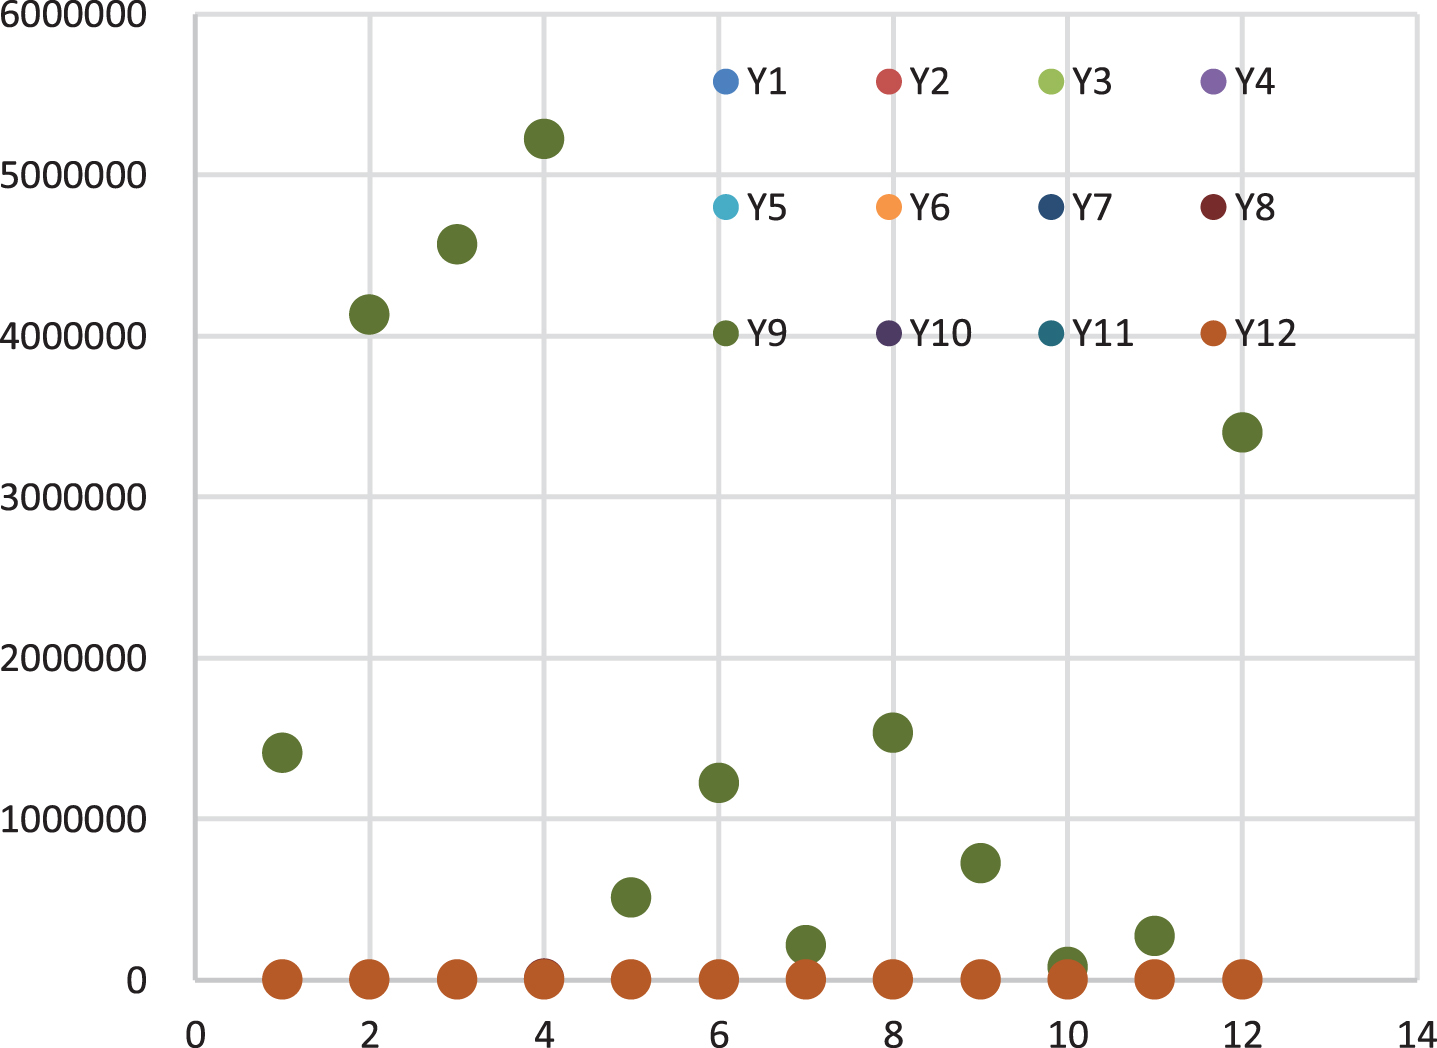
Statistical diagram of index data of enterprise logistics competitiveness potential.
Aiming at the number 8 enterprise, this paper compares it with other regions in the evaluation of enterprise logistics competitiveness. The evaluation content is divided into two major aspects, namely the actual competitiveness of enterprise logistics and the potential competitiveness of enterprise logistics.
In order to eliminate the differences in the dimensions of the original index units in the enterprise logistics competitiveness evaluation index system, this paper first uses SPSS18.0 software to standardize the raw data of each indicator. The standardized index values are shown in Table 4 and Fig. 6.
Standardized index data of logistics competitiveness

Statistical diagram of standardized index data of logistics competitiveness.
F1 has a relatively high load on three indicators: the length of the postal route, the number of employees in the transportation and warehousing industry, and the total express delivery business. Therefore, F1 can be regarded as a public factor of logistics infrastructure and talent competitiveness, and F2 factor is mainly reflected in the three indicators of operating vehicle load tonnage, regional freight volume, and logistics industry output value. Therefore, F2 can be defined as the main factor of enterprise logistics scale. This paper uses SPSS software to obtain the principal component scores and rankings of each region, as shown in Table 5 and Fig. 7.
Score of each principal component
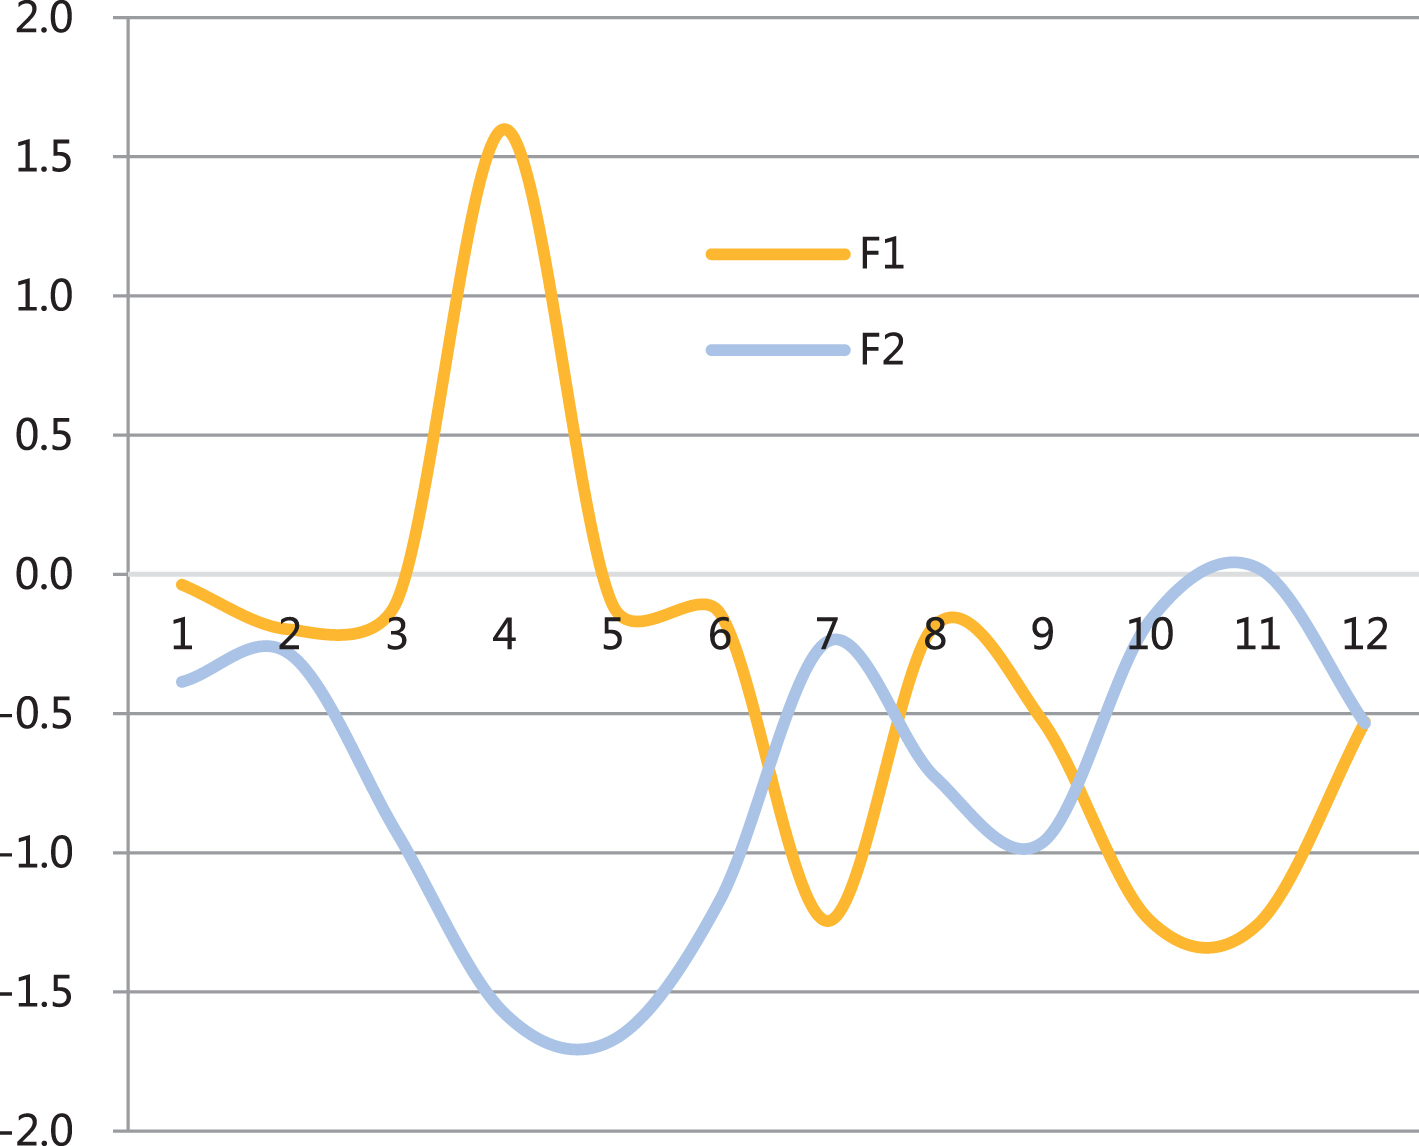
Statistical diagram of the scores of each principal component.
Overall, the logistics competition potential of Enterprise 8 ranks fifth, which is at the middle level. It shows that Enterprise 8 has a good logistics development potential in the strategy of western development. In this case, how to cultivate the potential of logistics development in a healthy way to enhance the overall competitiveness of regional logistics is particularly important.
From the factor analysis and the analysis of the coefficient of variation method, it can be seen that the regional economic environment has a great influence on the competitiveness of enterprise logistics. Generally speaking, the more developed the economy, the higher the economic growth rate, the more advantageous its logistics competitiveness. Enterprise 8 has a low index score in terms of its level of informatization and investment in transportation and logistics, leading to a lower ranking of its logistics potential competitiveness. Therefore, it is necessary to accelerate the level of informatization development, and the government will provide certain financial support to the logistics information industry and logistics software, so that the development of the logistics industry of enterprises 8 will shift to modern operations, improve efficiency, and enhance the level of logistics competitiveness.
According to the ranking of enterprise logistics competitiveness, it can be seen that enterprise 8 has certain differences with other regions in terms of logistics scale, logistics efficiency and efficiency, and enterprise logistics development environment, and is in a relatively inferior position. To improve the efficiency of the logistics industry and increase its competitiveness, it is necessary to create a good logistics development environment from the outside.
With the guidance of sustainable development strategies, the logistics industry, as an emerging service industry, has an inseparable relationship with regional economic development. It can not only directly drive regional economic development, but also stimulate the polarization effect of regional economic growth poles. By drawing on the existing research results of logistics efficiency and logistics competitiveness at home and abroad, this paper uses SEM model theory to analyze the key factors that determine the level of enterprise logistics competitiveness, including: regional economic development environment, regional related industries and auxiliary industries, government policy environment, and regional informatization level. Moreover, based on the principles of the constructed index system and the actual situation of enterprise logistics, this paper uses the actual competitiveness of enterprise logistics and the potential competitiveness of enterprise logistics as secondary indicators to construct an evaluation model of enterprise logistics competitiveness. The correct evaluation of the competitiveness of the enterprise logistics industry will not only help the government and relevant departments to formulate the development plan of the enterprise logistics industry scientifically and reasonably, but also help investors and suppliers make decisions on regional selection, thereby enhancing the overall competitiveness of enterprise logistics.