
Abstract
Precision marketing is faced with multiple levels of problems, such as pollution of the data environment and unscientific algorithms, which need to be sorted out urgently. Based on neural network technology, this paper constructs a neural network-based precision marketing model and focuses on data mining to study user churn prediction and user value enhancement, which are the two most important factors affecting marketing revenue. Moreover, this paper conducts an empirical test of the product strategy and market strategy adopted by big data precision marketing. According to the characteristics of the user population and the application scenarios of the product, this paper puts the corresponding precision marketing methods in a targeted manner and analyzes the performance of the model through experimental research. The research results show that precision marketing methods based on big data information platforms need to be more detailed and more comprehensive. At the same time, precision marketing methods need to correspond to the sensitive information characteristics of target users and consider the background and current situation of actual market execution to effectively play it role.
Introduction
Due to technological development and changes in consumer characteristics, large-scale traditional retail businesses have long turned to an omni-channel business model that combines online and offline. Moreover, in the fierce market competition, pure commodity competition is not enough to constitute a market advantage. Therefore, enterprises take full excavation of customer value as an opportunity to improve competitiveness, and aim to improve user experience and operating efficiency [1]. At the same time, companies focus on the entire customer life cycle management to provide consumers with more high-quality and accurate products and services through a series of digital operation technologies. Precision marketing is the focus of digital marketing in the retail industry at this stage. The purpose is that companies use existing customer assets and use efficient tools to better understand customers and provide customers with more accurate and convenient products. Precision marketing is not only a product of marketing theory adapting to market competition trends, but also a beneficiary of the development of data technology. Thanks to the application of various data analysis technologies, precision marketing has been widely used in the retail industry’s deep customer segmentation, personalized recommendations, and mining related sales opportunities.
More and more companies use big data technology to carry out precision marketing and achieve better results than the traditional marketing methods of spreading the Internet. Therefore, precision marketing has become an important direction and trend for current e-commerce companies to transform marketing. With the increasing popularity of mobile shopping on mobile phones, online shopping has become a daily routine in people’s lives, and more and more people tend to shop online. Therefore, our footprints and information have also been left on the Internet. Through the use of big data technology to collect, mine, analyze and organize online information, users can be profiled and their behavior preferences can be predicted to provide companies with more accurate positioning for precision marketing, thereby reducing marketing costs and achieving low expansion.
To summarize precision marketing in a simple sentence is to recommend products or services that best meet their requirements at the most appropriate time and through appropriate methods for customers in need [2].
Big data is both familiar and unfamiliar to many people. From a noun perspective, many people understand that it is an information resource. However, in view of the current rapid development of information technology, big data has become a dynamic process of information resources from being recorded to collecting, mining, sorting, and analyzing. This process plays a very important role in various industries or enterprises. In particular, the development of e-commerce companies in recent years and their own uniqueness have placed higher requirements on the availability of data resources. For a long time, e-commerce companies have been looking forward to obtaining more customer resources at a lower cost. The characteristics of big data itself make this expectation possible [3].
Related work
According to the relevant theories of network economics, the literature [4] believed that Internet finance presents obvious network externalities, and divides it into two parts: network positive externalities and network negative externalities. The literature [5] stated that Internet finance refers to various financial products that use the Internet to achieve various services, including payment, wealth management, insurance, etc., and it was also called digital finance in the early days. Moreover, the literature [5] pointed out that although online finance has monopolized user information for a long time, with the continuous improvement of network technology, this phenomenon will no longer continue. In the future, users will use electronic intelligent information management to further reduce transaction costs, user status will also be significantly improved, and will enjoy more humane “one-stop” financial services. The literature [6] stated that with the further development of Internet technology, the financial industry will become more and more dependent on it, and the Internet presents the characteristics of economies of scale, which will largely break through the environment of the traditional financial industry. The point of the literature [7] is that the study of customer relationship management only provides an interactive way for customers and online finance, and data mining technology deeply improves the internal business procedures of online finance to make this method more efficient and rapid. At the same time, by studying the transaction behavior of customers, we can better understand customers and maintain customer relationships, understand customer preferences and interests, and then respond to customers and even estimate customer needs in the shortest time, provide customers with the best service, and greatly enhance customer’s loyalty. The point of literature [8] is that precision marketing development integrated with data mining can give high-precision method judgment and prediction performance, so that salesmen can develop and carry out marketing activities reasonably. The literature [9] uses this tool of HNC and estimates the time point at which the corresponding product should be provided to the customer according to the customer’s consumption pattern. From the perspective of financial innovation, literature [10] pointed out that the current P2P online lending method is quite popular. This is a small loan method developed by lenders and borrowers through an open Internet system, and they sign relevant loan contracts with each other, instead of carrying out lending work through old-style organizations such as online finance as in the past. The literature [11] integrated the attributes of mobile network finance in some poor countries and regions. The literature [12] specifically explained the operating mode and future development of Internet crowdfunding, and further analyzed the internal principles of fundraising through crowdfunding, especially from a theoretical perspective.
The literature [13] believed that the development of e-commerce is gradually being accepted by the mainstream masses, and online retail ports will even more need the intervention of the concept of precision marketing, and communicate with customers at the other end of the retail through precision marketing. The literature [14] combined with online data analysis to scientifically and rigorously plan customer consumption information to develop services that are more favored by customers and obtain higher value returns to improve the overall business capability of the industry. The literature [15] believed that with the continuous changes of the current market, the original system concept is far from being able to support offline practice. Therefore, in the process of constant change, companies need to constantly search for customers and constantly change marketing methods. In the future development process, there will be no trade-offs. This requires a closer relationship between enterprises and customers in order to unify services. The literature [16] used precision marketing in the field of high-end education and training to successfully attract customers through a one-to-one approach. Different from the traditional one-to-many model, in this method, the needs of customers are constantly being explored and met. What follows is that customer stickiness continues to rise, which is of great help to brand development. The literature [17] combined precision marketing strategies with the life cycle of customers, and makes customer value more cyclical, so that various industries can have a certain blueprint for reference in the process of developing customers.
The literature [18] pointed out that although companies are in the information age and big data age are a positive factor, they must pay attention to the deviation between the true psychology of customers and cold data analysis when implementing precision marketing strategies. Moreover, it pointed out that companies should consciously weaken their dependence on big data, and on this basis, effectively combine corporate experience and big data to truly realize precision marketing. The literature [19] pointed out that precise data, precise analysis, and precise push are the basic components of precision marketing (the era of big data). These three parts are closely related. In order to achieve the goal of precision marketing, companies must make full use of each link. The literature [20] believed that the three fields of agricultural products, e-commerce and advertising are the industries that use precision marketing sales strategies the most. In addition, scholars pointed out that the current precision marketing still has not been substantively expanded, and limitations still exist. In the field of precision marketing concepts, the literature [21] defined precision marketing and explains the key measures of precision marketing. The literature [22] discussed how companies establish marketing systems and how companies conduct precision marketing.
Introduction to logistic regression model
X = (X1, X2, ⋯ , X
p
)
T
represents the factors that affect the probability of event A, and π (X) represents the corresponding probability. If we can establish a functional relationship between π (X) and X = (X1, X2, ⋯ , X
p
)
T
[23]:
Then, the correlation between x and π (X) can be studied accordingly. However, the value of π (X) is between 0 and 1, and f (X1, X2, ⋯ , X
p
) must be restricted. Its value is between 0 and 1, it is possible to establish a suitable relationship between π (X) and f (X1, X2, ⋯ , X
p
). Or, equivalently, we transform π (X) so that the value range of the function is (- ∞ , + ∞) when π (X) takes a value between 0 and 1. In this way, f (X1, X2, ⋯ , X
p
) can be taken as some commonly used functions (such as linear functions, polynomial functions, etc.). Usually, the transformation of π (X) is as follows.
Then, when 0 < π (X) < 1, there is -∞ < θ [π (X)] < + ∞. At this time, we set:
In practical applications, the choice of f (X1, X2, ⋯ , X
p
) has great flexibility. However, the most widely used form is to take it as the linear function of X1, X2, ⋯ , X
p
, that is, take [24]:
At this time,
Or
We call formula (5) or formula (6) the linear Logistic model or Logistic model for short.
In linear regression, when estimating unknown overall parameters, the main method used is the least squares method. The principle of this method is to minimize the sum of squared residuals between the observed value of the dependent variable and the predicted value according to the parameter estimated value selected by the linear regression model. In linear regression analysis, the maximum likelihood estimation method can obtain the same result as the least square method. Compared with the least squares method, maximum likelihood estimation can also be used for parameter estimation of nonlinear models. Since logistic regression is a nonlinear model, the maximum likelihood estimation method is the most commonly used model estimation method.
We assume that there are n observations as a sample, the observation value is y1, y2, ⋯ , y
n
, and the value of 1 ⩽ i ⩽ n is 0 or 1. Under the condition that x
i
is given, the probability that the value of y
i
is 1 is denoted as p
i
, and the probability that the value of x
i
and y
i
is 0 is denoted as p
i
. The probability that y
i
takes a value of 0 is denoted as 1 - p
i
. Therefore, the probability of obtaining the i-th observation value is
This is the likelihood function of n observations. The conditional probability of occurrence of the event discussed earlier is
This formula is called the log likelihood function. The partial derivatives of parameters α and β are obtained respectively to obtain the likelihood equation. If there are k independent variables in the model, β m needs to be differentiated, and 1 ⩽ m ⩽ k can get k + 1 equations to estimate the values of α and β1, β2, ⋯ , β k . The likelihood equation obtained from the Logistic regression equation is nonlinear, so the maximum likelihood estimation here is done by iterative calculation.
Hypothetical test
(1) Test of linear relationship
Similar to linear regression, in Logistic regression, hypothesis testing is also required for the linear form of
In Logistic regression, the constructed statistic is χ2, and its test principle is similar to linear regression (F test). SAS Logistic process has three methods to test the significance of linear relationship, namely likelihood ratio test (Likclihood Ratio), score test (Score) and Wald test. By comparing the P value output by SAS with the significance level, we can make a judgment to accept or reject the null hypothesis. Specifically: when the value of P is less than the given significance level, we can reject the null hypothesis and think that
(2) Significance test of regression coefficient
According to the approximate distribution of the MLE estimate of the Logistic regression coefficient, we can directly perform a statistical test of the significance of the regression coefficient. The null hypothesis and the alternative hypothesis are [25]:
The χ2 statistic is usually used as the test statistic. There are two main types of testing methods: wald test and likelihood ratio test (L.R. test). Generally, we mainly use Wald statistics to test a single coefficient, while the L.R. test (likelihood ratio test) is mainly used in the overall test of a set of coefficients. For the Wald test, under the condition that the null hypothesis is established and the regression coefficient is 0, the statistic
Goodness of fit
In statistics, there are many methods to evaluate the goodness of fit of the Logistic regression model. The indicators of the amount of information are commonly used evaluation indicators, that is, the AIC criterion and the SBC criterion. In the SAS Logistic process, the calculation formulas of AIC and SC are as follows: The formula of AIC criterion is:
Among them, L is the value of the likelihood function, and k is the number of parameters. The formula of the SBC criterion is:
Among them, n is the sample size. The AIC and SC criteria only apply to comparisons between different models of the same data. When other conditions remain unchanged, the smaller the AIC or SC index value of the model means the better the model fits.
If the predicted probability value of the observation that the event occurs is equal to the predicted probability value of the observation that the event does not occur, the observation data pair is defined as a tie (Tie). From this, the calculation formula of C value is obtained:
Among them, n is the sample size and t is the total number of pairs of observation data. At the same time, nc is the number of harmonious pairs, and nd is the number of discordant data pairs. The C value is used for comparison between different models of the same set of data. The larger the value of the indicator, the higher the prediction accuracy of the model.
The mathematical description of the clustering problem is as follows. Data set D{ d
i
|i = 1, 2, ⋯ , n } is given. Among them, d
i
is a data object, and the set D is divided into k groups according to the similarity between the data objects, and satisfies:
Then, this process is called clustering. Among them, C
i
is called group. For fuzzy clustering, because a data object may belong to multiple clusters, the above formula does not hold. According to the clustering objects, clustering algorithms can be divided into sample-based clustering and variable-based clustering (ie Q-type clustering and R-type clustering). The thinking methods of the two are similar, and the latter requires some conversion before clustering. In variable screening, variable clustering methods are mainly used. Variable clustering generally starts from the correlation matrix R of the data. Let the correlation matrix of the data of variable X1, X2, ⋯ , X
p
be:
From the elements of the R matrix, it is transformed to get:
The distance matrix is obtained.
Among them, d ij is not necessarily “distance” in the strict sense, but a generalized distance. It can also be used for clustering.
Principal Component Analysis (PCA) is a method of reducing the number of input variables in statistical analysis, which is usually called “dimensionality reduction". It derives a few comprehensive variables that play a leading role, that is, principal components, from several existing more variables. At the same time, it can determine these comprehensive variables, that is, the magnitude of the main component’s effect on the researched matter or problem. Through the study of principal components, it can not only grasp the key information contained in the original variables, but also reduce the number of variables that need to be concerned, so that the actual application and operation are simplified. We assume that each complete observation in the data to be analyzed has P variables, denoted by X1, X2, ⋯ , X
p
respectively. These P variables constitute a p-dimensional random vector X = (X1, X2, ⋯ , X
p
). The corresponding value of each observation is a value of the random variable x. ∑ is the covariance matrix of the random vector X. Then, according to the theory of higher algebra, there must be an orthogonal matrix u, so that we get:
Λ is the diagonal matrix diag (λ1, λ2, ⋯ , λ
p
), and there is λ1 ⩾ λ2 ⩾ ⋯ ⩾ λ
p
⩾ 0. At this time, the following linear transformation is performed on x, so that:
A new random variable Y = (Y1, Y2, ⋯ , Y p ) can be obtained, and its variance matrix is U′∑U = Λ. The components Y1, Y2, ⋯ , Y p of the random variable Y are uncorrelated, and the variance of Y i is λ i . At this time, we call Y i (with respect to the random variable x) the i-th principal component (i = 1, 2, ⋯ , p). It can be seen from U′∑U = Λ that λ i is the characteristic value of ∑. The value λ i /(λ1 + λ2 + ⋯ + λ p ) is called the contribution value of the main component Y i . The cumulative contribution rate of the first k components Y1, Y2, ⋯ , Y k is (λ1 + λ2 + ⋯ + λ k )/(λ1 + λ2 + ⋯ + λ p ), which is also called the cumulative explained variation ratio. If there is a part of λ1, λ2, ⋯ , λ p with a value of 0, that is, λ r = λr+1 = ⋯ = λ p = 0, then Y r = Yr+1 = ⋯ = Y p is constant and there is no variation. Then, it can usually be ignored in statistical analysis.
Factor analysis promotes principal component analysis, which is also a commonly used method of dimensionality reduction in multivariate statistical analysis. Factor analysis studies the internal dependencies of the correlation matrix or covariance matrix. It integrates multiple variables into a few factors to reproduce the correlation between the original variables and the factors. Factor analysis models include orthogonal and oblique factor models. Here, only the orthogonal factor model is introduced. We set X be a P-dimensional observable random vector, its mean value is vector μ, and the covariance matrix is Var (X) = ∑. If x can be expressed as:
Among them, Λ is the undetermined constant matrix of p × k, f is a k-dimensional random vector (usually k is less than p), u is a p-dimensional random vector, and
Then, the formula (21) that satisfies the conditions of the above formula is called a factor analysis model with k factors for x. f is called a common factor, and u is called a special factor. At the same time, Λ is called the factor load matrix, and its element λ ij is called the load of the i-th variable on the j-th factor.
We assume that the two populations obey the binomial distribution. The proportions of the two populations with a certain number of characteristic units (such as response to events) are π1 and π2, but π1 and π2 are unknown, and sample proportions p1 and p2 can be used instead. The hypothetical expression is:
Under the condition that the null hypothesis holds, the best variance is p (1 - p). Among them, p is the proportion estimator obtained by combining the two samples, that is,
In the formula, x1 represents the number of units with a certain characteristic in sample n1, and x2 represents the number of units with a certain characteristic in sample n2. Under the condition of a large sample, the expression of the statistic z is:
According to the sample data, the value of the statistic z is calculated and compared with the rejection domain to make a decision to accept or reject the null hypothesis.
This paper uses Stata software and empirical testing to study the sales performance effect of Company H’s implementation of big data precision marketing methods for the company. This paper selects appropriate independent variables and dependent variable indicators from the data. After that, this paper uses Stata to establish an OLS model and a fixed effects regression model for empirical testing, so as to evaluate the sales performance effect of the Company H’s implementation of the big data precision marketing strategy for the company. Company H has a total of more than 7,000 traditional channel stores in China, and its business covers 32 important provinces and municipalities across the country, and is divided into four major business areas: North, East, South, and West. Table 1 and Fig. 1 show the star distribution of Company H’s retail stores.
Star distribution of retail stores
Star distribution of retail stores
Statistical diagram of the number of star distributions of retail stores.
Table 1 and Fig. 1 show that the sales direction of company H’s retail stores is divided into retail-oriented and industry-oriented. Retail-oriented represents that retail stores are mainly engaged in the sales of PC products for retail-type personal retail business, and retail sales account for more than 60% of total sales. Industry-based retail stores are mainly engaged in PC product sales for industry-based businesses (business scope mainly includes government, culture and education, enterprises and institutions, etc.), and industry-based business sales account for more than 60% of total sales.
Choose the retail stores under Company H, the different business types, regional distribution, the number of stores with star-level distribution of the store, the monthly average total sales volume and the monthly average total display quantity of retail stores, as follows:
It can be seen from Table 2 and Fig. 2 that the retail stores of Company H are mainly distributed in street stores and ITMALL retail stores. Moreover, in all types of stores, mall stores close to each store can have 1 T-series thin and light notebook products on display every month. The sales performance of corresponding T-series thin and light notebook products in major retail stores is also close to the display performance.
Statistical table of store sales and display of A series products (type of business)

Statistical diagram of store sales and display of A series products (type of business).
From Table 3 and Fig. 3, it can be seen that the retail stores of Company H are mainly distributed in the north, east, south and west areas, and the four business area stores account for more than 70%. From the perspective of the business area as a whole, every 2.4 stores can have 1 T series thin and light notebook products on display every month. Moreover, the sales performance of the corresponding T-series thin and light notebook products in major retail stores is also close to the display performance, that is, one T-series thin and light notebook products are sold every 2.3 stores per month.
Statistical table of store sales and display of A series products (business area distribution)

Statistical diagram of store sales and display of A series products in (business area distribution).
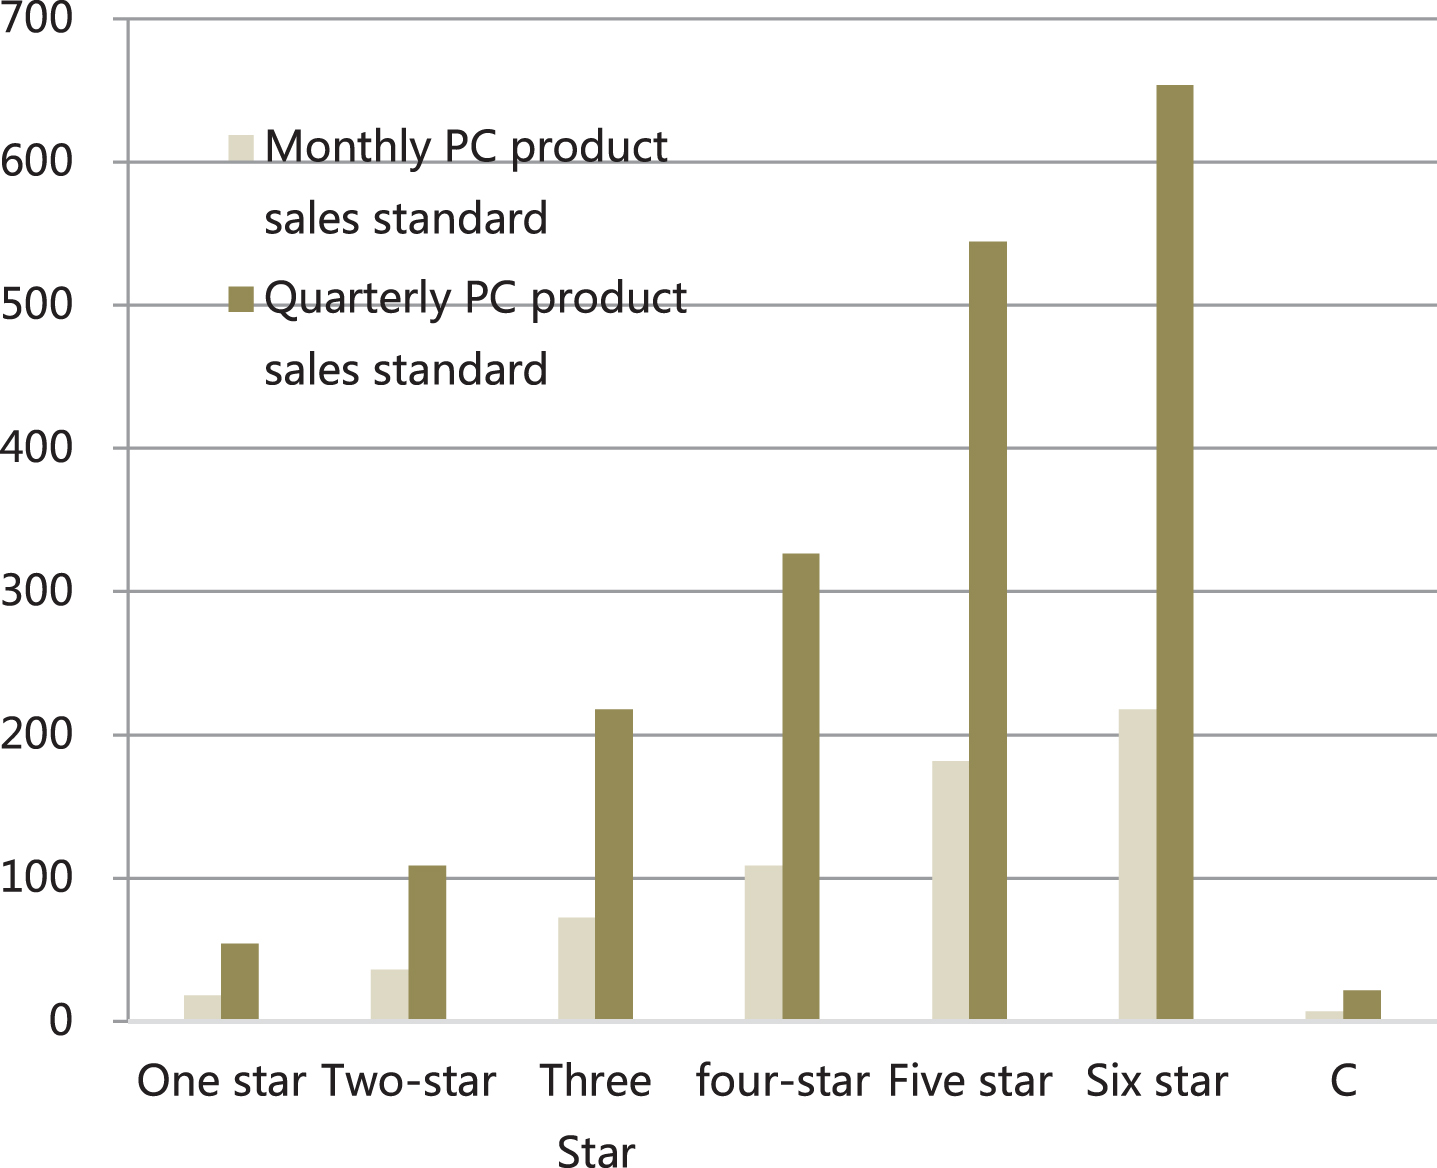
It can be seen from Table 4 and Fig. 4 that the star distribution of company H’s retail stores is dominated by one-star and two-star retail stores, and the total number of one-star and two-star star stores accounted for 78%. From the display performance of T series thin and light notebook products, it can be found that each of the high-star stores (four-star and above) has 1.33 T series thin and light notebook products displayed per month, which is higher than that of T-series thin and light notebook products in other star-rated stores where less than one unit is displayed per month. At the same time, through the above-mentioned data performance, it can also be found that Company H’s definition of star-rated stores comes from the sales performance of retail stores, and high-star stores mean high sales performance. In these retail stores with high sales performance, the display of T-series thin and light notebook products is significantly higher than other star-rated stores, and the corresponding sales of T-series thin and light notebook products are also significantly higher than other star-rated stores.
Statistical table of store sales and display of A series products (store star distribution)

Statistical diagram of store sales and display of T series products (store star distribution).
Next, this paper analyzes the effects of precision marketing. This paper takes the customers of the retail store of H Company as an example and takes the precision marketing effects of 72 portal points as the statistical objects to calculate the accuracy of precision marketing. The results are shown in Table 5 and Fig. 5.
Statistical table of accuracy of precision marketing

Statistical diagram of accuracy of precision marketing.
From the analysis results in Fig. 5, the precision marketing model constructed in this paper has an accuracy rate of over 65% in the experiment, and the accuracy rate ranges from 65% to 85%. Next, this paper analyzes the performance of the model, which is mainly studied from the perspective of model data transmission efficiency and data transmission speed. A total of 45 sets of data are counted. The results are shown in Table 6 and Fig. 6.
Statistical table of model performance
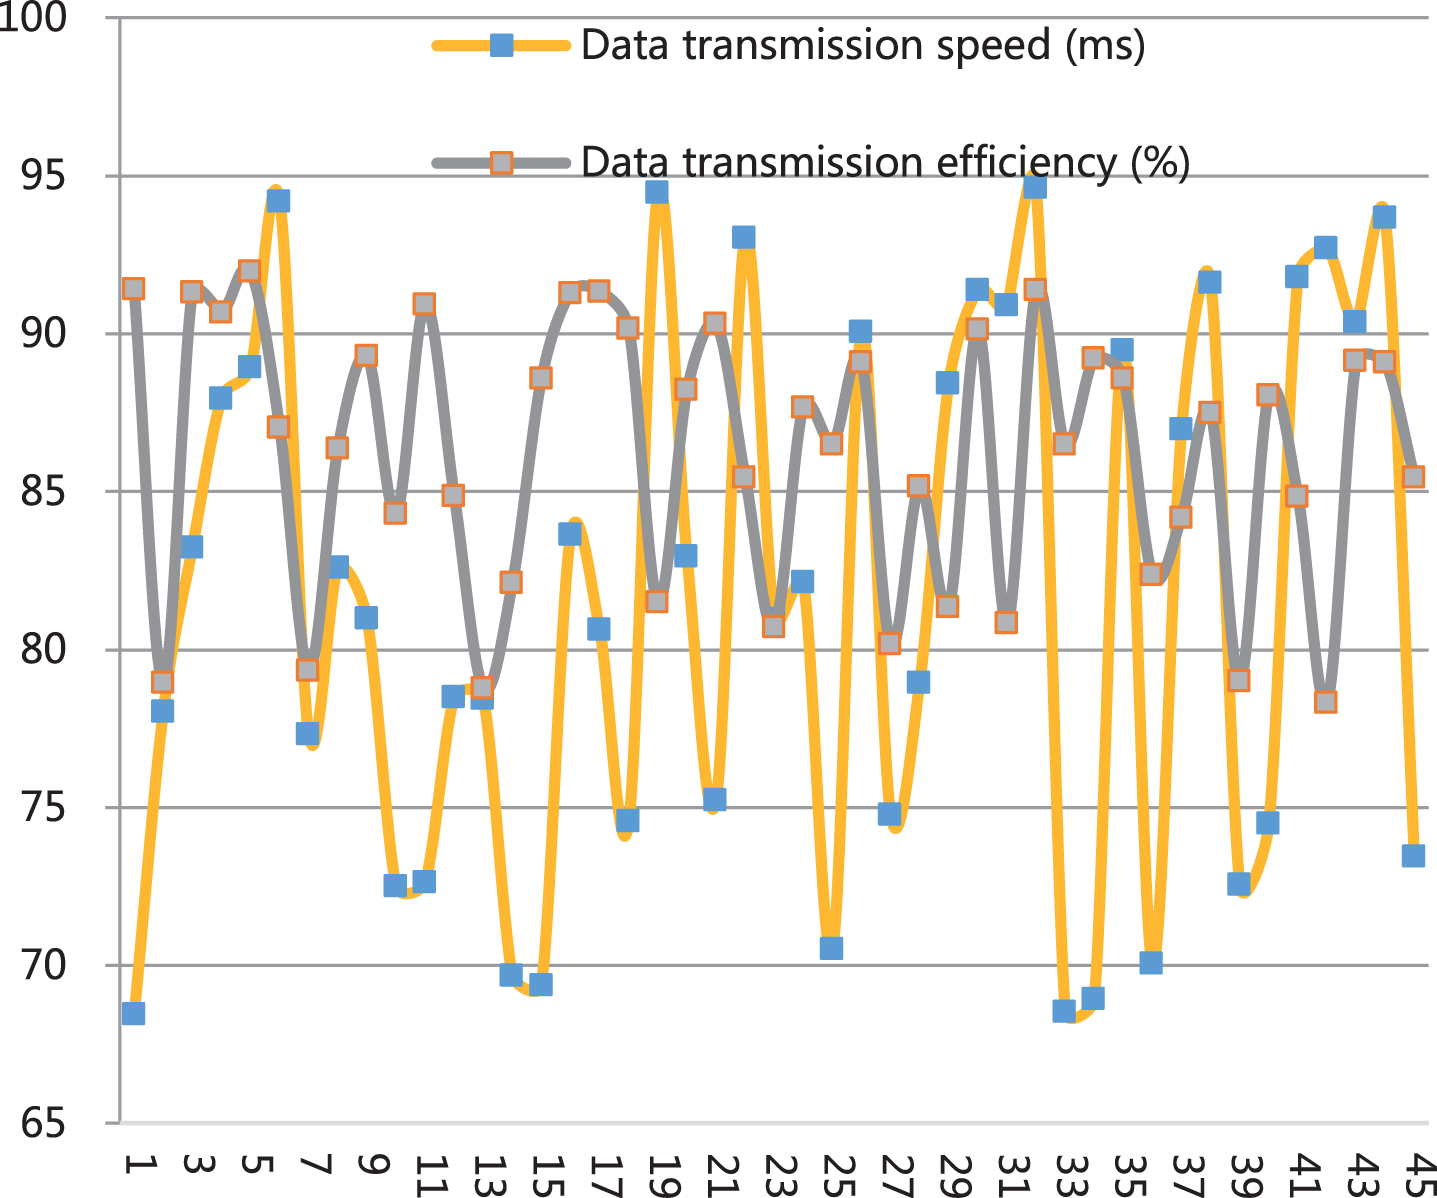
Statistical diagram of model performance.
From the performance statistics in Fig. 6, it can be seen that the model constructed in this paper has good performance and can meet actual needs.
With the development of the Internet and mobile Internet, consumers’ media contact behaviors have gradually become online and fragmented, and their behaviors have also become digitized and informationized. Therefore, precision marketing has increasingly new connotations, and it has become more feasible due to the emergence of big data technology. At the same time, with the development of the popular concept of big data in recent years, segmentation technologies for data collection, storage, and mining have gradually been developed and practiced, and numerous professional organizations have emerged, and segmentation chain entries have become more mature. This means that companies can capture consumers more comprehensively, portray consumers at multiple levels such as basic attributes, consumer behavior, and media contact behavior, and then carry out precision marketing based on big data. Through surveying companies and empirical tests, this paper uses Company H as an example to study the competitive pressures and opportunities faced by traditional PC manufacturers in the thin and light notebook market. Big data can enable companies to master more information, combine big data technology with precision marketing, and use big data precision marketing to influence the formulation of market strategies.