
Abstract
The English online teaching automatic evaluation system is unstable in actual teaching evaluation. Therefore, how the automatic evaluation system can better adapt to high school teaching also needs a more in-depth theoretical and practical discussion. According to the actual needs of English online teaching, this article combines remote supervision and deep learning algorithms, builds a system structure for the English online teaching evaluation process, and simulates and analyzes the application of supervision algorithms in the teaching process. Moreover, this article evaluates the actions and status of the student’s learning process from the aspects of teacher evaluation and student evaluation, and also scores the teacher’s teaching process. In order to study the practical effect of this system in English online teaching, this paper designs experiments to evaluate the model online English teaching effect. The research results show that the model constructed in this paper has good performance.
Introduction
In order to better promote the development of harmonious classrooms, the teaching concept under the perspective of ecology has attracted people’s attention and has been applied in teaching practice. This concept promotes the interaction between teachers and students, establishes a multi-dimensional teaching evaluation method, and emphasizes the overall development of students. Moreover, this concept mainly pursues the concept of sustainable development of natural ecology, which also provides a new way for formative evaluation of online English classrooms. The implementation of the new curriculum standard reform can better reflect the high school English ecological classroom concept. In addition, the new curriculum standard reform examines students’ comprehensive ability to use language, focuses on the cultivation of students’ active learning ability and interest in learning, and emphasizes the overall development of students. In teaching activities, teaching evaluation is a very important part. However, due to various reasons, a complete teaching evaluation mechanism has not been formed, which has affected the development of the entire education. Therefore, in the future development of education, the formation of formative evaluation is an inevitable measure, and reform of formative evaluation is also a necessary measure. It can be seen from this that the ecological classroom concept has both similarities and innovations compared with the new curriculum standard [1].
The combined study of teaching and ecology opens up a whole new perspective when evaluating English classrooms and requires multi-faceted thinking in theoretical research. The study of college English ecological classroom is a relatively new field. Under the existing educational background, it is necessary to promote the implementation of new curriculum standards and better reform of educational curriculum. College students are in a special period, so formative evaluation will have a huge impact on them. In the case of ecological theory as a guide, formative evaluation can solve a variety of situations such as high school classroom boredom and students’ aversion to learning. Moreover, classroom dynamic evaluation can better help students understand themselves, cultivate students’ interest in learning, improve their learning methods, and achieve their overall development. In addition, it can improve the English learning environment, improve the overall teaching quality, and enhance the professional quality of teachers [2].
When conducting research on the classroom, it changed the traditional research model, starting from the perspective of ecology, and carrying out a variety of evaluation methods according to the learning situation of the students; Moreover, this method can provide better teaching suggestions to English online teaching teachers, and can better help them complete their daily work. Secondly, at present, a lot of research is on the fields of junior high school, vocational high school, technical secondary school and university. However, there are few studies on the evaluation of college English teaching. Therefore, the key of this article is how to construct an ecological research perspective in the process of constructing the formative evaluation model of college English classrooms [3].
Related work
For different detection targets, scholars have proposed many models and algorithms for recognition and detection. In particular, in recent years, with the continuous development of deep learning technology, the effect of object detection is getting closer to the effect of human eye recognition, and sometimes the effect of object detection even exceeds the human eye [4]. The steps of traditional object recognition detection are extraction of candidate regions, extraction of feature expressions, and object classification/location. First, the supervised learning method selects some possible object location areas through sliding windows or image segmentation. Then, it uses traditional algorithms or CNN methods to extract regional features to form feature vectors. Finally, it uses a classifier to classify the features of each region, and then obtains the final rectangular frame by means of maximum suppression or border regression. However, although this supervised learning method has a good classification effect, it is difficult to generalize and generalize, and it cannot be used in actual detection scenarios. The reason is that supervised learning needs to know the type and location information of the objects in the picture at the same time, that is, the example-level rectangular frame annotation is required [5]. In addition, this method currently relies on manual labeling. On the one hand, labeling consumes a lot of manpower and material resources, and on the other hand, it is easily subjectively affected. Therefore, weakly supervised object recognition using only image-level annotations has gradually become the research object of people [6]. The traditional weakly supervised detection and recognition is solved by multi-instance learning. In recent years, a group of scholars have found that the trained CNN for classification contains the location information of the object. However, when doing classification tasks, these location information are hidden.
The method of fully supervised learning includes three categories of algorithms. First, traditional methods are defined relative to deep learning. Moreover, it appeared in large numbers before the outbreak of deep learning algorithms, and most of them still characterized the target objects by manually designed features. Traditional commonly used features include SIFT features, HOG features (histogram of direction gradient) and Haar features [7]. The HOG feature comes from the histogram in the gradient direction of the image, which can well describe the contour and shape features of the object, and it is widely used in object detection combined with SVM support vector machineThe algorithm proposed in [8], Later, many scholars used HOG and SVM to solve problems related to pedestrian detection and object detection, and also achieved good results. Since then, some people have made many improvements to the HOG feature. Theliterature [9] combined the HOG feature with the LBP feature to greatly increase the discriminatory information, which not only can detect the overall contour of the pedestrian, but also has a good effect on the details. The SIFT algorithm extracts features by constructing a scale space. The direction of the SIFT feature vector is the main direction of the gradient of the neighborhood of the feature point, which makes SIFT invariant to scale and direction. The literature [10] combined SIFT features and SVM support vector machine to achieve multi-target detection. The SURF algorithm proposed in [11] overcomes the shortcomings of the slow SIFT algorithm, and the overall performance of the algorithm is better. In addition, the traditional features based on manual design have the disadvantages of single feature, complex calculation and poor adaptability.
With more and more image data, big data training deep learning models have received people’s attention. Deep learning has made outstanding contributions in the field of image recognition and detection, in which deep convolutional neural network is an important calculation model. The literature [12] proposed the backward propagation technology in CNN and designed the famous LeNet model for handwriting font recognition. In the ILSVRC competition, the CNN model constructed in the literature [13] has achieved good results, and the best performer in this competition is the AlexNet model. Since then, recognition models based on deep convolutional neural networks have emerged, including the ZFNet model, VGGNet model and Goog-leNet network model [14], ResNet model [15].
For object detection, it is not only necessary to classify the image, but also to locate the image. A common method is to select some possible target areas by sliding window and then classify them. This method obtains some possible object areas in a comprehensive manner, but the entire process takes a long time and requires a huge amount of calculations, so this method will no longer be used slowly. Later, a selection method based on segmentation was generated, such as SS algorithm [16] and EB algorithm [17]. These methods have good segmentation results and can be used as a candidate region selection method. The first object detection algorithm RCNN [18] combines this region segmentation algorithm with deep learning technology to achieve good classification and positioning effects. The region extraction algorithm it uses is a selective search algorithm. The literature [18] designed the SPPNet spatial pyramid pooling network, which overcomes the shortcomings of RCNN that cannot achieve multi-scale image input. Inspired by SPPNet, the literature [19] modified RCNN to obtain Fast-RCNN. It no longer calculates the convolution for each candidate area, but calculates the convolution on the entire image, and uses ROI for feature normalization, which not only does not need to ensure the uniform size of the input image, but also greatly reduces the number of convolutions, and improves the speed of training and testing. The literature [21] proposed the FasterRCNN model on this basis and integrated the region selection into the model to realize the end-to-end structure. The literature [23] talks about the construction of directed acyclic graph for video coding algorithms for motion estimation in parallel reconfigurable computing systems. The partitioning algorithm also plays a key role in optimizing the encoding of images.
The literature [24] dealt with the exploitation of IoT and BigData Analytics using the Hadoop ecosystem in real-time environments. The implementation of IoT-based Smart City is accomplished through the above-mentioned processes. The article [25] centers around IoT and its noteworthy work in sophisticating the human hones and endeavors. This paper moreover overseen the combination of diverse data from distinctive resources that are related with the web. The article [26] talks approximately the different issues within the vehicular communication field with the proposition of agreeable centralized and distributed spectrum detecting model. Due to the execution of the agreeable cognitive model, obstructions and different hidden issues are minimized. The article [27] discusses the problem, such as the tremendous amount of big data, and introduces the SmartBuddy idea of a smart and intelligent world using individual activities and human resources [28, 29].
Graph-based multi-core learning algorithm
The multi-core learning algorithm will be applied to the support vector machine (SVM), and the weight vector p = (p1, ⋯ p m ) of m embedded cores under the SVM framework will be introduced. Specifically, we will first introduce the specific construction process of the graph and the corresponding optimization method based on semi-supervised multi-core learning.
Before solving the Laplacian matrix of graphs, we first discuss some methods of constructing graphs.
We assume that g =〈 v, ɛ 〉 is a graph derived on data space X. Among them [22]:
is the set of all vertices, and ɛ is the set of edges.
Generally, the component graph requires the following two steps: (1) the adjacency graph is constructed (adjacency graph); (2) the weight of the edge is calculated. Among them, there are two types of methods for constructing the adjacency matrix,
Figure ɛ - NN
For ɛ ∈ R+, if d (x
i
, x
j
) ⩾ ɛ, nodes x
i
and x
j
are connected. Among them, d (· , ·) is a distance measurement function, and a commonly used example is Euclidean distance, that is:
Figure k - NN
For ɛ ∈ N+, if node x i is one of the nearest neighbors of node x j , nodes x i and x j are connected. Moreover, the determination of neighbor nodes is also based on the distance metric d (· , ·).
After the graph construction is completed, the adjacency matrix W of the graph is obtained. The next step is to determine the weight of W’s middle edge. Generally, there are two weight selection options.
The simplest solution is to set the weight of all edges to 1, that is, if nodes x
i
and x
j
are connected, then:
The weight is determined by the distance between the nodes. If nodes x
i
and x
j
are connected, we set:
Obviously, the distance measurement function d (· , ·) plays a vital role in the process of constructing the graph. Commonly used distance measurement functions include Euclidean distance, cosine distance, tangent distance, and density-sensitive distance.
After obtaining W, the Laplacian matrix of the graph is calculated, that is:
Among them,
In this section, we will introduce how to use some basic kernel function {k
k
(x, ·) } and the geometric information carried by a large amount of unlabeled data to construct a new kernel function
Among them, ρ is a constant.
If it is assumed that we use SVM as the classifier, the decision function to be searched can be written as
The scenario where multi-core learning is extended to semi-supervised learning can be written as follows:
We first decompose f into a set of functions
Among them,
Among them, p represents the definition domain of the kernel function weights, and the commonly used p is defined as follows,
The constraint on p in the above formula is also commonly referred to as L1 - MKL. However, the scope of our model for solving p is not limited to the L1-norm, but hopes to generalize to other types of norms, such as the L2-norm or any norm. For example, L2 - MKL limits p to a sphere, and the details are as follows:
The following theorem is the dual problem of the problem in formula (11).
Among them,
It should be noted that the calculation of
The structure of graphs plays a vital role in graph-based semi-supervised learning. Moreover, the Laplacian matrix of a graph is completely dependent on the structure of the graph. The reason is that choosing a reasonable graph is an important factor related to learning performance. In this section, we will introduce a method of using the graph-related parameters introduced earlier to select multiple graphs simultaneously, so as to calculate the final Laplacian matrix based on the multiple graphs to improve the accuracy of the data description of the graph.
From the embedded kernel function formula, we found that there are two problems that affect the performance of optimization:
The embedded kernel function is k (· , ·);
The structure of the graph is used to calculate the Laplace matrix L of the graph.
Both the selection of kernel function parameters and the selection of graph parameters are very difficult model selection problems. Cross-validation of these two sets of parameters to select will produce a very high computational complexity. In particular, when the number of training samples is small, the calculation complexity is higher. In order to solve the above problems, in this section, we plan to promote the multi-core learning framework, and at the same time determine the width of the kernel function from some candidate kernel parameter sets and appropriate graph parameter sets.
We set a series of distance metric functions as D = (d1, ⋯ d r ), a series of possible neighbors as K = (k1, ⋯ k2), and the width of the heat kernel as T = (t1, ⋯ t q ). Meanwhile, a set of constructed Laplacian matrices, that is, L i = D i - W i , i = 1, ⋯ , u. Among them, u = r × s × q is the number of all graphs.
In this way, for the i-th graph, i = 1, ⋯ , u, the embedded kernel function based on the j-th basis kernel function can be calculated according to the following formula (j = 1, ⋯ , v is the number of basis kernel functions under the supervised multi-core learning framework):
Under the semi-supervised multi-core learning framework, the number of basic kernel functions is m, m = u × v. Because core
Since multiple basis kernel functions in a set of different graphs are embedded, an optimal kernel matrix is obtained. Therefore, we call this problem of multi-core embedding multi-graphs semi-supervised multi-core multi-graph learning.
For large-scale data sets, the inverse operation of matrix
Among them,
The inverse operation
In this way, the original inversion of the n-order square matrix in the formula is transformed into the inversion of the k-order square matrix. Moreover, because of k ⪡ n, the operation efficiency is improved.
In this section, we will introduce the optimization process for semi-supervised multi-core learning problems.
In recent years, many newly emerging excellent optimization algorithms have been applied to the optimization of large-scale multi-core learning, such as Semi-infinite Linear Programming (SILP), Subgradient Descent (SD) and level Level method, etc. The above methods all adopt the idea of alternating optimization when solving the multi-core learning optimization problem, that is, the optimization process of the multi-core learning problem is divided into two stages. The first stage is the internal loop update, which is mainly to iteratively optimize a standard SVM problem. The second stage is the outer loop, which mainly updates the weight vector p of the kernel function. There are many ways to optimize SVM, and it is also very mature, so this article focuses on how to solve the most weight vector p.
We separately analyze and compare the three previously introduced methods for large-scale multi-core learning: semi-infinite linear programming, sub-gradient descent and level set methods. Then, we choose one of them as a specific method to optimize the kernel weight vector p. Semi-infinite linear programming constructs a tangent plane model for the objective function, and finally updates the weight p of the kernel function by solving a corresponding linear programming problem. The semi-infinite linear programming method can be applied to large-scale multi-core learning scenarios, but its disadvantage is that the convergence speed is slow. This paper solves the training problem of multi-core learning through a simple sub-gradient descent. However, because the sub-gradient descent technique is memoryless, it cannot use the gradient of the previous iteration in the calculation process. However, the information from the previous step is very valuable for speeding up the solution.
The tangent plane model is defined as follows:
Among them, ∇
p
f (p
j
, α
j
) represents the subgradient of f (· , ·) at point (p
i
, α
i
) with respect to p. The k-th element (1 ⩽ k ⩽ m) can be calculated according to the following formula,
Next, we minimize the tangent plane model to obtain an approximate optimal solution,
Because f (p, k) is a convex problem for p, so v actually gives the optimal lower bound of f*.
Unfortunately, the process of solving the problem in the above equation is unstable, and the jitter during iteration is very powerful. In order to overcome the above shortcomings, we need to add a regular term to the original problem, that is, project the problem onto the level set. Before adding regular items, we need to introduce the concept of level set. The definition of level set is as follows,
Among them, ∈ (0, 1) is the equilibrium parameter,
Next, we project the tangent plane to the level set to update the kernel function coefficient p:
We use SVM and TSVM (conducted SVM) and multi-core based support vector machine (SVM-MKL) as comparison algorithms. Among them, TSVM is implemented based on CCCP. Moreover, we tested the performance of the algorithm on the four real datasets USPS, MNIST, Breast and dna datasets.
In order to facilitate visualization, we perform
Schematic diagram of sampling (MNIST data set).
On the USPS dataset, the semi-supervised multi-core learning algorithm proposed in this paper is tested. USPS is a commonly used data set in the field of semi-supervised learning. It is a sample set of digital handwriting scanned from envelopes of the US Postal Service. The original data is stored in the form of bitmaps, containing samples of handwritten digits of different sizes and orientations. However, it is eventually normalized to a grayscale picture (16 × 16) of uniform size. The entire data set contains 7291 training samples, 2007 test samples, a total of 10 categories (numbers 0-9). The details are shown in Table 1.
USPS data statistics
In the specific experiment, we designed four pairs of second-class classification comparison experiments: 1 vs 7, 3 vs 8, 4 vs 7 and 2 vs3 (this pairing is to increase the difficulty of learning, but in actual handwritten numbers these four pairs are easily confused and More difficult to distinguish) to test the performance of semi-supervised multi-core learning. For each classification pair, 700 samples are randomly selected to form all the data of a single group, that is, 1400 samples. Among them, 5% of the sample labels are used as labeled samples, and the remaining 95% are used as unlabeled samples.
In order to verify the algorithm of multi-graph and multi-core, the experiment is divided into the following three steps: Various Laplace diagrams are constructed; The basis kernel function K is calculated; The basis kernel function K is embedded in the Laplace graph to obtain the
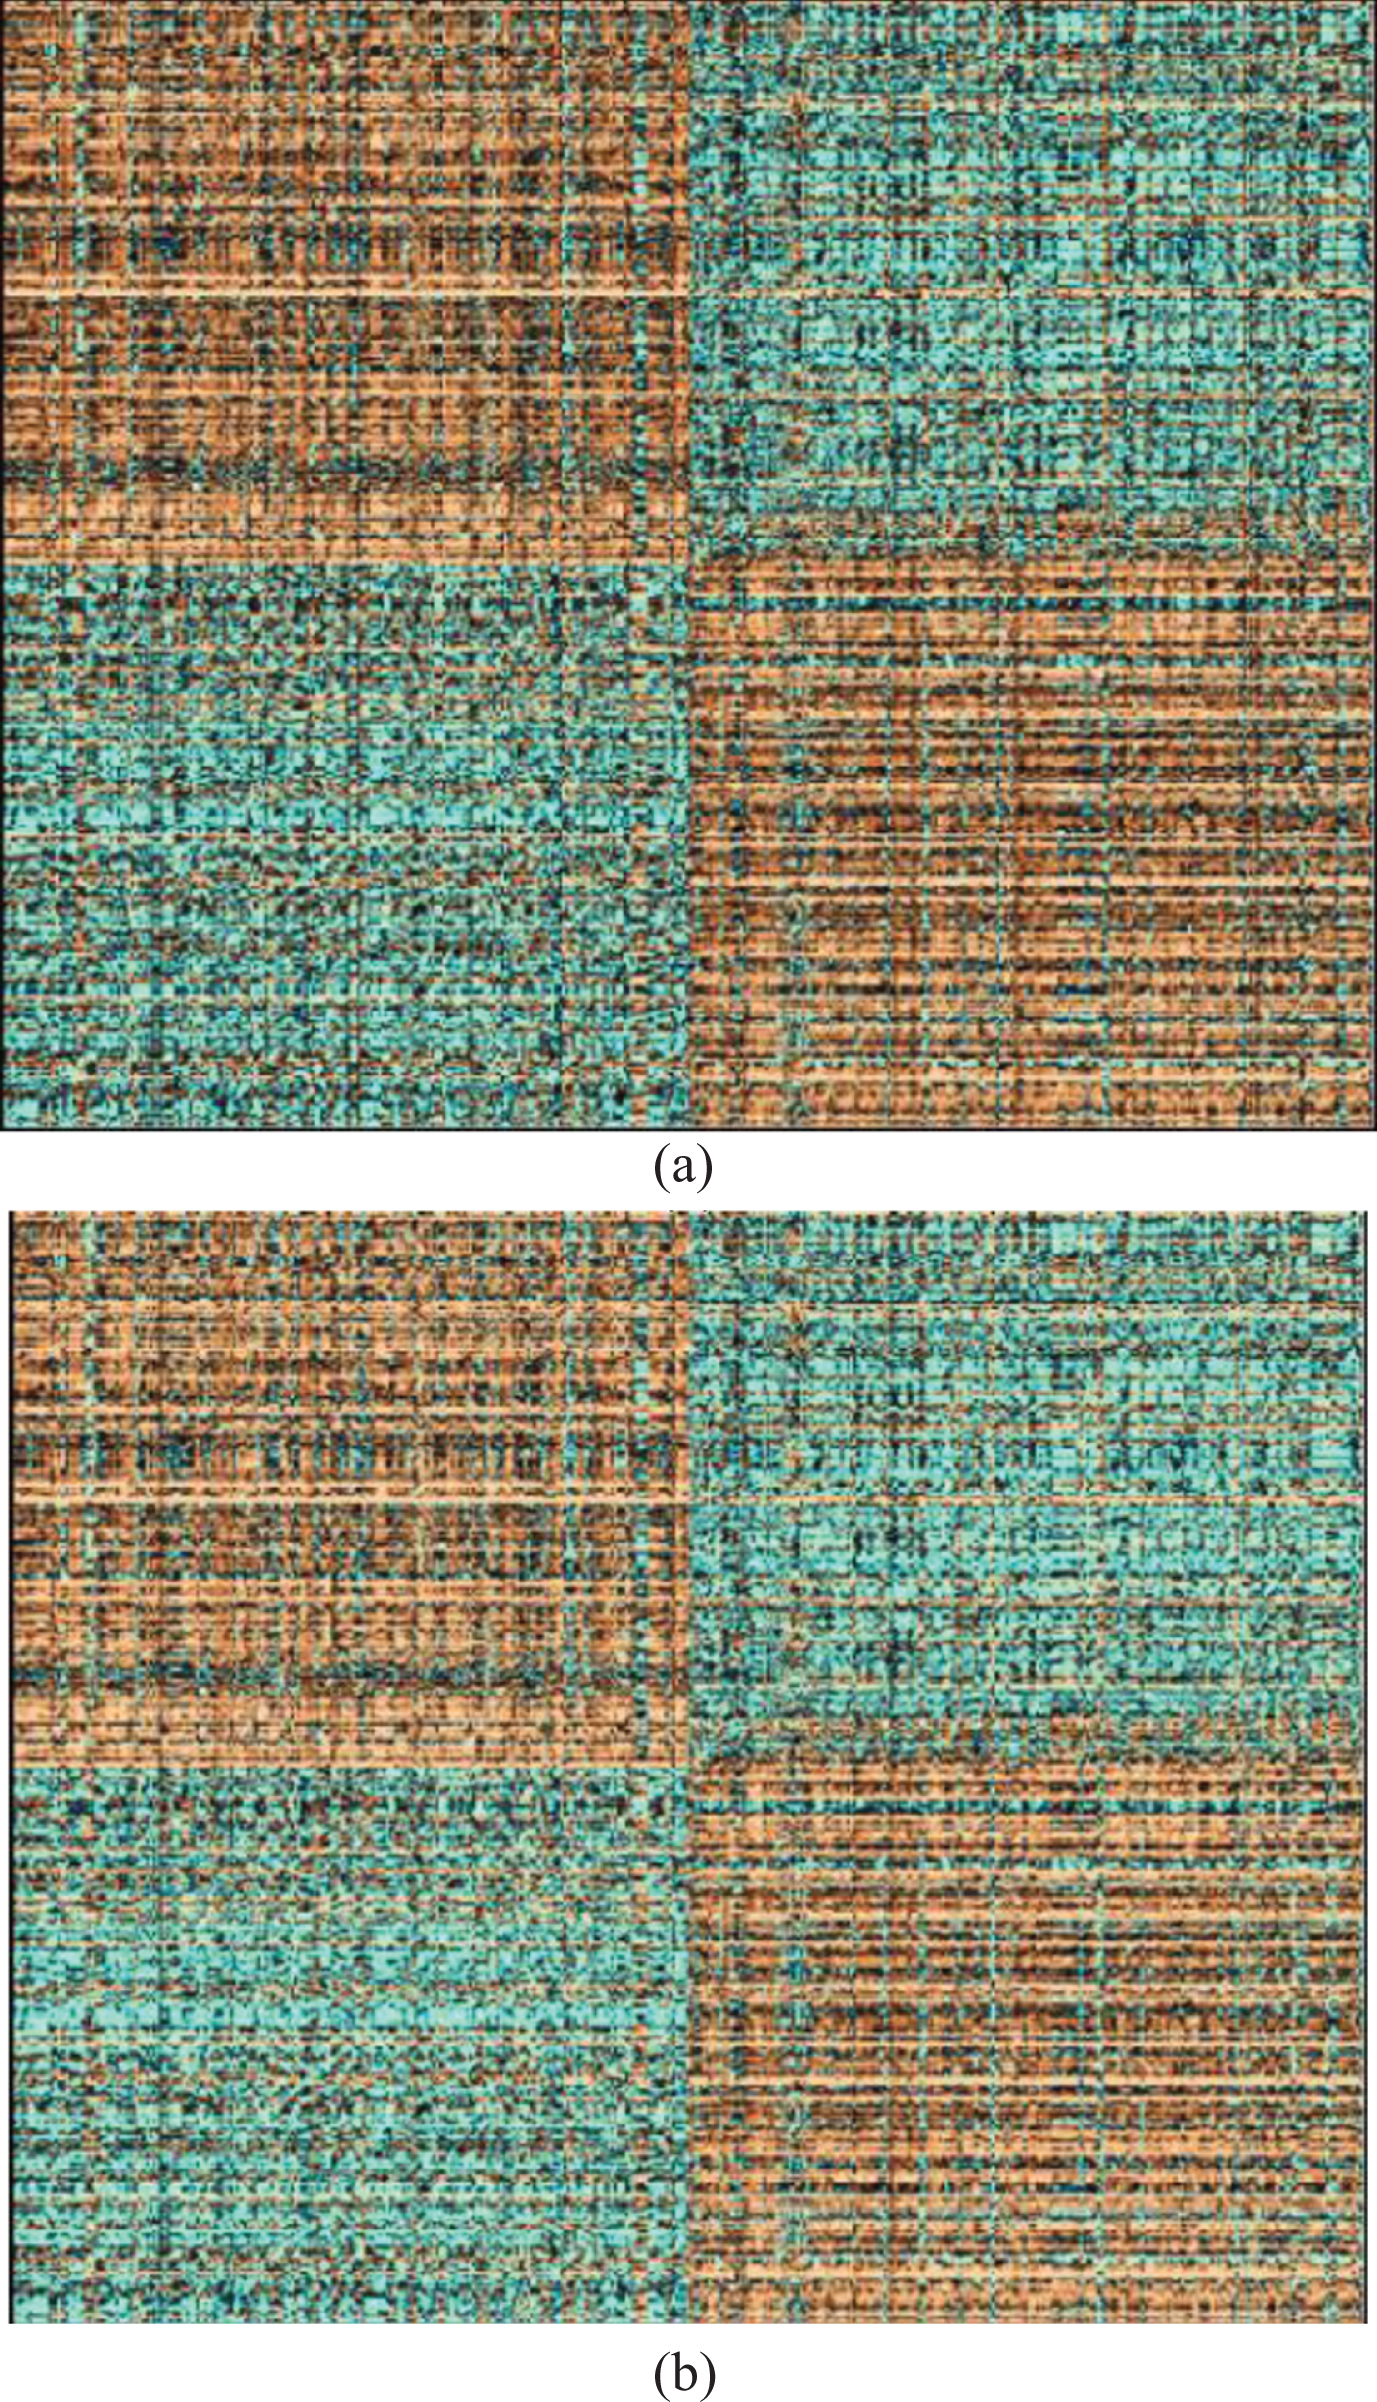
The first step is to construct multiple Laplace diagrams. We construct two Laplace diagrams, ɛ - NN and k - NN (as shown in Fig. 2). Specifically, we first use k - NN to calculate the adjacency matrix of the graph. When calculating the direct distance of nodes, we choose Euclidean distance as the distance metric function. Through the above settings, we can get the Laplace matrix {L j } of a series of graphs.

Two kinds of graphs obtained on the Breast dataset.
After obtaining a series of graphs, the next step is to calculate the basis kernel function K i based on the sample data. In this paper, we choose two commonly used kernels to construct the basis kernel function. The first one is a Gaussian kernel, the candidate set of parameter kernel width is {2-1, 20, 21, 22, 23}, and the other kernel function is a polynomial kernel. Meanwhile, the candidate set of polynomial degree values is {1, 2, 3}.
In the final step, after the basis kernel function is obtained, it is embedded in the series of graphs calculated in the previous step. Finally, a new kernel function
Because the linear kernel has the best performance on the USPS dataset, the linear kernel is selected for both SVM and TSVM. For both comparison algorithms and our algorithm, the parameters are set to 100. Furthermore, each set of experiments was repeated 50 times. Finally, the accuracy and standard deviation of the accuracy of the label prediction are counted, and the results are shown in Fig. 3. It can be seen that in the four groups of experiments, the multi-graph multi-core algorithm proposed in this paper has higher prediction accuracy than SVM, TSVM and SVM-MKL. Among them, the contrast on 2vs 3 is the most obvious. This shows that the multi-graph multi-core learning method can not only find the best kernel function, but also use the geometric information distributed in the data to further improve the prediction performance. It should be noted that the number of our labeled training samples is relatively small (only 5%), which shows that the multi-graph multi-core learning proposed in this paper can work with very limited labeled samples.
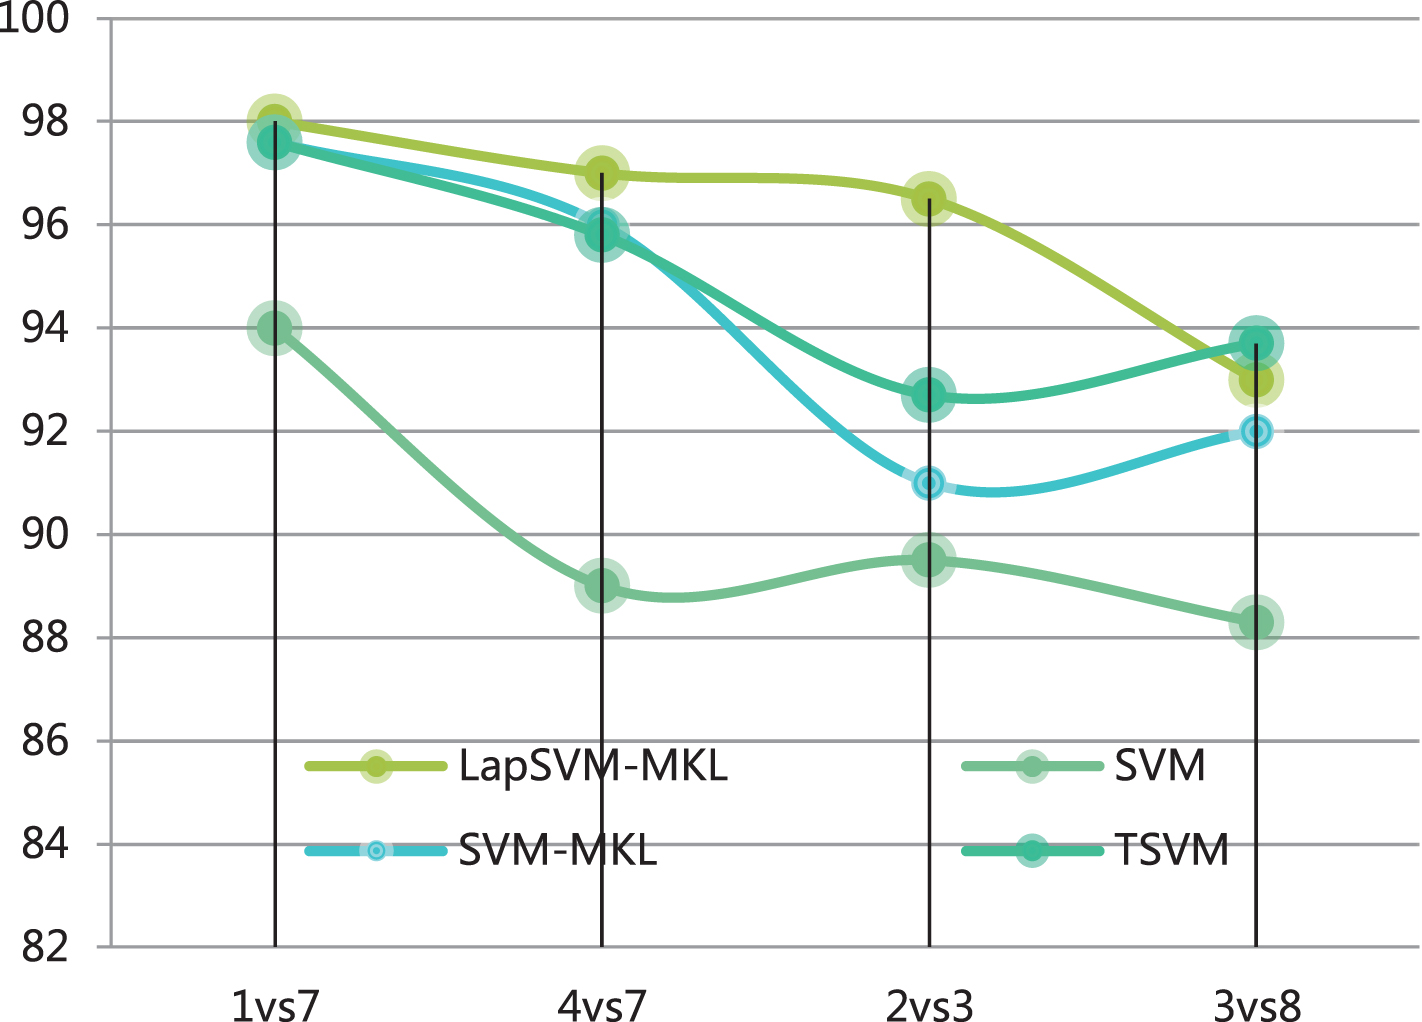
Statistics of prediction accuracy on the USPS dataset.
After that, we test the multi-graph and multi-core algorithm on the MNIST dataset. MNIST is a single digitized picture database of handwritten numeric characters, and each picture is 28 × 28 pixel in size (among them, the digital image area is normalized to the size of 20 × 20), and it contains 70,000 samples.
In the experiment, we still designed four pairs of second-class classification comparison experiments on the MNIST dataset: 1 vs 7, 3 vs 8, 4 vs 7 and 2 vs 3. In each category, 5% of the samples were used as labeled samples, and the remaining 95% were used as unlabeled samples. The construction method of kernel function and graph is consistent with the setting on the USPS data set. Moreover, each group of classification experiments was repeated 50 times. Finally, the accuracy and standard deviation of label prediction are counted, and the results are shown in Fig. 4. We found that the semi-supervised methods (LapSVM-MKL and TSVM) achieved a significant advantage in prediction accuracy over supervised learning when the labeled sample ratio was small. However, the prediction accuracy of the LapSVM-MKL method based on multi-graph and multi-core has achieved the highest accuracy in three of the four experiments (1 vs 7, 4 vs 7 and 2 vs 3).
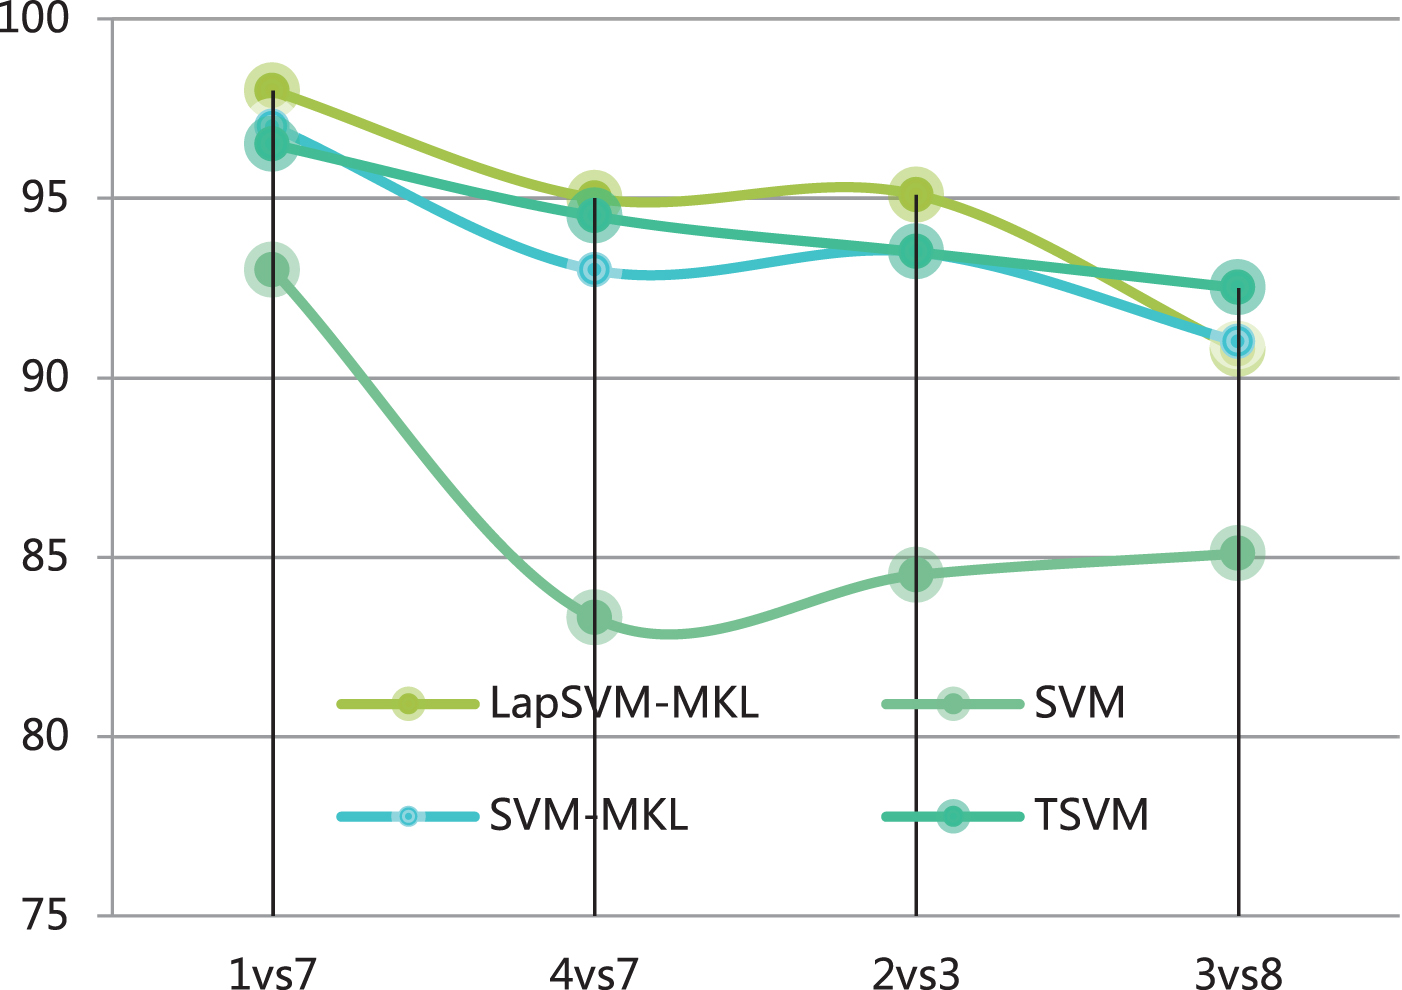
Statistics of prediction accuracy on MNIST handwritten data set.
We test the multi-graph multi-core algorithm on the Breast dataset. Breast contains a total of 683 samples, the sample dimension is 10, there are two types.
In the experiment, 100 samples are randomly selected as the training set, and the construction methods of the kernel function and graph were consistent with the settings on the USPS data set. In addition, each set of classification experiments was repeated 50 times, and the accuracy and standard deviation of label prediction are counted, and the results are shown in Fig. 5. The results show that the multi-core learning methods (LapSVM-MKL and SVM-MKL) have a significant advantage in prediction accuracy over supervised learning when the labeled sample ratio is small.
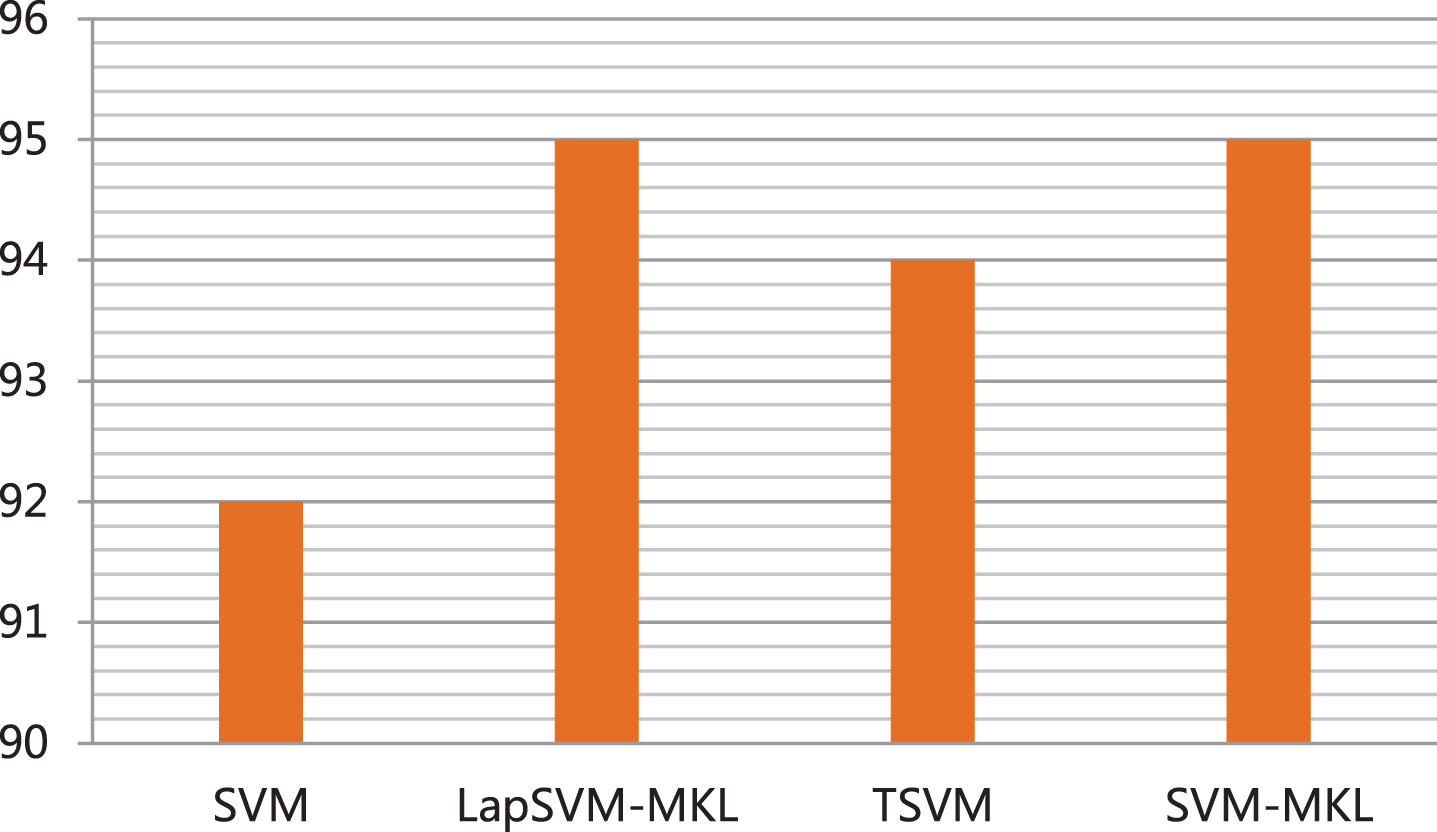
Statistics of prediction accuracy on the Breast dataset.
We test the multi-graph multi-core algorithm on the DNA dataset. The dna dataset contains a total of 2,000 samples, the sample dimension is 180, and there are three types.
In the experiment, 1200 samples were randomly selected as the training set, and the construction methods of the kernel function and graph were consistent with the settings on the USPS data set. Similarly, each group of classification experiments was repeated 50 times. Finally, the accuracy and standard deviation of the label prediction are counted. The results are shown in Fig. 6. We have found that LapSVM-MKL has achieved a significant prediction advantage over other algorithms.

Statistics of prediction accuracy on DNA dataset.
On the basis of the above analysis, this paper analyzes the performance of the model, and combines English online teaching to identify the learning behavior of students. In this paper, a total of 30 students’ English online learning status is studied, and teachers’ teaching effectiveness is evaluated. The results of student action recognition are shown in Table 2 and Fig. 7.
Statistical table of English online teaching students’ behavior recognition results
Statistical table of the behavior recognition results of English online teaching students.
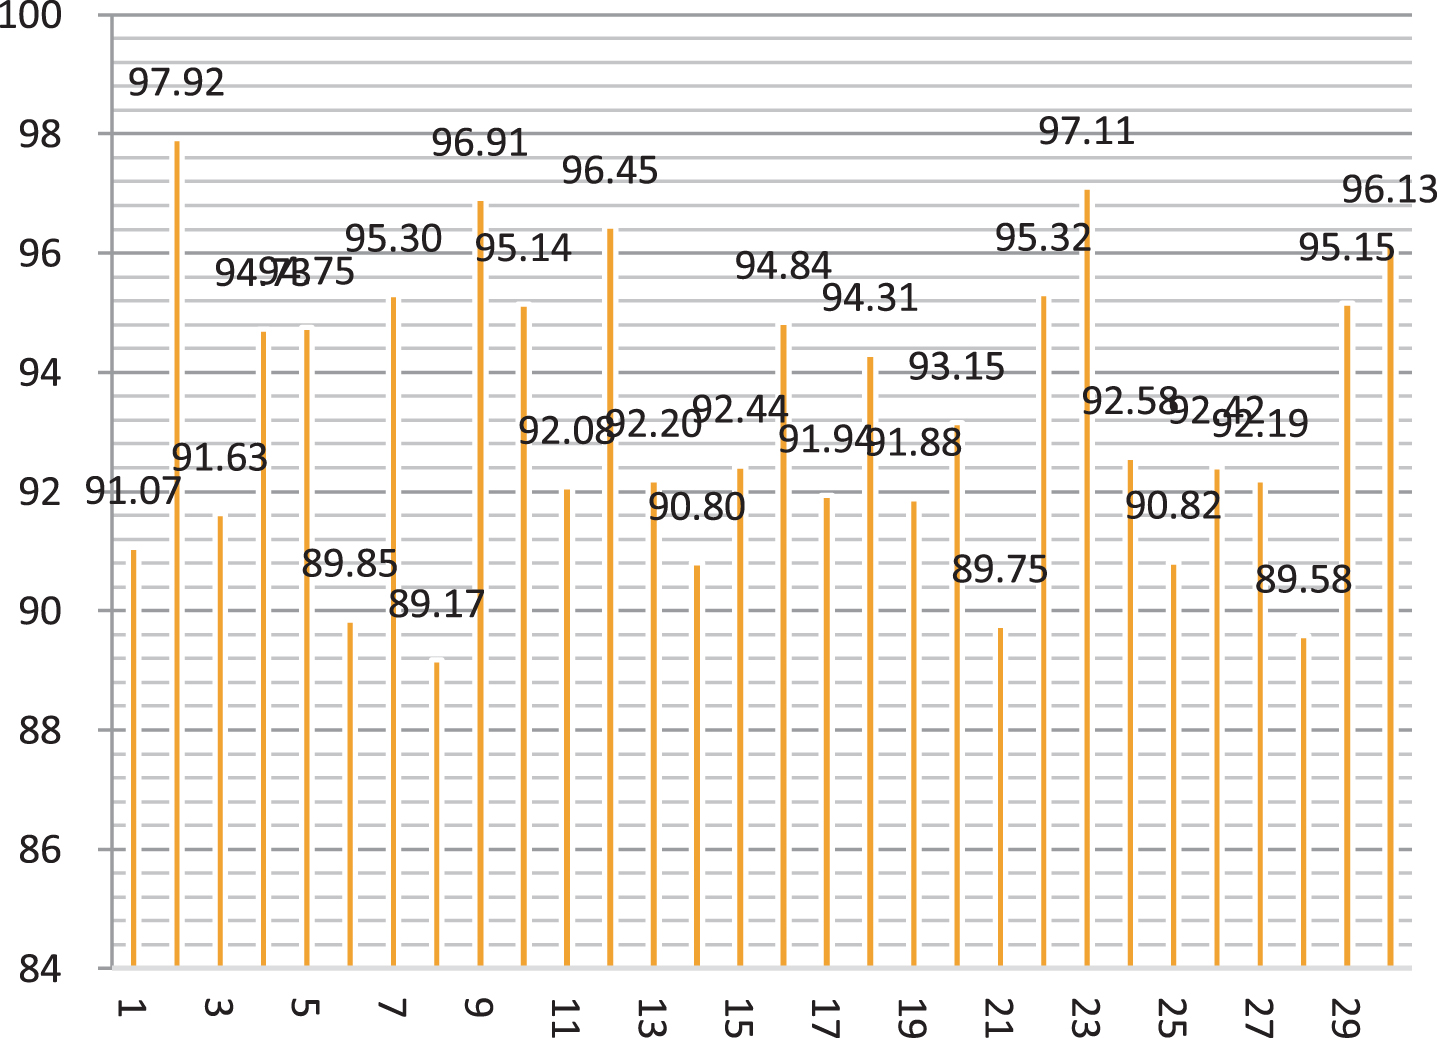
From the above analysis, it can be seen that the model constructed in this paper has a good effect on the recognition of students’ action and behavior. After that, this article evaluates the teaching behavior of teaching. The evaluation is mainly through two methods: evaluation and systematic evaluation. It is believed that the evaluation uses expert evaluation methods, so the artificial evaluation method can be used as a benchmark to analyze the accuracy of the system evaluation. This paper evaluates the teaching situation of 20 teachers, and the evaluation results are shown in Table 3 and Fig. 8.
Evaluation table of teachers’ teaching situation

Evaluation diagram of teacher’s teaching situation.
As shown in Fig. 8, the system constructed in this paper is similar to the results of manual evaluation with an error not exceeding 5%. Since the manual scoring results in this paper are relatively reliable, the results of the system scoring are also relatively reliable. Therefore, it can be considered that the system constructed in this paper has a good effect in the teaching evaluation test, and it can be applied to practical teaching.
In order to build an English online teaching evaluation model, this paper takes graph-based semi-supervised learning as the research background and focuses on solving problems such as semi-supervised multi-label learning and semi-supervised multi-class learning. These problems are very common in the field of machine learning, and there has been a lot of related work. Different from the traditional methods of studying these two problems, this paper combines matrix completion and generative models to reinterpret these two problems from a new perspective and tests the effectiveness on multiple simulations and real data sets.
The topic of this article is semi-supervised learning based on graphs, where the idea of graphs is mainly embodied by modeling the manifold hypothesis of samples. The manifold hypothesis is an inescapable idea in the field of traditional graph-based semi-supervised learning. Moreover, it assumes that the samples are located in a manifold structure, and the labels of two samples that are close to each other in the manifold space should also be the same. The traditional graph-based semi-supervised learning is to directly restrict the parameters when learning the label prediction function. In addition, this paper evaluates the online English teaching effect of the model through design experiments. The research results show that the model constructed in this paper has good performance.