
Abstract
At present, the dairy brand loyalty evaluation model is not perfect, and the dairy brand loyalty measurement model for the consumer-oriented industry needs to be further studied. Through machine learning methods, online consumer brand product purchase behaviors are clustered to achieve clustering of users with similar loyalty and to measure online dairy brand loyalty. This study has the advantages of applying machine learning to processing online consumer big data, that is, it has advantages when processing high-dimensional data, when processing data in multiple ways, and when analyzing data with high complexity algorithms. The independent variables, dependent variables, and adjusted variables in the model are measured in the form of a Likert five-level scale. Moreover, this study combines with actual cases to make adjustments to the measurement of dairy brand loyalty and verifies the model performance through simulation experiments. The research results show that the validity of the scale structure is good, and the research model has certain practical effects.
Introduction
In the new Internet business ecology, consumers have replaced enterprises as the smallest cells of socio-economic activities, and they no longer establish links with businesses but with brands. For enterprises, the huge amount of information consumed online has become a huge gold mine to be developed [1]. It provides more hidden business opportunities, larger consumer groups and broader market segments. The most important thing is that there are more changes in business models, business forms and even business thinking. The modern commercial consumer economy characterized by online consumption big data analysis and processing requires the support of a series of advanced technologies [2]. The value of online consumption of big data lies not in the mass characteristics of data information, but in the professional processing of valuable mass data. The development of advanced technologies represented by computer Internet informationization has provided possibilities for big data collection, analysis, and processing [3]. Online consumption of big data has a large data volume and scale, fast processing speed, diverse data structures and great value. At the same time, online consumption big data also has the characteristics of high dimensions, diverse data processing methods, and high complexity of data analysis algorithms, which makes applying machine learning to process online consumption big data has irreplaceable advantages. Online dairy brand loyalty has an extremely important position in the field of online consumer marketing, and it is of great significance to stimulate consumption and enhance the competitiveness of enterprises in the field of online consumer marketing. Therefore, in the context of the “new economy” represented by the Internet economy, it is urgent and necessary to apply scientific and effective machine learning methods to systematically analyze and research online dairy brand loyalty [4].
Chinese dairy production should have a competitive advantage due to the availability of abundant labor resources and feed, as well as continuous improvement in the processing technology of dairy enterprises. The purpose of this research is to build an artificial intelligence model in the era of big data consumption online, that is, machine learning model. Through machine learning methods, online consumer brand product purchase behaviors are clustered to achieve clustering of users with similar loyalty and achieve online dairy brand loyalty measurement. Among them, the research focuses on machine learning paths, machine learning algorithms, model construction methods, and model inspection and optimization methods.
Related work
Dairy brand loyalty has always been a hot topic in marketing. In particular, in the age of the mobile Internet where information search is extremely convenient, social marketing itself is an evolved thinking concept: from one-way communication to social communication and from corporate monologues to direct dialogue between companies and consumers. The right to speak is no longer on the corporate side, but on the public side. Only by cultivating the loyal users of the brand can the company have a sustainable competitive advantage and the highest return on marketing investment [5].
From a brand perspective, traditional research suggests that brand satisfaction based on the ECSI model is a direct factor leading to dairy brand loyalty [6], and corporate image and perceived quality directly affect customer satisfaction, which in turn affects customer loyalty. However, the reality is that customer satisfaction does not necessarily lead to customer retention and customer retention [7]. At the same time, dissatisfied customers will maintain high dairy brand loyalty due to high conversion costs [8]. Therefore, customer satisfaction is not an ideal variable to measure dairy brand loyalty. The emergence of brand communities has opened up new channels for the study of dairy brand loyalty. The study found that companies can gain customer loyalty to brands through brand communities. The literature [9] believed that the consumer’s identification with the brand will have a direct and significant impact on the purchase behavior of the brand’s related products, so it proposes a theoretical model of “community self-building-brand identity-dairy brand loyalty". The literature [10] added the factor of consumer experience on the basis of the original model. He believed that the community experience brought about by participating in community activities and the communication of community members makes the relationship between members closer, and significantly improves loyalty to the brand on the basis of strong community identification and community awareness. However, whether it is customer satisfaction or brand identity or community awareness, the prerequisites are the unique values possessed by a particular brand community. In the final analysis, research on communities is to explore the fundamental factors that directly affect their behavior and willingness from the perspective of community members. The realization of user-centeredness has truly achieved the previous “customer first”. The reason why a customer is loyal to a particular brand is that the brand can maximize his benefits. Therefore, the perceived value of customers is the most important determinant of dairy brand loyalty. Scholars represented by Blackwell proposed the “value-loyalty” model from the most fundamental driving factor of dairy brand loyalty, namely, value. Through research and analysis of different industries, it is proposed that the perceived value of customers plays a decisive role in customers’ willingness to repurchase. Consumer value is the cornerstone of successful transactions, and it motivates consumers to repeat purchases. The paradigm of uncertainty of expectations indicates that consumers have better value expectations through their experience of product satisfaction and tend to repurchase the product rather than convert it in the future [11]. The literature [12] hold that dairy brand loyalty is generated by measuring the perceived gains and losses of a brand. The value-loyalty model has been widely recognized by scholars and has been empirically verified. However, in subsequent research, scholars found that in addition to the direct effect of community value on dairy brand loyalty, it also indirectly affects the realization of dairy brand loyalty through other factors. The most representative of them is the study of community awareness, which mainly includes three dimensions of community satisfaction, community belonging, and community commitment [13]. The literature [14] researched the community of automobile brands and found that the value of consumers is positively affecting brand community awareness, which in turn affects dairy brand loyalty, and community awareness plays an intermediary role in this. Only by forming a subjective community awareness, feeling identity in the community, being satisfied with the members of the community and the platform used, and willing to stay in the community and contribute to the community, can it further develop loyalty to the brand. However, the existing research only assumes the relationship premise of the brand community and does not realize that there are also strong and weak relationships in the community. The research on dairy brand loyalty believes that it is necessary to consider this individual heterogeneity [15]. Moreover, the model assumptions and verifications of the research objects may not be as expected due to the aggregation bias of the samples and the effectiveness of the marketing activities. Compared with mass marketing, targeted marketing may affect consumer attitudes and behaviors more effectively. Therefore, the different roles of strong and weak relationships should be considered in the analysis of dairy brand loyalty. The brand community is based on the relationship network formed by specific brands and provides a platform for consumers to enhance friendship through brand community activities [16]. According to the embedding theory, consumers’ behaviors are embedded in their network relationships, and the structure and network density in social networks can affect individual behaviors and attitudes. In recent years, some scholars have tried to study brand communities from the perspective of social networks. The literature [17] proposed that the brand community social network will affect members ‘emotional attachment to the community, and then affect the community members’ willingness to maintain brand relationships, information sharing and repurchase. The literature [18] believed that the relationships in the brand community can be divided into weak relationships based on equivalent exchanges and strong relationships based on unequal exchanges according to the theory of social exchange. The former focuses on reciprocity, and the latter focuses on emotions. The relationship between the two will have different effects on consumer behavior and attitudes. The literature [19] analyzed the number of strong and weak relationships in the community and found that strong relationships promote the information and social value of the community, while weak relationships do not. The article [21] implementated IoT-based Smart City is achieved by exploiting IoT and BigData Analytics using Hadoop ecosystem in real time environments. The article [22] reflects on IoT and its main role in the development of human behaviors and actions. The paper also deals with the compilation of various data from different databases connected to the Internet. The literature [23] addresses the numerous issues in the field of vehicle communication with the suggestion for a mutual unified and dispersed spectrum sensing model. The introduction of a mutual cognitive paradigm minimizes conflict and multiple unknown problems. The literature [24] discusses the issue, such as large amount of bigdata, and introduces the SmartBuddy framework for creating smart and adaptive ecosystems using human behaviors and human dynamics. The article [25] talks around the development of coordinated non-cyclic chart for video coding calculations for movement estimation in parallel reconfigurable computing frameworks. The partitioning algorithm moreover plays a key part in optimizing the encoding of images [26, 27].
Related definitions of the algorithm
Fuzzy Joint Points Method (FJP) is a new type of fuzzy clustering algorithm that has appeared in recent years. Unlike the KNN (K-Nearest Neighbor) algorithm and the K-Means algorithm, neither version of the FJP algorithm does not need to pre-specify the number of cluster classes: The data set is used to calculate the fuzzy similarity matrix using the Euclidean distance function, and then the transitive closure T′ is obtained from the fuzzy similarity matrix using the catch-upsquare method. The range of the threshold α is [min(T′) , max (T′)]. After that, the division interval Δ α is determined. The threshold α decays at intervals of Δ α. At each α-division level, the Clusters sub-algorithm is used to cluster the transitive closure to remove relevant noise points. Finally, the number of clusters Z with the highest frequency of clustering clusters at all α division levels is recorded, and the data set is clustered at the α division level corresponding to the number of clusters Z to obtain the final clustering result. Before introducing the two versions of the algorithm in detail, the relevant definitions of the FJP algorithm are introduced first.
In cluster analysis, for a given data sample set, X ={ x1, x2, ⋯ , x
n
}. Among them, n is the total number of data samples, and x
i
∈ R
m
where m is the dimension of the sample. The corresponding fuzzy similarity matrix should be established first according to the attributes of the research object itself. The fuzzy similarity matrix T of the data set x is a matrix of n × n, and the element t (i, j) in the matrix represents the degree of similarity between the samples x
i
and x
j
, which can be calculated in many different ways [21]. The calculation of t (i, j) mainly includes Euclidean distance function, Chebyshev distance function, Markov distance function and kernel function. The FJP algorithm uses the Euclidean distance function, that is,
d (x
i
, x
j
) is the Euclidean distance between samples x
i
and x
j
n. The fuzzy similarity t (i, j) of the data elements x
i
and x
j
is:
The similarity matrix of the data set X is established from the fuzzy similarity between each data element as:
Conical fuzzy point set: The conical data point set A = (a, R) ∈ F (X) is a fuzzy set, where a is the center of the conical fuzzy point set A, R is the radius of the fuzzy set A, and F (X) represents all conical fuzzy point sets in the data set X. The elements x in the data set X are divided into corresponding conical fuzzy point sets according to the membership function, and all elements divided into the same set constitute a conical fuzzy point set. The calculation formula of membership function is expressed by the formula as:
The spatial structure of the conical fuzzy point set is shown in Fig. 1.
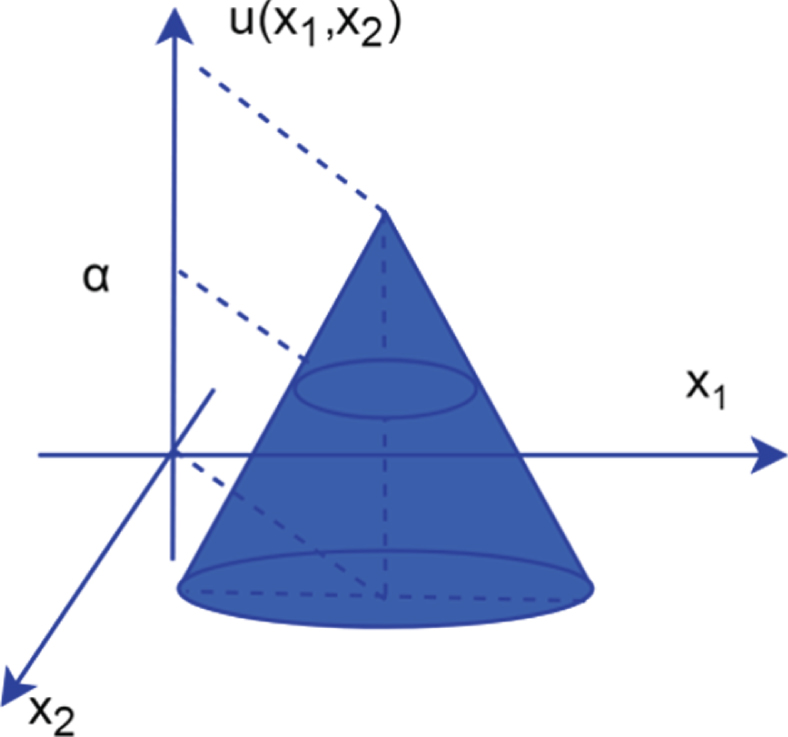
Conical fuzzy point set A in two-dimensional space.
Therefore, the definition of the α division level of the conical fuzzy point set A = (a, R) is as follows:
There are two conical fuzzy point sets A = (a, R) and B = (b, R), and both A and B belong to the data set X. The fuzzy relationship T between any two elements in the data set X is defined: X × X → [0, 1]. The measure of this relationship is expressed by the following formula:
Among them, a and b belong to the central points of the fuzzy data sets A and B, respectively, and their structures in a two-dimensional space are shown in Fig. 2.
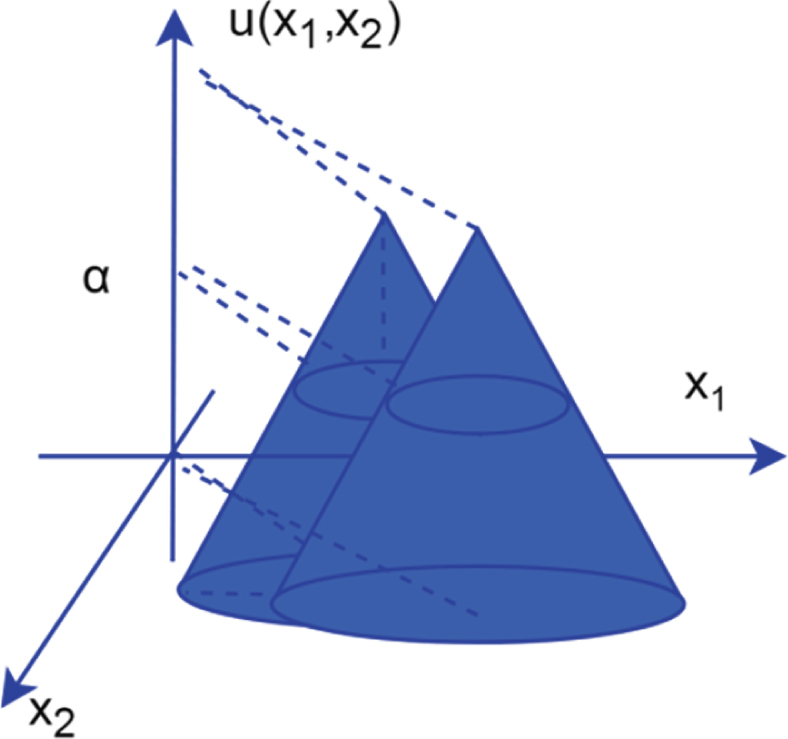
Conical fuzzy point set A and Bin two-dimensional space.
Obviously, the fuzzy relation T is reflexive and has T (A, A) = 1. When T (a, b) ∈ (0, 1], the following formula holds:
Obviously, the fuzzy relation T is reflexive, ∀A ∈ X, and T (A, A) = 1. α- adjacent conical fuzzy point set: A ∈ F (E
p
) and B ∈ F (E
p
). If a value of α ∈ (0, 1] is given, then the following inequality holds:
At this time, the data sets A and B are the α- adjacent conical fuzzy point set, A ∼ αB.
α- adjacent conical fuzzy point set: In the data set x, when a value of α ∈ (0, 1] is given, then there will be a series of α- adjacent conical fuzzy point set C1, C2, C3, ⋯ , C
k
, k ⩾ 0, and satisfy
Among them, d (a, b) is the distance between the central points of the fuzzy sets A and B, and is also a necessary and sufficient condition for the equation to hold:
A and B are sufficient and necessary conditions of conical fuzzy α- connected point set.
According to the theory of fuzzy mathematics, after determining the transitive closure T′ of the fuzzy similarity matrix, the given γ is divided. If T′ (i, j) ⩾ γ, the sample x i and x j can be considered to be in the same cluster. When γ = 1, it means that all data samples are independent into a cluster, and when γ = 0, it means that all data samples are only divided into one category. As γ gradually decreases from 1 to 0, the elements contained in the classification determined by the F equivalence relationship (transitive closure) change from less to more, gradually merge, and finally become a class. When γ decays to what value, its optimal clustering is the key to clustering.
In fuzzy clustering, how to determine the level of γ to determine the optimal number of clusters c is called the clustering validity problem. Currently, there are many Cluster Validity Indexes (CVIs) that can be used to analyze clustering results and determine the optimal number of clusters. This type of index performs cluster analysis by selecting different numbers of clusters, and then selects the best clustering result according to the CVI. The indicators mainly include Davies-Bouldin (DB) indicator, In-Group Proportion (IGP) indicator, Wint indicator, Calinski-Harabasz (CH) indicator and VCN indicator.
The David-Bouldin index is also called classification suitability index, and the DBI measures the average value of the maximum similarity of each cluster class. The smaller the result, the lower the similarity between classes. Moreover, the number of classes corresponding to its minimum value is taken as the optimal number of clusters. It is defined by the following formula. In the formula, N is the number of categories, and
The IGP indicator is an evaluation indicator proposed by Kapp. This indicator uses the ratio of the samples to the same class as their nearest neighbors to measure the pros and cons of the clustering results. The larger the indicator value, the higher the probability that the sample and its nearest neighbors are classified into the same class. Moreover, the number of classes corresponding to its maximum value is taken as the optimal number of clusters. It is defined by the following formula. In the formula, N is the number of categories, and igp (i, X) represents the index value of the i-th category in the data set X.
The Wint index is also called the weighted intra-class similarity ratio. The maximum number of classes corresponds to the optimal number of clusters. It is defined by the following formula. In the formula, N is the number of categories, n
i
is the number of samples in cluster C
i
, and n
j
is the number of samples in cluster C
j
.
The CH index is derived from the ratio of out-of-class separation to in-class compactness. Therefore, the larger the value of CH, the closer the elements within the class are, and the more dispersed between the classes. Moreover, the number of classes corresponding to its maximum value is the optimal number of clusters. It is defined by the following formula. In the formula, k represents the current class label, and n represents the number of classes.
The VCN (Internal validity index based on the cluster center and the nearest neighbor cluster) index is also called the effective neighbor cluster index. Its main evaluation factor is the similarity between clusters and within the cluster, reflecting the compactness within the cluster and the alienation between the clusters. VCN is equal to the ratio of difference between the minimum inter-cluster distance and the intra-cluster distance to the largest value of the minimum inter-cluster distance and the intra-cluster distance of an element in the division result. The distance in the indicator is calculated using the Euclidean distance formula. The average value is calculated by calculating the VCN index of all elements of the clustering result, and finally the maximum value is selected by integrating all the average values. The larger the index value is, the more similar the elements in the cluster are under the partition result, and the larger the difference between different cluster classes is. It is defined by the following formula. In the formula, k and j represent cluster labels,
The kernel function is used to calculate the fuzzy similarity and the intra-cluster distance and inter-cluster distance in the VCN index. The kernel function can solve the problem of very strong non-linearity in the data set, change linearly inseparable data elements into linearly separable, and reduce the computational complexity. There are many types of kernel functions. At present, the most studied kernel functions are the following four types: Linear Kernel Function (Linear)
Polynomial kernel function (Polynomial):
Gaussian radial basis kernel function (Radial basis function)
In practice, we often use another form of it, that is,
Sigmoid kernel function (Sigmoid):
In the formula, λ, r, d or σ is a parameter of the kernel function, and they need to be manually input during calculation.
Among these four kernel functions, in this chapter, a Gaussian radial basis kernel function with a small amount of calculation and high performance is selected to calculate the similarity between various elements, as shown in the following formula:
The Gaussian radial basis kernel function can map the low-dimensional relationships between data to multi-dimensional space and enhance the relationships between data. The performance of the Gaussian kernel function is affected by the size of the parameter δ. For a specific sample set, the function can achieve a good expected effect only if the appropriate δ is selected. In the process of δ gradually increasing from zero, the clustering effect of the Gaussian radial basis kernel function goes from low to high and then decreases. The parameter σ of the kernel function in this chapter is determined by the kernel limit learning machine of the K interpolation simplex method.
The VCN index can evaluate the effectiveness of the clustering results at each α partition level in the FJP algorithm, and automatically select the α partition level corresponding to the largest VCN index value from all clustering results, thereby avoiding the problem that the FJP algorithm cannot automatically determine the inaccuracy of the highest number of clusters and the optimal division level. The traditional VCN indicator uses Euclidean distance to measure the sample distance. In two-dimensional data sets, this calculation method is simple and efficient, but when processing data sets with high attributes, the differences between data elements are often ignored, which will cause data distortion and increase the error rate. However, the Gaussian radial basis kernel function can map the relationship between data from low-dimensional to multi-dimensional space and enhance the relationship between data. Therefore, in this chapter, a modified version of the VCN indicator using the Gaussian radial basis kernel function is adopted, namely the Kemels-VCN indicator. Finally, the feasibility of the adaptive FJP clustering algorithm based on effective neighbor clusters (VCN) is verified in real UCI and artificial data sets.
In the formula, k and j represent cluster labels,
In the formula,
From Definition 1, it can be known that calculating the minimum inter-cluster distance requires the data set to be clustered into at least two categories, so the Kernels-VCN index is not applicable to a data set with a cluster number of 1.
The Kernels-VCN index reflects the clustering effectiveness of a single data element, so the sum of the Kemels-VCN index values of all data elements in the clustering result needs to be calculated, and the average value avgKernels - VCN (k) is then obtained to analyze the overall clustering effect of the data set. The criterion for evaluating the effectiveness of clustering is that in the clustering results, the closer the data elements in the same cluster are, the better the effectiveness is, and the more alienated the data elements in different clusters are, the better the effectiveness is. Therefore, when using the Kernels-VCN indicator, the larger the distance wd (j, i) within the cluster, the closer the data elements within the cluster are. The smaller the minimum cluster distance bd (j, i), the more distant the data elements of different clusters. Considering the evaluation criteria comprehensively, the difference between the intra-cluster distance and the minimum inter-cluster distance and the ratio of the minimum inter-cluster distance to the maximum value within the cluster are used to reflect the clustering effect. The range of Kernels-VCN index value is [- 1, 1]. When the minimum inter-cluster distance of the data elements is small enough to be negligible compared to the intra-cluster distance, the value of the index avgKernels - VCN is approximately 1, indicating that the data set is correctly clustered at this time. When the minimum inter-cluster distance of the data elements is sufficiently large and much larger than the intra-cluster distance, the value of the avgKernels - VCN index is approximately -1, indicating that the data set is incorrectly clustered at this time. Obviously, each division result corresponds to a avgKernels - VCN, and the clustering result corresponding to the maximum value of avgKernels - VCN among all the division results is the best clustering result, and the corresponding clustering number is the optimal clustering number. The data set avgKernels - VCN (k) and the optimal cluster number k
opt
when the number of clusters is k are defined by formulas (24) and (25).
The independent variables, dependent variables, and adjusted variables in this research model are all measured in the form of Likert five-level scales. The measurement terms of each variable are derived from the related literature research and adjusted according to the research purpose and content of this article. This research content was revised and adjusted to obtain the measurement question of dairy brand loyalty. Brand Attitude Loyalty Question as show in Table 1.
Brand Attitude Loyalty Question
Brand Attitude Loyalty Question
In the small sample test, 60 college students are randomly selected as samples for pre-investigation, which ensured consistency with the formal experimental samples. Sixty samples were randomly divided into four groups of 15 person each. Males and females each accounted for 50% of the total sample size. SPSS statistical software was used for descriptive statistical analysis of the data. The results are shown in Table 2.
Descriptive Statistical data
The statistics of standard deviation, skewness, and kurtosis are shown in Fig. 3.

Statistical diagram of standard deviation, skewness, and kurtosis.
It can be seen from the reliability analysis results of the dairy brand loyalty measure that the overall Cronbach’s coefficient α is greater than 0.7, and the CITC values of the 10 measurement terms are all greater than 0.35. The α coefficient do not increase significantly after deleting each measurement clause, so the reliability of the scale meets the research requirements. In terms of validity analysis, the KMO value was 0.707 greater than 0.7, the significance probability was P = 0.000, and the Bartlett sphericity test chi-square value was 197.427, indicating that it is suitable for factor analysis. Through factor analysis, it was found that the two factors were 3.752 and 1.430, both of which were greater than 1. The factor load for each measurement clause is greater than 0.5, and the cumulative interpretation variance is 64.162%, 57.145%, and greater than 50%. Moreover, each factor corresponds to the two dimensions of attitude loyalty and behavioral loyalty in the scale. This shows that the division of the two dimensions of the brand is more reasonable and the structural validity is good. The analysis results of the dairy brand loyalty scale are shown in Fig. 4.
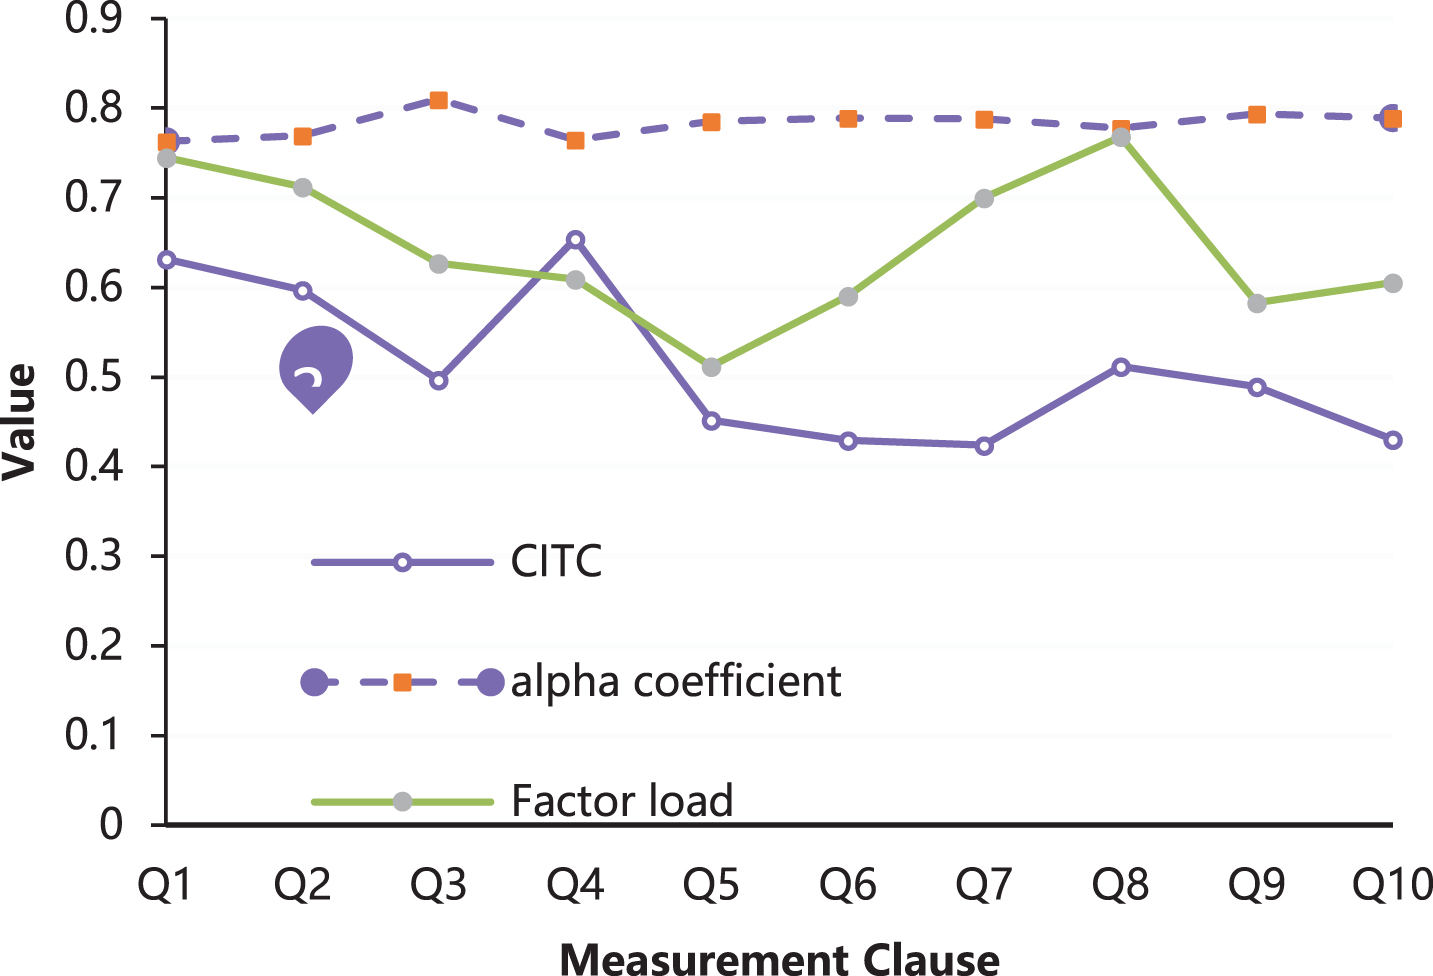
The analysis results of dairy brand loyalty scale.
The analysis results of the purchase intention scale in the case of no price promotion is shown in Fig. 5.
The analysis results of the purchase intention scale in the case of no price promotion.
For the reliability analysis of purchase intention, the overall Cronbach’s coefficient α is 0.757, which is greater than 0.7. The CITC values of the three measurement items are all greater than 0.35. The α coefficient did not improve after deleting each measurement clause, which indicates that the reliability of the scale is good.
The analysis results of the consumer innovation scale are shown in Fig. 6.
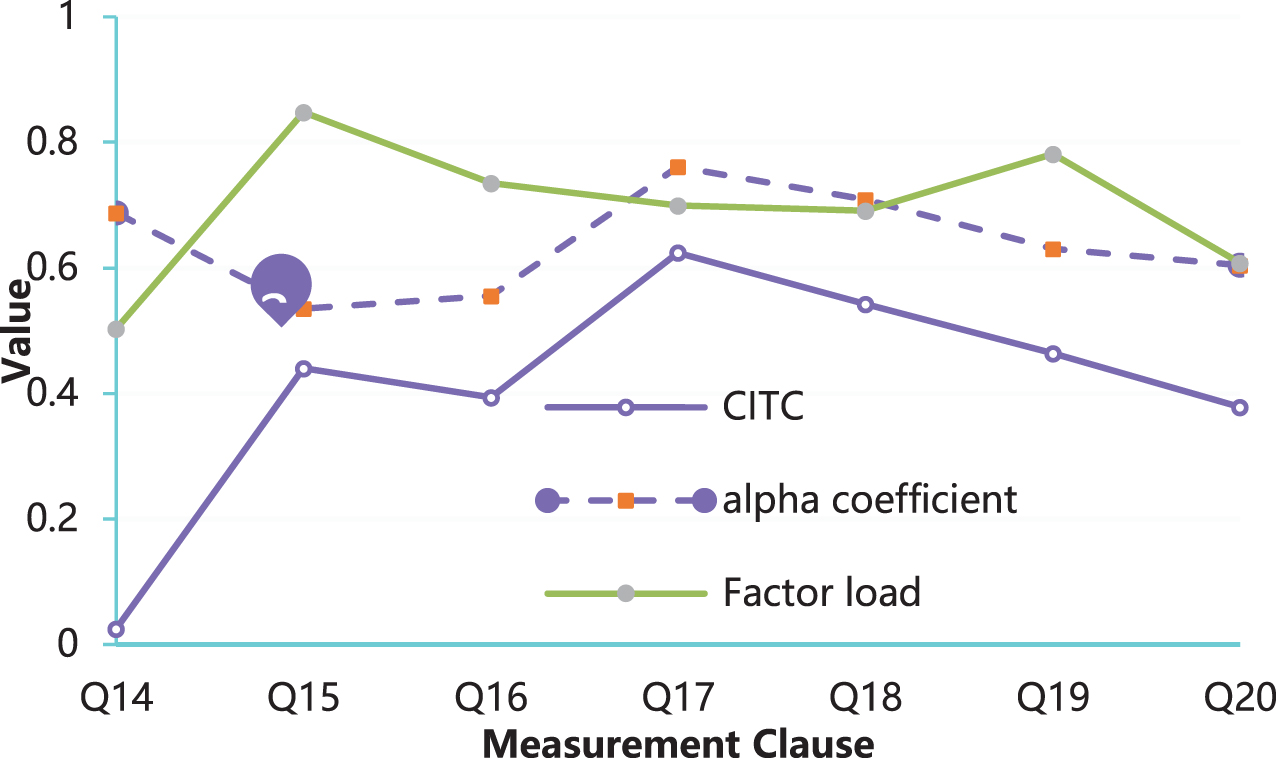
The analysis results of the consumer innovation scale.
From the reliability analysis of consumer innovation, it can be seen that the CITC value of clause Q14 in consumer innovation is 0.025, which is less than 0.35, so this item is deleted. After the deletion, the overall Cronbach’s coefficient α increased from 0.718 to 0.869, and the reliability of the scale after the deletion met the requirements. CITC values for all other measurement terms are greater than 0.35.
The analysis results of the price-awareness fairness scale are shown in Fig. 7.
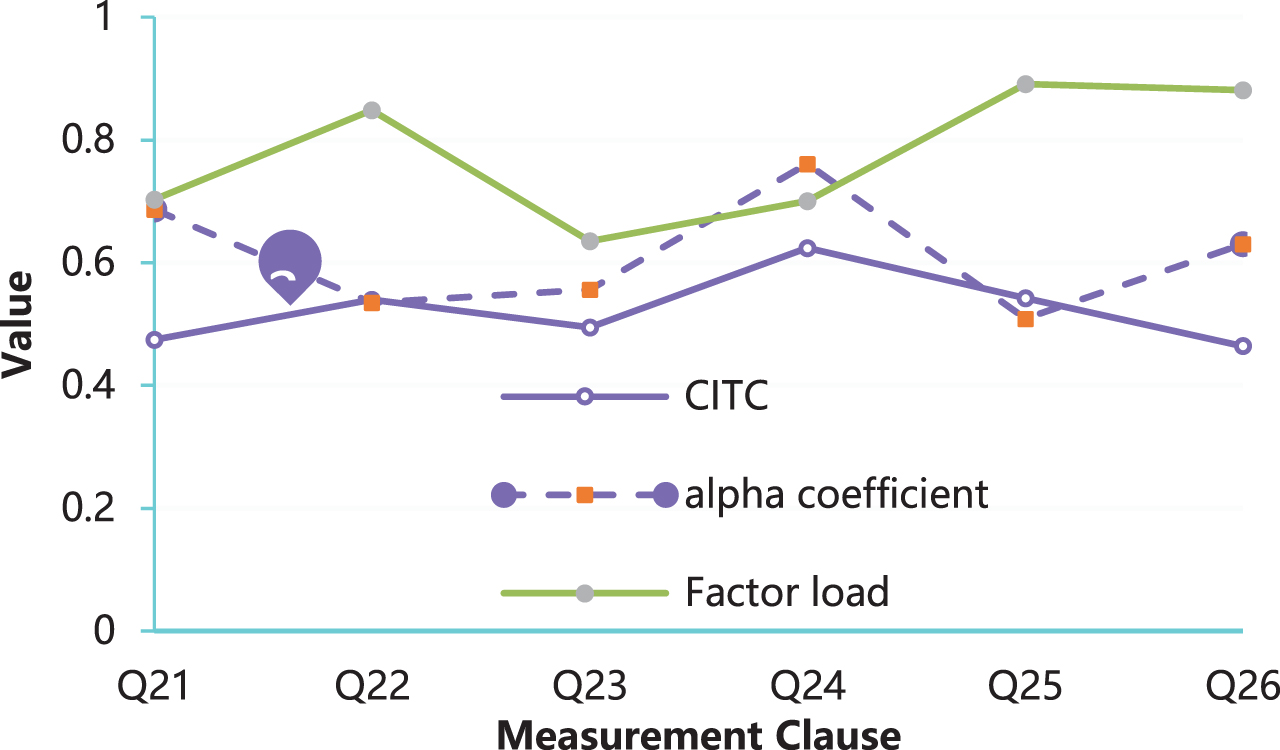
The analysis results of the price-awareness fairness scale.
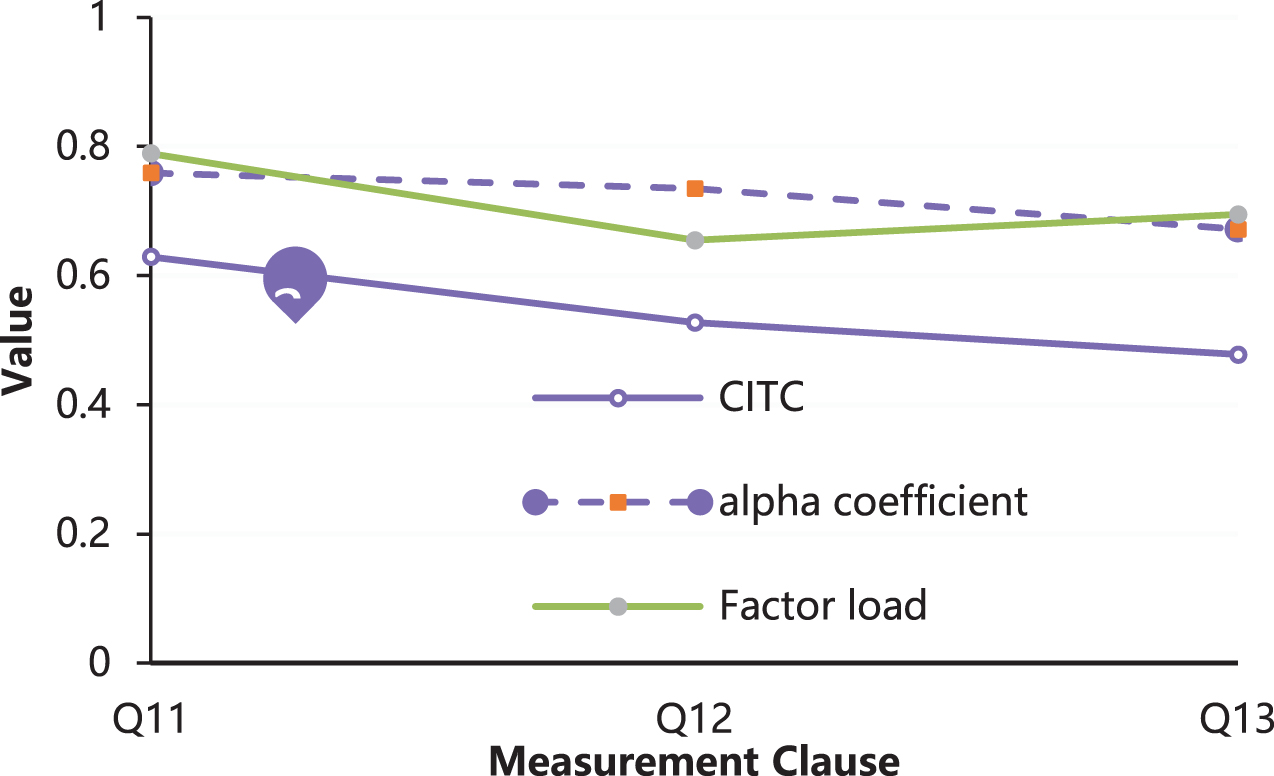
The analysis results of the dairy brand loyalty scale in the price promotion situation is shown in Fig. 8.

The analysis results of dairy brand loyalty scale in the context of price promotion.
The Bartlett sphericity test has a chi-square value of 253.759, indicating that it is suitable for factor analysis. Through factor analysis, it was found that the two factor values were 4.519 and 1.549, both of which were greater than 1. The factor load of each measurement item is greater than 0.5, and the cumulative interpretation variance is 60.683% and 59.416%, both of which are greater than 50%, indicating that the structural validity is good.
The analysis results of purchase intention scale is shown in Fig. 9.
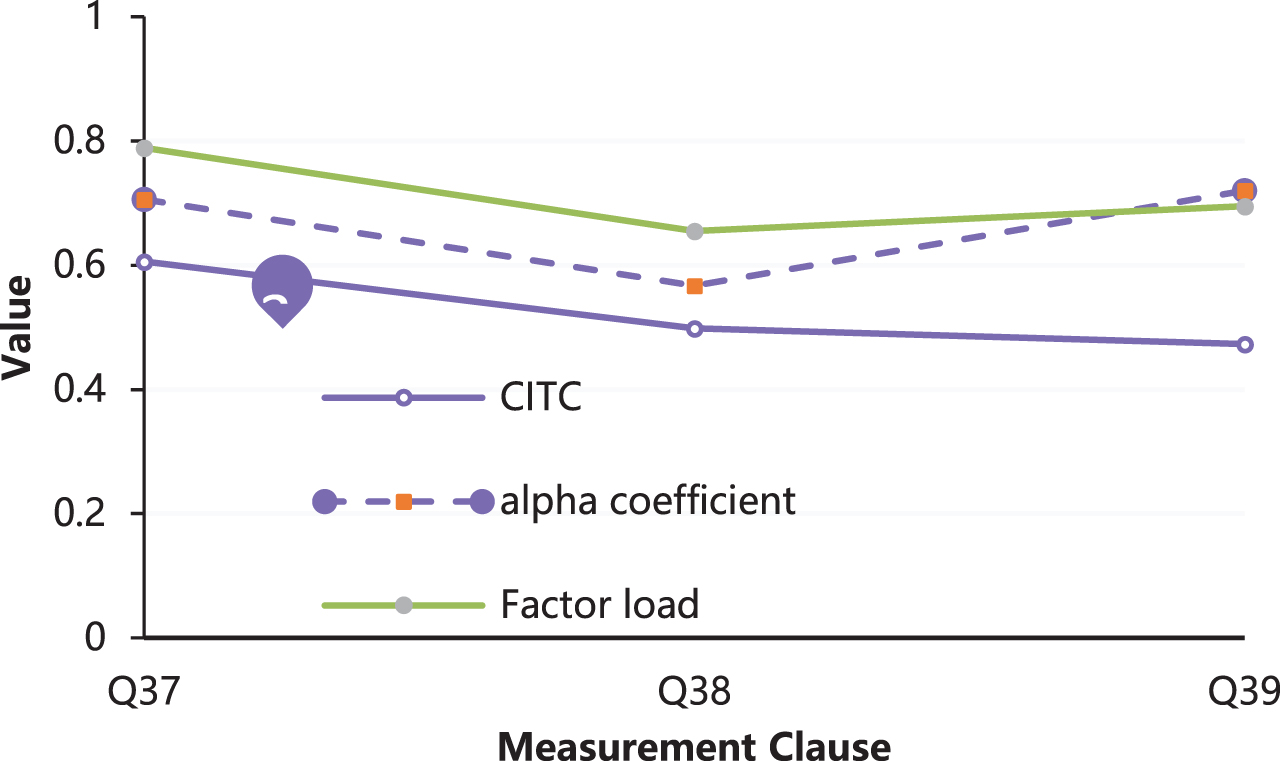
Analysis results of purchase intention scale.
The above series of simulations can prove that the validity of the scale structure is good, and this research model has certain practical effects.
Currently, online consumer behavior data, including online dairy brand loyalty data, is showing explosive growth in big data features. The value of big data needs to be processed professionally to increase the processing capacity of big data to achieve the added value of big data. However, traditional data collection and analysis methods cannot effectively process big data with characteristics such as unstructured, diversified, fragmented, and high dimensions. Therefore, this study uses the advantages, that is, it has advantages when processing high-dimensional data, when processing data in multiple ways, and when analyzing data with high complexity algorithms, of machine learning processing to process online consumer big data to analyze and research online dairy brand loyalty data. Moreover, the research process follows a machine learning path for online dairy brand loyalty measurement. In addition, in this research, online data collection for dairy brand loyalty measurement, online data cleaning for dairy brand loyalty measurement, machine learning method modeling for dairy brand loyalty measurement, dairy brand loyalty measurement model verification, and the dairy brand loyalty measurement model test and dairy brand loyalty measurement model optimization are used to construct an online dairy brand loyalty measurement model to achieve online dairy brand loyalty similar to user clustering and online dairy brand loyalty definition.