
Abstract
Analysis of single-cell RNA sequencing (scRNA-seq) data is often complicate due to the sparsity and high data dimensionality. In this work, we proposed Fuzzy C-means based linear stable-exponential distribution (LSED) model for analyzing scRNA-seq count data of chronic myeloid leukemia (CML) patients. We propose pipelines stages for analysis in which noisy and inconsistent data form sequencing is removed during data preprocessing, this process data then form the cluster of gene feature using fuzzy c-means (FCM) clustering, relevant features are extracted during feature extraction approach. These extracted features are then fed into LSED model in order to difference feature data of gene expression. Finally we evaluate the performance for proposed analysis model based on parameter estimation, distribution comparison and parameter analysis. From the result analysis it was observed that proposed analysis model parameter reflect change in condition of patient more effectively as well as this model fits difference data of gene expression in more better way in comparison to Cauchy and stable distribution. Additional, the results of Gene-set enrichment analysis specify the affinity of proposed model can replicate the distinct enhancement of BCR-ABL+ stem cell as well as BCR-ABL- stem cells. Significantly, proposed FCM based LSED analysis model studies CML from the perspective of statistical models, which present a new sight for CML scientific research.
Keywords
Introduction
With advancement in analysis of single-cell gene expression, great potential researches emerges for discovering distinct molecularly based subpopulations as well as the successive delineation of diverse hematopoietic fraction cells [1, 2]. Chronic myeloid leukemia (CML) is a clonally myeloproliferative disorder of the hematopoietic stem cell (SC), previous research indicate that the reasons for the resistance to TKIs are maybe the heterogeneity of SCs and the persistence quiescent feature on patients, exploring the dynamical process of CML can provide important reference significance for other cancers [3–5].
Many computational methods have been designed to tackle single-cell RNA sequencing (scRNA-seq) data, including identification of differentially expressed genes such as Deseq2, unsupervised clustering such as SC3, dimensionality reduction techniques such as SIMLR (single-cell interpretation via multi-kernel learning), and expressive deep generative models such as Single Cell ATAC Sequence Analysis via Latent Extraction (SCALE) [6–8], which provide valuable references for cancer research. However, it is rare to study the statistical model for scRNA-seq data, such as gene expression distribution model. The known BPSC (Beta-Poisson) model, the LTMG (left truncated mixture Gaussian) model and the zero-inflated gamma distribution are based on the expression of individual genes to study their distribution features [9–11].
Analysis of scRNA-seq data of CML patients, an interesting phenomenon is observed that the distribution features of the gene expression difference present a certain tendency. Accordingly, we construct FCM based LSED analysis model for distribution features. In this model in order to improve analysis for distribution feature we use FCM based clustering approach or extracting relevant distribution feature from cluster itself. The major contribution of this work is described as follows: First we introduce data preprocessing model that remove noise and inconsistency of input scRNA-seq data. Second, we employ Fuzzy C- Means clustering that make the clusters of gene features based on similarity. Third, we extract the relevant feature from clusters based on relevancy of genes. Fourth, we proposes LSED model for distribution feature analysis. Finally, we present performance evaluation model for BCR-ABL+ and BCR-ABL+ based parameter estimation, distribution comparison and parameter analysis.
The remaining paper is organized as follows:
Sections 2 describe data source material and framework architecture of proposed model used in this work. Section 3 specifies the simulation result. Concluding remark with further work extension is summarized in section 5.
Materials and methods
In this work, we present analysis analysis of scRNA-seq data to identify single cell community cluster and significant distribution feature using Fuzzy C-Means based LSED analysis model for of single-cell RNA sequencing gene expression data and framework architecture of proposed analysis model is shown in Fig. 1.

Overview of the construction and subsequent analysis of LSED model. First, the total RPKM expression data are classified according to different patients in different disease stages. LSED model is constructed based on the features of each group data. Then we estimate its parameters, and compare the fitting effect with stable distribution and Cauchy distribution. Finally, we perform biological analysis on the parameters of LSED model.
Original scRNA-seq data are intrinsically strident noisy in term of various complex factors including technical inconsistent variation and biological variation. During data pre-processing stage we perform alignment, duplicate removal, quantification, filtering, and normalization of data.
Data acquisition
scRNA-seq read count data are transformed into gene-expression matrix [M [Cell] × M [Gene]] into three steps:
Alignment
In this step we perform sequence alignment using sequence analysis alignment tool including STAR and Burrow- Wheeler-Aligner (BWA).
Remove duplication
Duplication in read sequence is removed by allocating read sequence to intron and exon feature with transcript explanation in universal format of Transcript Format. The read sequence data that have high quality mapping to loci of exonic are considered for quantification.
Quantification
In this step, count data are transformed into gene-expression matrix [M[Cell]×M[Gene]] by replacing the non-zero value with 1.
Data filtering
As filtering criteria is varying, therefore we perform cell-wise as well as gene-wise filtering form gene-expression matrix in which row represent cell and column represent genes. During cell-wise filtering we consider only those cells that have summation count score for all non- zero value more than 2000 and in gene filtering we count only those genes that summation count score for all non- zero value between 3-200.
Data normalization
We employ SCnorm method for data normalization. In this method, divide all genes into equal size group of 10 according to their unnormalized non-zero median score gene expression and perform mode computation for each associated group. Initially, SC norm method will apply with K = 1, check for mode of all the 10 group within 0.1-of-zero, and if it greater or less than 0.1 then amplify the K value until an estimated acceptable stopping end had been achieved.
Fuzzy C- Means (FCM) clustering
Clustering plays a crucial role in analysis of sc-RNA seq for CML detection. In this paper we use fuzzy c-means clustering that uses G
F
number of genetic features represented as G
F
= { f1, f2, f3, … f
G
F
} G
F
×A and each feature has A attributes. All genetic features are first partition into Fc fuzzy cluster (1 ⩽ Fc ⩽ G
F
) with a set of fuzzy cluster center CC = { CC1, CC2 … CC
Fc
} Fc×A and degree of fuzzy membership function matrix U
fm
= { μ
jk
} Fc×G
F
where μ
jk
represent degree of membership of k
th
feature to cluster-center Fc
th
. Degree of fuzzy membership function matrix should need to satisfy following mathematical criteria:
In order to obtain optimal fuzzy clustering, FCM applies objective function which is defined using following equation:
Where, c
e
represent coefficient of fuzzification that represent fuzzy clustering degree, in this work we consider c
e
= 1 and
Based on minimization degree of fuzzy membership functions and center of fuzzy cluster is updated using following equation:
The FCM algorithm terminates as the following criteria satisfied:
Cluster matrix of gene expression consists of gene which is a cell attribute. Expression of value of gene added to fuzzy cell cluster but to high dimensionality result gets affected. There are several dimensionality reduction including principal component analysis (PCA) applied before clustering that can extract gene feature but such approaches sometimes dropped relevant genes and unable to differentiate the subpopulation explicitly. In this paper we introduced different approach in which gene feature are extracted after clustering in order to get significant gene-marker. For every cluster community, we calculate average of expression values of certain gene to find out which community cluster a gene fit into. The topmost G genes were chosen to be the significant genes pertinent to subpopulation.
Linear stable-exponential distribution model (LSED model)
The gene expression difference data show a significant feature of asymmetric and “peak and thick tail” (see Fig. 2a-e).
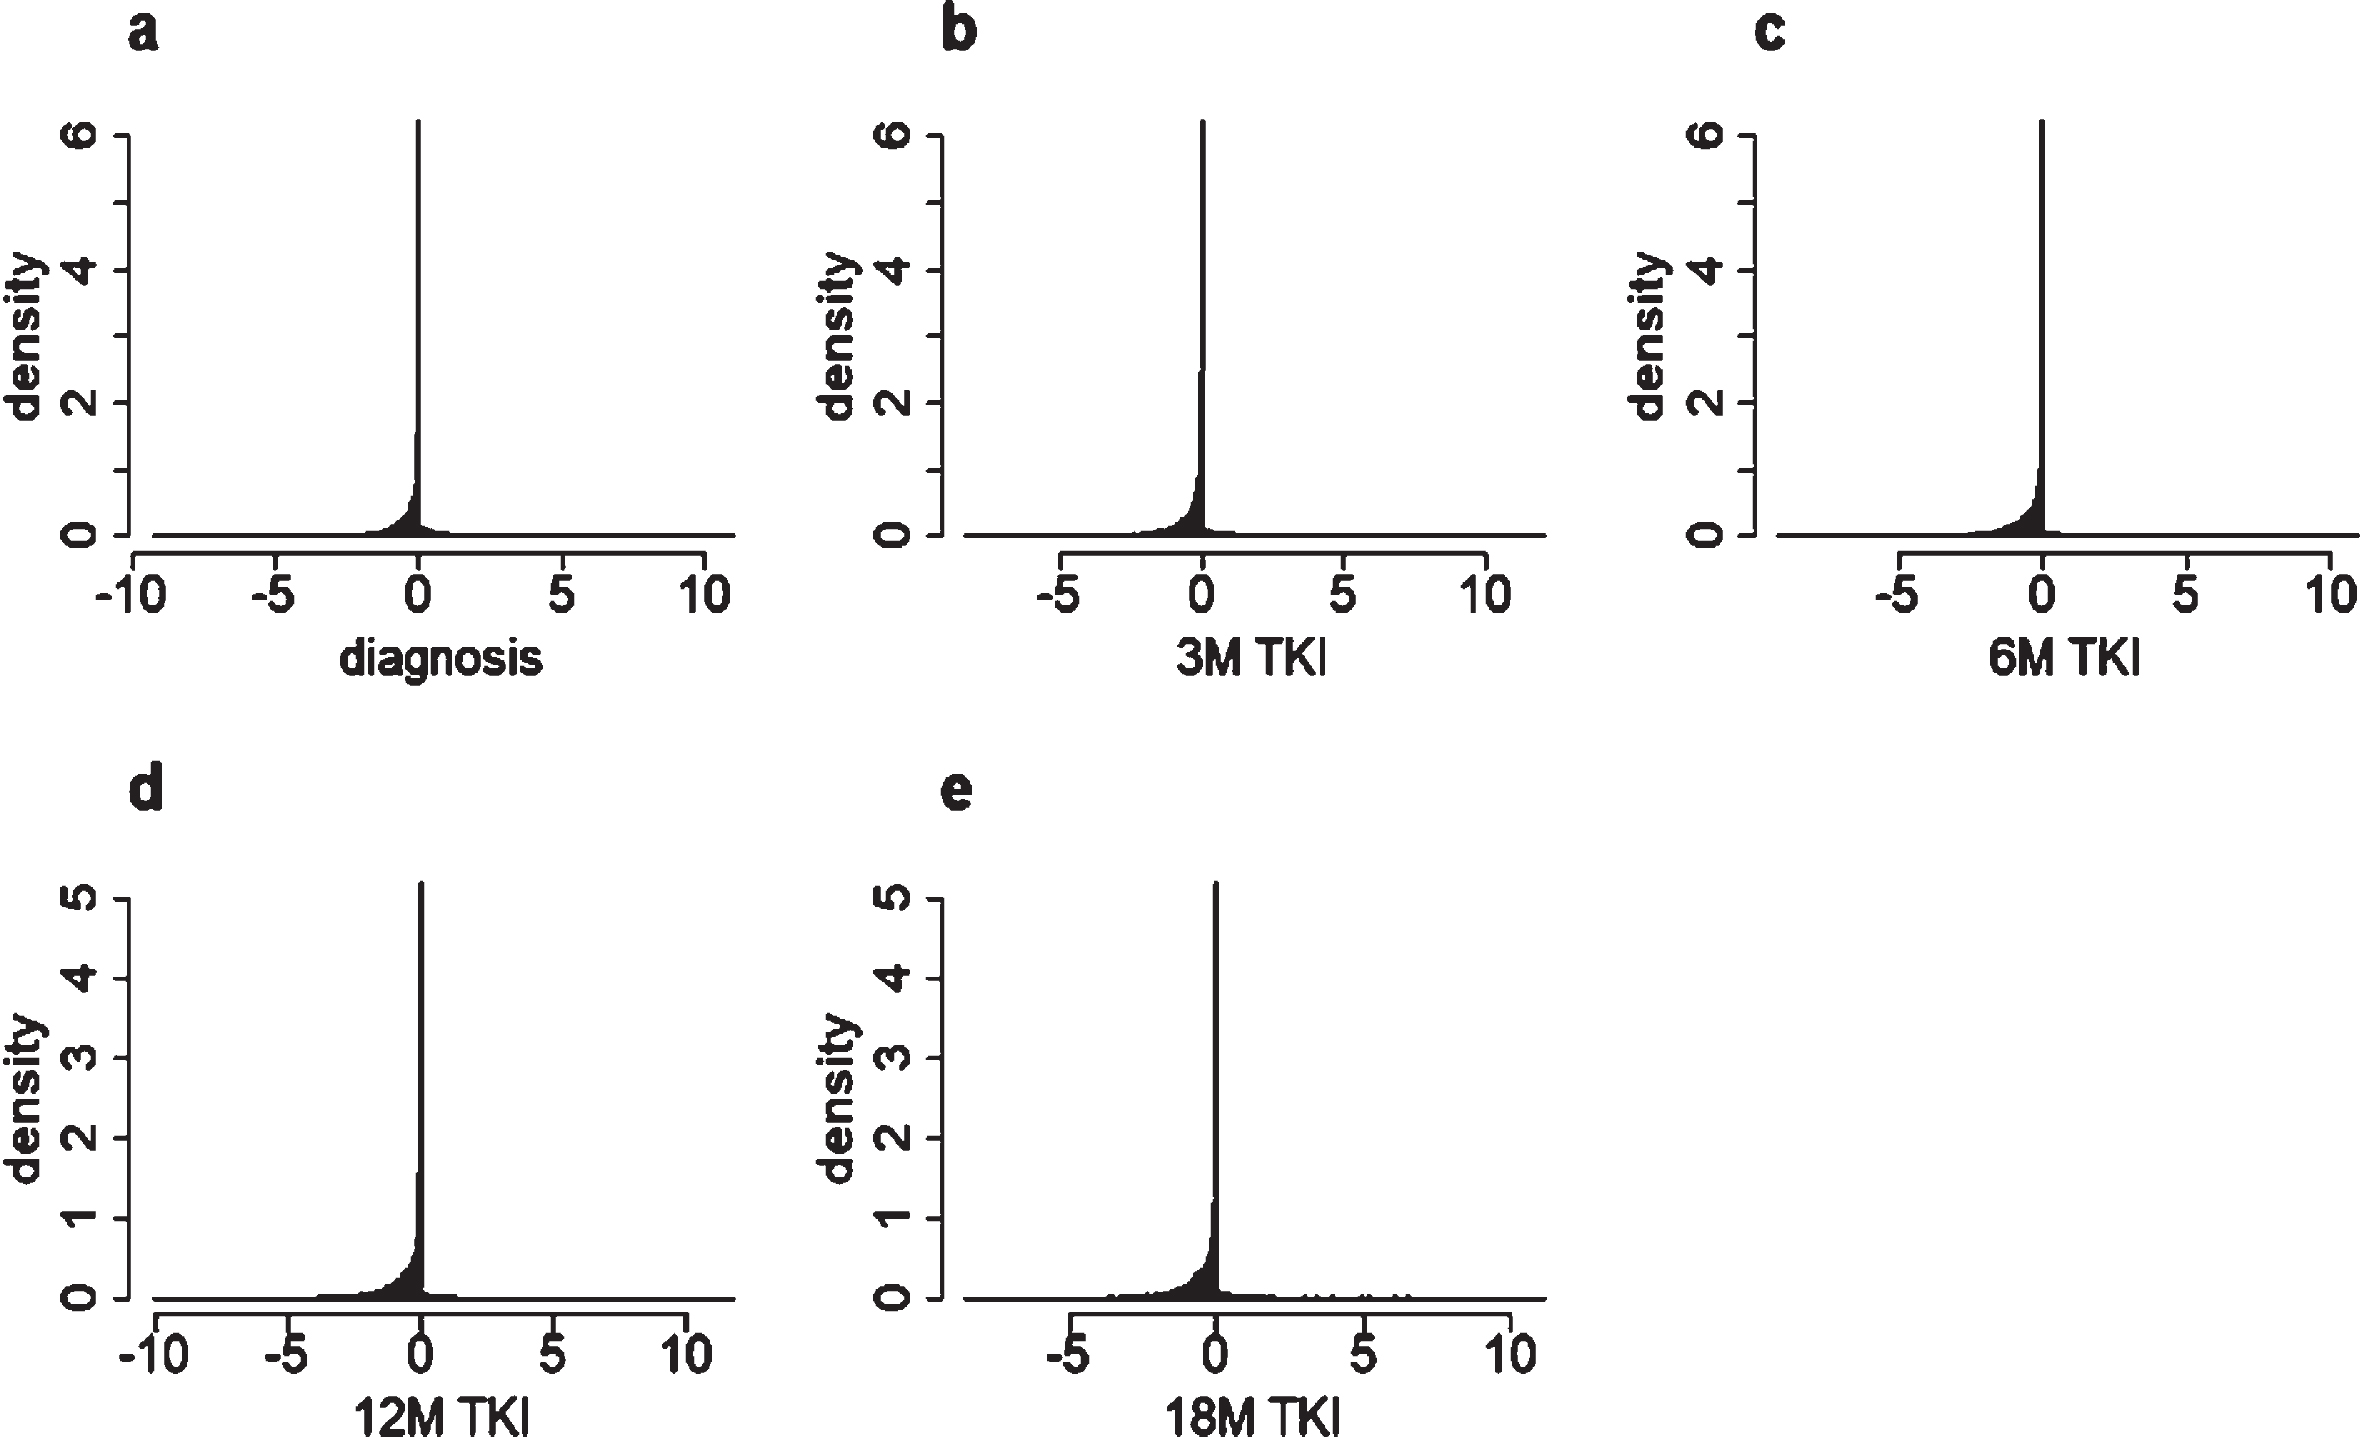
Represent density distribution graph for genes expression difference data at different diagnostic and treatment stages with different time interval: (a) diagnostic stage; (b-e) represent treatment stage with different month interval (b) 3 month (3 M) TKI (c) 6 month (6 M) TKI (d) 12 month (12 M) TKI (e) 18 month (18 M) TKI.
Due to the special shape of the tails on both sides (see Fig. 3), we try to construct an integrated distribution model to depict these features. The left side shows a similar feature as stable distribution, and the right side can be depicted by exponential distribution. In addition, the distributions of the data also exhibit the features of “peak and thick tail”. In order to better depict the distribution tendency of the data in each stage, not only its asymmetry and dispersion but the feature of “peak and thick tail” should be considered. Accordingly, the stable distribution and the Cauchy distribution are used to fit the genes expression difference data.

Represent Tail and peak density distribution graphs on both left and right side for diagnose and 2 treatment stage at 3 M TKI and 6 M TKI for gene expression referential difference data.
Stable distribution, also called α-stable, Lévy-stable distribution, extends the Gaussian model and allows skewness and heavy tails, first introduced by Lévy (1924) [12]. The stable distribution does not have a uniform, closed-form analytical expression of probability density function, but it has a uniform feature function, so the definition of a stable law is convenient provided by its characteristic function representation [13]. Hence, we construct a linear stable-exponential distribution (LSED) model. The probability density function of LSED model is defined as the following,
Where, ω (t, α) is defined to be
For the four parameters (α, β, γ, δ) in both stable distribution and LSED model have different meanings: the parameter α (0 < α ⩽ 2) is called the characteristic exponent, which determines the impact degree of the distribution. The smaller the value α is, the thicker the tail of the distribution is, meanwhile the impact degree of the distribution is greater. On the contrary, as the value α increases, the tail of the distribution will become thin, and the impact degree of the distribution will decrease. The parameter β (- 1 ⩽ β ⩽ 1) is a skewness parameter, which determines the distortion degree of the distribution, and β = 0 implies a symmetric distribution. And γ is a scale parameter, also called a dispersion coefficient. Similar to the variance of a Gaussian distribution, but the value γ is twice the variance in a Gaussian distribution. The last parameter δ is the location parameter [14, 15].
We acquire the RPKM gene expression scRNA-seq data of CML patients from the Gene Expression Omnibus (GEO) database in NCBI with the accession codeGSE76312 (https://www.ncbi.nlm.nih.gov/geo/query/acc.cgi?acc=GSE76312). First, the total RPKM expression data are classified according to different patients in different disease stages, and the data of CML patients with the discontinuous stages are excluded. Among them, the data of 5 normal donors are regarded as the reference; the others include the data of 5 stages for 11 patients. The 5 stages consist of one diagnostic stage, four treatment stages at an interval of 3 months (3 M) TKI, 6 months (6 M) TKI, 12 months (12 M) TKI and 18 months (18 M) TKI, respectively.
All data analysis is performed based on log base 2 (Log2) expression values of RPKM. The gene expression averages among 232 cells for each gene from 5 normal donors are regarded as the reference data, and then the gene expression difference data are obtained by subtracting the references data from gene expression data of each cell for each patient in different stage. The descriptive statistics of the gene expression difference data in each stage is shown in Supplementary Table 1.
Descriptive statistics of CML patient data at each stage for gene expression based difference data
Descriptive statistics of CML patient data at each stage for gene expression based difference data
Analysis of differentially expressed genes
Using 232 normal hematopoietic stem cells (HSCs) from 5 normal donors as the control group, the differentially expressed genes in each stage for 11 patients are analyzed. First, the total RPKM expression data are classified according to different patients in different disease stages. Differentially expressed genes analysis is performed on R software on the basis of the “sRAP” package of Bioconductor due to the feature of RPKM expression data. Then differentially expressed genes are selected on the basis of the absolute fold change (⩾1.5) and adjusted p-value (⩽0.5). The result is shown in Table 1.
LSED model of the gene expression difference data
The estimation of parameters of the stable distribution is severely impeded by the lack of closed-form expressions for the probability density function. In recent decades, many methods have been provided. The most common methods are: quantile-based estimator, maximum-likelihood estimator, sample characteristic function estimator, and so on. The quantile-based estimator has an error when the data is skewed or the value α < 0.5. The maximum likelihood estimator is very slow due to a large number of numerical integration. The accuracy of the numerical estimator based on sample characteristic function proposed by Press is not good, so we select another regression estimator proposed by Koutrouvelis (1981) to estimate the four parameters of the distribution [16, 17]. Then, we perform parameter estimation based on the regression estimator with convergence threshold 0.01, and the exponential part are estimated by function fitdistr of R package MASS. Furthermore, we obtain the combination coefficient κ based on fitting effect. The estimated parameter values of both the stable distribution and the LSED model are shown in Supplementary Table 2.
Based on the parameter estimation values, the fitting effect graph is plotted in Fig. 4a. In Fig. 4a experimentation observation for density distribution represented by solid green line curve, dashed red line represent FCM based LSED analysis, stable distribution analysis is represent by dashed blue line, and dashed black line represent Cauchy distribution. It can be seen from Fig. 4a that the density curve of observation and LSED are almost completely coincident, while stable and Cauchy distribution is not able to produce as good the fitting effect of as that of LSED. Then, we assess the fitting effect by the chi-square goodness of fit test. The P-value also indicate the identical result of LSED model (P > 0.9), stable distribution (P > 0.9) and Cauchy distribution (P < 0.5). Furthermore, we use root mean square error (RMSE) method to measure the fitting and correct effect of FCM based LSED analysis as well as distribution effect using stable and distribution algorithm using following equation,
Represent fitting and correction effect with α based box plot for different model at different stage. (a) Density distribution curve for experimentation observation (solid green line), proposed FCM based LSED model (dashed red line), stable distribution (dashed blue line) and Cauchy distribution (dashed black line) (b) Box plot demonstrate the distinctive of α parameter for different diagnostic and treatment stages during interval of 3 months (3 M) TKI, 6 months (6 M) TKI, 12 months (12 M) TKI and 18 months (18 M) TKI, respectively.
To depict the distribution feature of gene expression data, we further analyze LSED analysis model based parameter α and β. The characteristic exponent α of the LSED model determines the degree of tailing of the distribution, which may mean the number of differentially expressed genes. The skewness parameter β determines whether the distribution is skew, which may mean the variation of gene expression level in comparison with normal. The scale parameter γ and location parameter δ have no biological interpretation according to its definition, and the distribution shape is mainly determined by the first two parameters. Therefore, we mainly study the characteristic exponent α and the skewness parameter β.
α: The variations based on number of expressed genes differentially e
From the diagnosis stage to the treatment stages, it can be seen that the characteristic exponent α indicate an interesting phenomenon (see Fig. 5a-k). At diagnosis, the values of characteristic exponent α of BCR-ABL+SCs are always smaller than BCR-ABL-. Corresponding to variations based on number of differential feature of gene expression as shown in Table 1, whereas the differential feature of gene expression of BCR - ABL+ Stem Cells (SCs) are always more than BCR - ABL-. From the previous section we know the smaller the value α is, the thicker the tail of the distribution is. That is, the smaller value of α corresponding to the more differentially expressed genes.

Represent Line graph for Variation in α parameter for BCR - ABL+ stem cells and BCR - ABL- stem cells from (a) to (k) for CML patients. Here different diagnostic and treatment stage with different monthly interval is presented on X-axis.
With the progress of treatment, the variation of the feature exponents α of BCR-ABL+SCs in each stage shows an increasing trend which correlated with the number of differentially expressed genes. Although the similar trend is observed in BCR-ABL- SCs, these changes are not markedly. That is, the changed trend of α is consistent with the variation of differentially expressed genes. In BCR-ABL+SCs, GSEA shows reduced proliferation- and cell cycle-related gene expression and increased quiescence-related gene expression from diagnosis stage to treatment stages. However, BCR-ABL- SCs show reduced proliferation-related gene expression and increased quiescence- and cell cycle-related gene expression from diagnosis stage to treatment stages. The variation of characteristic exponent α in BCR-ABL+ and BCR-ABL- SCs show different trend, partly because the distinct enrichment. Considering patient CML22, CML656, and OX1302, they have gone through three stages: diagnosis, 3 M TKI and 6M TKI. The amount of their differentially expressed genes in different stages is not linear, there is an inflection point. It is easy observed that the variation graphs of the characteristic exponent α of patient CML22, CML656 and OX1302 exist an inflection point, the tendency is in accordance with the variation of the differentially expressed genes (see Fig. 5b,e,i). These results demonstrate the characteristic exponent α can well depict the variation of the differentially expressed genes. The parameter value and the number of genes show an opposite change, the value of the characteristic exponent α increases with the decreasing of the differentially expressed genes.
β: The variation of expression level of differentially expressed genes
The variation of the skewness parameter β in BCR-ABL+SCs also shows an increasing tendency with the progress of treatment for the majority of patients as shown in Fig. 6a-k. However, the variation of the skewness parameter β in BCR-ABL- SCs has no regular trend. From previous section, β < 0 shows a left deviation of the distribution, β = 0 means that the distribution is symmetric, and β > 0 implies the distribution is right deviation. The values of β in BCR-ABL- SCs show irregular trend, so the next analysis is based on BCR-ABL+SCs. To observe the variation of gene expression level, we first filtered out low-expression genes with average of log2(RPKM) for all cell less than 1, and obtain 12840 genes for further analysis. We randomly select 100 genes from 12840 genes, then compare the median and the expression distribution based on the beeswarm plots and box-plots. The process is repeated 20 times. The median of diagnosis stage and treatment stages is smaller than normal mean, indicating that the gene is down-regulated (see Supplementary Figure 1). Analysis of the 20 groups data shows more genes is down-regulated in comparison with normal in the majority of the groups. And the genes expression level is closer to normal from stage of diagnosis to treatment in most of groups. These results indicate the variation of β is associated with the genes expression level. And the increasing tendency of β indicates the expression of down-regulated genes is gradually trend to normal. That is, the state of the majority of patients gradually tends to be stable with the progress of treatment. As for patient CML25, the values β of BCR - ABL+ stem cells and BCR - ABL- stem cells show a decreasing tendency; this opposite tendency might be caused by extrinsic factors. In general, the tendency patient state in term of β can be reflected by BCR - ABL+ stem cells during the progress of treatment.

Represent Line graph for Variation in α parameter for BCR - ABL+ stem cells and BCR - ABL- stem cells from (a) to (k) for CML patients. Here different diagnostic and treatment stage with different monthly interval is presented on X-axis.
As for rate parameter λ, neither BCR-ABL+ nor BCR-ABL- SCs show regular trend (see Supplementary Figure 2). These outcomes specify that the parameters of the LSED analysis model are related differentially with expressed genes in patients, an increase of feature exponent α means the decrease of differentially expressed genes, and the skewness parameter β can reflect the variation of gene expression level.
CML is a clonally disorder of HSC myeloproliferative and the relapse of CML and the resistance to TKIs are the main obstacles to the therapy of CML at the present. Exploring the dynamical process of CML can provide important reference significance for other cancers. With advancement in analysis of single-cell gene expression, great potential research has been carried in the field discovering distinct molecularly based subpopulations as well as the successive delineation of diverse hematopoietic fraction cells. And based on the single-cell RNA sequencing data, it is found that the heterogeneity and persistent quiescent features of SCs in patients may be the reasons of drug resistance [19, 20]. Although progress in analysis of single-cell gene expression unravel the resistances to TKIs are maybe the heterogeneity of SCs, while it is rare to analyze the overall distribution features of single-cell RNA sequencing data.
Analysis of scRNA-seq data of CML reveal the feature of asymmetric and “peak and thick tail”, we construct LSED model by combining stable distribution and exponential distribution. The comparison of chi-square goodness of fit test and RMSE validate LSED analysis model is robust and can fit gene expression based difference feature data more precisely than stochastic Cauchy and Stable distribution model. Analysis of the variation of the gene expression level in each stage, it is found that the parameters are closely related to the development of CML patients in each stage. The characteristic exponent α and the skewness parameter β can well depict the variations of differentially expressed genes during the development of the disease. With the progress of treatment, the parameter α shows an increasing trend, accordingly the number of differentially expressed genes in patients is gradually decreasing, which means that the patient’s condition tends to be stable. Although the similar trend correlated with gene showed in BCR - ABL+ stem cells and BCR - ABL- stem cells, these changes are not marked in BCR-ABL- SCs. In addition, BCR - ABL+ stem cells indicate small α values of α are smaller in BCR-ABL+SCs as compared stem cells of BCR - ABL- at diagnosis stage. GSEA indicates the markedly increased proliferation-, cell cycle- and quiescence-related expressed gene value in comparison with BCR - ABL- stem cells. For skewness parameter β, it depicts the variation of expression level of differentially expressed genes during the progress of treatment. The tendency of parameter β is increasing which means the gene expression difference is decreasing. Furthermore, we explore the general variation of characteristic exponent α. To this end, the box-plot and bee swarm plot of the characteristic exponent α is obtained by analyzing each disease stage (see Fig. 4b). The median of parameter α shows a progressing tendency in different stages. For most patients, with the progress of treatment, the value α shows an increasing trend. That is, the tail of the distribution is gradually becoming shallower. In other words, the differences in genes are getting smaller. It indicates that the patient is gradually stabilizing. It can be observed that the median shows an increasing trend from stage 6 M to 12 M, partly because the disease condition is affected by the long-term use of TKIs, or the amount of clinical data is not enough to depict the overall variant feature.
Due to limited clinical data, we cannot make further analysis of the parameters for patients in each stage. Long-term treatment with TKIs on CML patients may lead to drug resistance, so it is necessary to determine the optimal withdrawal time based on the parameter features in each stage. On the other hand, it is important to find out the specific series of parameters during each stage for establishing relevant dynamic models to better study the development mechanism of CML. The work will be better solved with more clinical information and more detailed data of CML. Constructing statistical models based on the features of scRNA-seq data is significant to cancer research. LSED model can also be applied to study scRNA-seq data of other cancers, and the dynamic evolution process of cancers can be explored, which provides the basis for the early disease diagnosis, prediction and treatment. Furthermore, LSED model has certain reference significance to the research of machine learning in scRNA-seq data.
Disclosure statement
No potential conflict of interest was reported by the authors.
Footnotes
Acknowledgment
This study was supported by the Key Project team of National Natural Science Foundation of China (Grant No. 11831015), the Major Research Plan of National Natural Science Foundation of China (Grant No. 91730301), Postgraduate Research & Practice Innovation Program of Jiangnan University (Grant No. JNKY19_051) and Postgraduate Research & Practice Innovation Program of Jiangsu Province (Grant No. KYCX18_1864).