
Abstract
The conventional JSEG algorithm has a powerful detection capability on the homogeneity of regional texture features because it combines the spectral information with image texture features during the segmentation. However, the conventional JSEG method is not very accurate for the target edge localization in segmentation results. To solve this problem, this paper proposes an improved segmentation method of remotely sensed image based on JSEG algorithm and fuzzy c-means (FCM) with spatial constraints. Firstly, the FCM clustering method based on spatial neighborhood terms is used to replace the traditional HCM clustering method in the quantization step. Then the region growing method is applied to segment the class diagram after FCM clustering. Finally, the proposed method uses the improved regional merger approach to merger the over divided region after segmentation. According to the J index, the proposed algorithm is improved by 31% and 12% compared with the traditional JSEG segmentation method and improved by 17% and 8% compared with the FNEA segmentation algorithm for aerial image and the SPOT 5 image. The experimental results show that the proposed segmentation algorithm has good noise immunity because of the fuzzy clustering of spatial constraints and can extract the edge of the target more accurately.
Keywords
Introduction
With the continuous development of satellite technology, the spatial resolution of remote sensing image has reached the meter level, or even centimeter level. How to fully exploit the useful information of the remote sensing images to improve the efficiency of data utilization has become the major issue in the field of remote sensing image processing. And effective image segmentation is the foundation and an important guarantee for the analysis of remote sensing image [1].
In the last thirty years, researchers have throughout studied the remote sensing image segmentation and its applications [2–4]. During this period, many effective image segmentation methods have been proposed for remote sensing image segmentation. Herein, many works have demonstrated the advantage of the JSEG method [2, 3]. In this method, the segmentation process consists of two separated stages: color quantization and spatial segmentation. In the first stage, the categories of the image color are reduced by peer group filtering (PGF) and vector quantization technique, where PGF is introduced for image smoothing and impulse noise removal. The color quantization results are shown as a class map including various color labels. This map is then spatially segmented to generate the segmentationresults.
However, the JSEG based remote sensing image segmentation method is challenging. First, remote sensing images commonly contain only a dozen gray levels after quantization step. As a result, the segmentation results likely lost the details in samples, and the inter-class difference is reduced. Second, different from common images, changing environments in the urban area and man-made objects make remote sensing images difficult to segmentation. At last, in the JSEG the color histogram is extracted as the image features which would have similar metrics in different types of objects.
To solve this problem, this paper proposes an improved segmentation method of remotely sensed image based on JSEG algorithm and fuzzy c-means (FCM) [5] with spatial constraints, The method used the FCM clustering method based on the combination of spatial neighborhood terms is used to replace the traditional HCM clustering, and the results show that it can provide a generic and effective unsupervised solution for high-resolution remote sensing image segmentation.
The rest of the paper is structured as follows. The next section summarizes the related work. Section 3 introduces the methodology of our proposed method, including color quantification, space division and regional consolidation. The experimental results are proposed in section 4. The conclusions are presented in Section 5.
Related work
Zheng et al. [6] used fuzzy control technique to optimize the image quantization, and all pixels are divided into different classes according to membership function; therefore, the spatial distribution characteristics of color information are better maintained, and the over-segmentation phenomenon is weakened. Chang et al. [7] proposed IC-JSEG algorithm which used color information of the original pixels in the image to replace the quantized images, obtaining better segmentation results in natural images. Wang et al. [8, 31] proposed an WJSEG (Wavelet-JSEG) method which is based on wavelet transform and improved JSEG algorithm. On this bases, Wang et al further proposed a novel unsupervised multi-scale segmentation method for high resolution remote sensing images with automated parameterization which needs no human intervention in segmentation process. Michel J [9] presented a stable mean shift image segmentation algorithm, which defines a new attribute stability and derives the optimal value and applies it to four algorithms. Poggi G [10] proposed a MRF model based on a tree structure for remote sensing image segmentation. Baatz M [11] proposes a fractal network evolution method. The algorithm is a region growing segmentation algorithm based on pixels from the bottom to the top and has become the core segmentation algorithm of the commercial remote sensing software eCognition. At present, the segmentation methods of high-resolution remote sensing image are divided into four categories: threshold-based segmentation methods, edge-based segmentation methods, and region based segmentation methods and other methods. The JSEG algorithm proposed by Deng considers not only the spectral information but also the image texture features during the segmentation and has a powerful detection capability on the homogeneity of regional color texture features [12].
However, the JSEG algorithm also has some inherent limitations, for example, the results are easily over-segmentation; the boundaries between different targets in the segmentation result is not obvious and was easy to be affected by the shadows. To solve these problems, researchers have proposed some improved JSEG methods. Zheng et al optimized the quantization process of image, all of the pixels are divided into different classes in accordance with the membership function, this method maintains the spatial distribution of color information better and weakens the over-segmentation [13]. Chang et al proposed an IC-JSEG algorithm which used the color information of original pixel in images instead of quantized images that can get a better segmentation results in natural scenes [14]. Komati put forward three improved versions of JSEG algorithm: Fractal-JSEG, Fractal-only and Local Fractal Dimension [15–17]. The first two methods mainly increase the detection accuracy of boundary areas of different target in the segmentation results. The third method mainly focused on the application scenarios that have similar spectral information and texture in the foreground objects and background regions of the image. These methods have some improvements on segmentation; however, since HCM classifies each object to a class strictly, therefore, these methods are not very accurate for the target edge localization in segmentation results [18]. Because the image typically contains only a dozen gray levels after quantization step after JSEG algorithm, although the image quantization can effectively reduce the amount of calculation, but it also results in the loss of a large number of details of the remote sensing images, reduces the inter-class separability, and makes it difficult to locate the object edge accurately. In addition, the JSEG algorithm uses the Euclidean distance based on the region color histogram as the merger guidelines, although the color histogram can better represent the area spectral information and texture [19], there are many types of feature, different types of objects in the image may have similar histogram distribution, so the original merger strategy may be prone to error merger results [20–23].
Given the difficulties of the segmentation on the remote sensing image, especially on the changing environment and a variety of man-made objects in the urban scene caused by the inherent limitations of the JSEG algorithm, therefore, using the JSEG algorithm directly is hard to obtain satisfactory results. To solve this problem, this paper proposes an improvement on JSEG algorithm in two aspects of image quantization and region merging based on JSEG algorithm and FCM with spatial constraints. The following sections introduces the improved strategies and the concrete realization of the proposed JSEG algorithm, the experiments on aerial remote sensing image and SPOT 5 image as show the effectiveness of proposed method compared with the FNEA segmentation algorithm of eCognition software and the traditional JSEG segmentation methods, respectively.
Proposed algorithm
The proposed improved JSEG segmentation method in this paper is divided into three steps: color quantization, spatial segmentation and region merging.
Color quantification
Since the high correlation between R, G, B three components, the LUV space is more consistent with the characteristics of visual perception, and can be well to describe color, and the Euclidean distance of LUV space can be well to show the similarity of two colors, Therefore, the color quantization and spatial segmentation steps are implemented in the LUV color space. Traditional JSEG algorithm uses the Peer Group Filtering (PGF) for image smoothing (denoising), then use the classic Hard C-Means (HCM) to obtain quantized image.
However, since HCM method divides each object into a class strictly, and the choice of initial cluster centers are too dependent on the experience and subjective judgment, therefore, in order to ensure the details of the image will not be lost, and ensure the accuracy of edge location in the segmentation result, this paper will use the improved Fuzzy C-Means (FCM) method instead HCM method during the quantization process [24].
The FCM algorithm was first proposed by Bezkek, which is a modification of HCM method. It uses fuzzy partition, obtains the membership of each sample point for centers of all classes by continuous iteration to minimize the objective function to determine the class of sample points [25]. FCM clustering segmentation method can overcome the problem of pixels classification in the image segmentation. However, due to FCM algorithm does not take the spatial information of the image into account, so when the segmentation object is the image with complex texture information, using the FCM method cannot achieve well results.
The characteristic values of adjacent pixels in an image are generally same or similar, and if the characteristic value of the adjacent pixels in the image is similar, it is likely to be classified into the same category. Therefore, during image segmentation, rational use of spatial adjacent information of image pixels can effectively improve segmentation results and efficiency. Therefore, this paper introduced the spatial neighborhood as a parameter to the improved FCM clustering R P process [26].
Suppose X = {X1, X2, …, X
N
} ⊂ R
P
, where, R
P
is P dimensional vector space, N is the total number of samples, let u
ik
be the membership of the k sample belonging to the i class. c is the total number of classification, and satisfies 0 ≤ u
ik
≤ 1,
The spatial neighborhood item introduced by the improved FCM is defined as follows:
where, N k represents the neighboring pixels set of neighborhood window of pixel x k , N R is number of pixels in the neighborhood of N k , α is a parameter used to control the influence of neighborhood term to the segmentation results.
The spatial neighborhood item is introduced to the objective function of FCM, the new objective function of FCM is as follows:
Based on the Equation (2), we derive the new objective function by the Lagrangian method, and get the updated iterative formula of membership matrix and cluster centers, the formula is as follows:
Update the membership matrix:
Update the cluster centers:
The implement process of improved FCM is as follows:
The J value of the center pixel is calculated based on the distributed of color vector on the class diagram; thereby the obtained “J Image” reflects the regional distribution of image. In the “J image”, the smaller J region represents the center of the region, the larger J region represents the boundary of the region. Then we establish a fixed seed region on the “J Image” according to the threshold that can eventually segment the central region of the object, and then use the region growing method to assign the pixel outside of the seed region to the seed region according to the distance to complete the space segmentation step.
During the image segmentation, the first step is to calculate the multi-scale J-image image sequences, which uses a certain size of the window to calculate the local homogeneity index J-value corresponding to each pixel in the original image as the values of the pixel that can obtain a single scale J-image image [27]. The calculation of J-value is as follows: First, the quantization image, let the position of each pixel of the quantized image z (x, y) be the value of pixel z, z (x, y) ∈ Z, where Z is the set composed by all pixels of specific size of the window that take pixel z as the center in the quantization image, N is the total number of pixels in the window that take pixel z as the center, and the mean value is m:
where, m p is defined as the average of all pixels that belong to the same gray level p in the window, Z p is a collection of all pixels belonging to the gray level p in the window and p is the total gray level in quantization image.
S
T
is defined as the population variance of all pixels in the window:
Then the J-value is:
Then we calculate the J-value at different scales by using the different size of windows as the pixel value; thereby to obtain multi-scale J-image video sequences. J-value reflects the degree of homogenization of the specific size of windows’ gray distribution that takes as the center. That is, the greater the J-value is, the greater the differences between the surface features in the window are, and the smaller the differences between classes are [28].
In the J-image at a certain scale, we first determine the seed regions based on the threshold T
J
, then dividing the central region of object in the image. We need to calculate the mean μ
J
and variance σ
J
of the local J values of each area in the entire image by the J image.
Then according to the mean and variance, T
J
is defined as follow:
where, a is a predetermined threshold value, usually its value is between – 0.4 to 0.4. In the J-image at current scale, the point less than the threshold T J are considered to be the starting seed point of region growing, then expanding the area by moving to the neighborhood direction. If the area size is larger than the minimum size of seed region in the current scale, it can be used as a seed area; the minimum size is preprogrammed by artificial [29].
After the determination of the seed region, we first calculate the mean of J-value of non-seed region pixels, and make the pixels whose value less than the average are the growth region. If the growth region is adjacent to one seed region, it will be included in the seed region. For the remaining unseeded area pixel, use smaller windows to calculate J-image [30]. Repeat the previous step to generate new growth area until it reaches the smallest scale. The remaining pixels are included to the adjacent seed area from small to large based on the J-value.
After regional growth it will generally occur over-segmentation, for the fragments produced after region segmentation, this paper first merged the fragments produced after region segmentation by using the color similar principle. Since the Euclidean distance is in the LUV color space, and the correlation between the two-color histogram is very low, so using the Euclidean distance as the merger conditions is reasonable. Then we use the color standard deviation as a secondary merge criterion [31].
First, we extract the color histogram of each region, and then calculate the Euclidean distance D
H
between the two histogram area R
A
and R
B
:
where p A and p B are the color histogram vector of region R A and R A .
When the threshold T H is set, if D H ≤ T H , we do the next step discriminant, otherwise, do not merge.
Then we introduce color standard deviation as a secondary merge criterion, it is defined as follows:
where q is the total band of remote sensing images, b is the number of bands, n A and n B are the number of pixels of the region R A and R B , σ A , σ B and σ merge respectively represent the standard deviation of region R A , R B and the merged area.
By the Equation (13), it can be seen that the D color further calculate of the color information for all bands in original image compared with the color histogram of criteria. Thus, even if different objects have similar color histogram distribution, but the color standard deviation is large, so as to effectively prevent the phenomenon of mistaken merger [32]. Set interval T C , if D color < T C , then consolidate area R A and R B . The specific merge strategies are as follows:
To verify the feasibility and effectiveness of the proposed algorithm, the two remote sensing images were used in the experiments. The first dataset is the multi-spectral aerial remote sensing image as shown in Fig. 1, the image spatial resolution is 0.6m. The second dataset is SPOT 5 pansharpening multi-spectral image of Shanghai area of 2003 as shown in Fig. 2, the spatial resolution is 2.5m.

The aerial remote sensing image.

The SPOT 5 remote sensing image.
In the experiments, we get the best segmentation results by changing the parameters of the method and comparing the different results. The following figure lists the effect of α value of the FCM algorithm in the color quantization step on the segmentation results to ensure the optimal segmentation result.
The vertical coordinates in the graph are
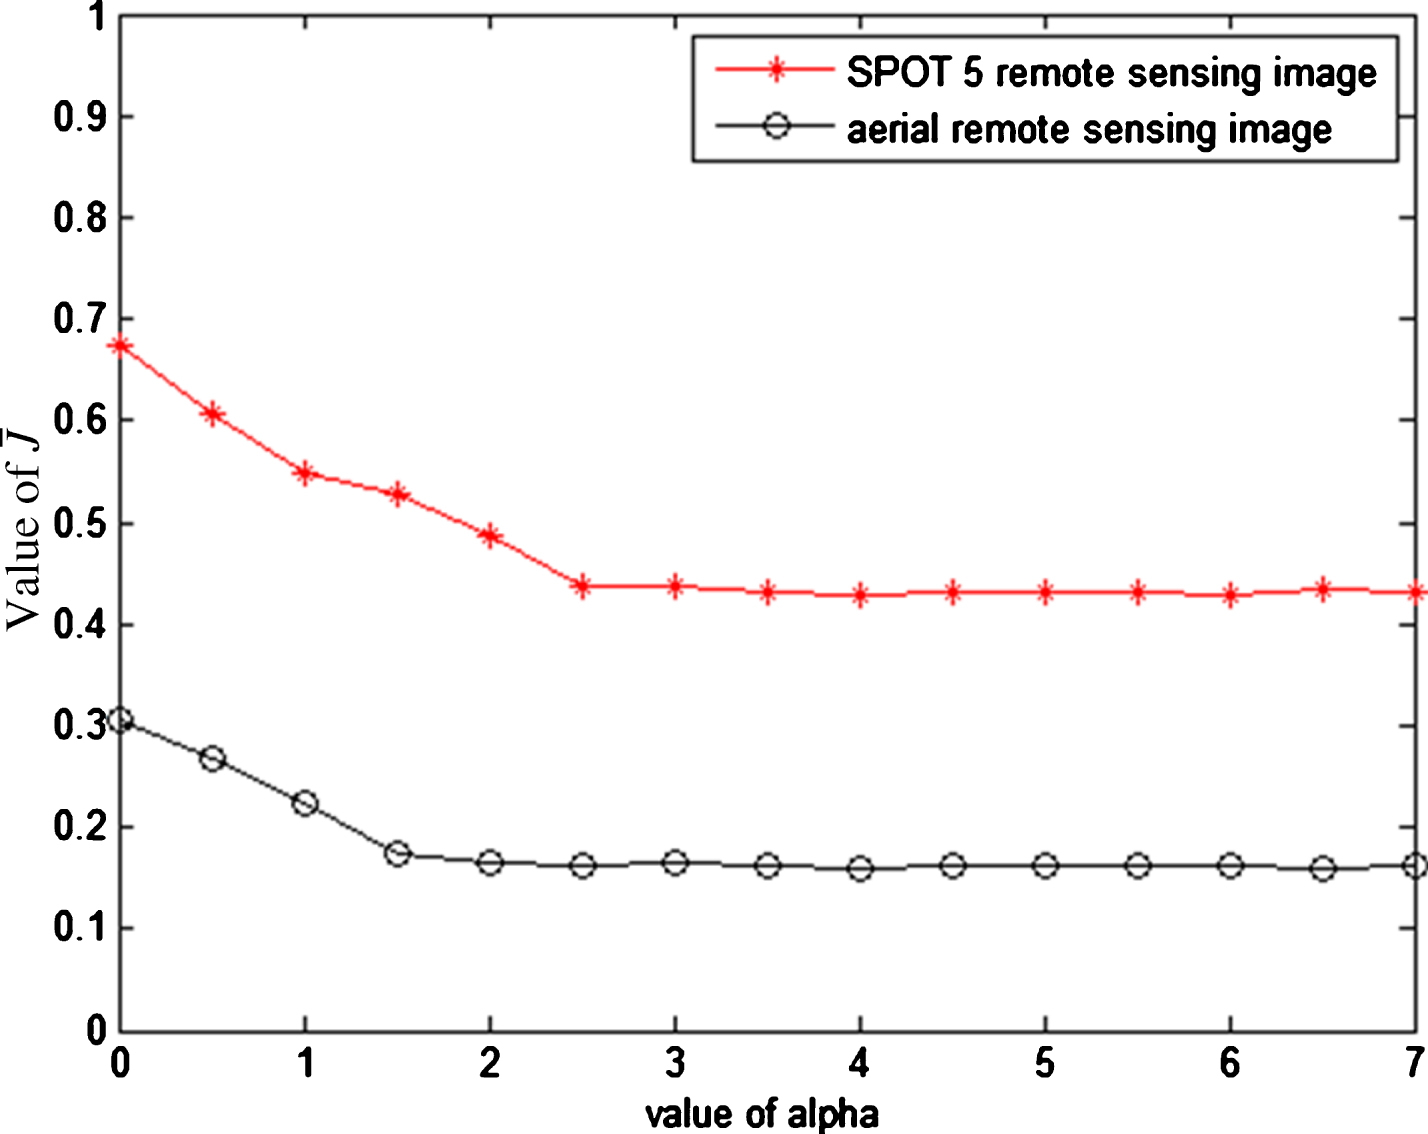
The effect of α parameters on the accuracy of segmentation results.
To further analyze the performance of the algorithm, we compare the results of the experimental with the results of FNEA algorithm based on the eCognition software and general JSEG algorithm.
In the experiments, the parameters are set as follows: c = 12, T
ɛ
= 0.001, nmax = 20, α = 1.5, T
H
= 0.18, T
C
= [2.5, 3.5]. For the segmentation by eCognition software, the scale parameter is set to be 50, the shape parameter be 0.7, the firmness parameters be 0.5. The JSEG algorithm uses a specific window size of 20 × 20, 10 × 10, and 5 × 5, and the threshold a is set to be 0.2. The experimental results are shown in Figs. 4–7.
Aerial remote sensing images. Result of this paper. ECognition result. JSEG result.


It can be seen by visual analysis, this is a aerial map of a school, it mainly consists playground, lawns, buildings and other texture-rich feature information. For the “A” area lawn, the proposed algorithm accurately segmented correct results. But the results of eCognition and JSEG methods were not carved out the smaller area of lawn that are lighter in color, exits the less segmentation phenomenon. For the sparser region B, the phenomenon of less segmentation is more obvious. And this method can precisely locate the edge of the image because it used the quantization step of FCM instead of the traditional quantization step. For the construction area C and D, there is over-segmentation in the eCognition and JSEG segmentation results that affected the accuracy of the segmentation results. The proposed algorithm is accurately extracted out of the outline of the building, effectively avoiding the over-segmentation of high homogeneity of the spectral region. There is a clear difference in the shadow of the spectral characteristics for the runway area E, the three algorithms are accurate segmentation of the shadow region and the runway region. For the playground F, this method and eCognition are all accurate extraction of the edge of the playground, but there is obviously over-segmentation phenomenon inJSEG methods.
The font type for running text (body text) is 10 point Times New Roman. For literal text, please use one of the sans-serif fonts, or Courier. Use roman as default style, and keep bold and italics for section headings, subsection-headings, author’s affiliations, and special emphasis. Font sizes and styles are indicated in Table 1. In order to get the correct font size and spacing, use the template styles as much as possible to format your text.
Segmentation accuracy quantitative analysis
Segmentation accuracy quantitative analysis
In the experiments, we set c = 15, T ɛ = 0.001, nmax = 20, α = 2.5, T H = 0.18, T C = [2.5, 3.5]. In the eCognition segmentation, the scale parameter is set to be 50, the shape parameter 0.7, the firmness parameters 0.5. For JSEG algorithm, we uses a specific window size of 20 × 20, 10 × 10, and 5 × 5, and the threshold a is set to be 0.2. The experimental results are shown in Figs. 8–11.

SPOT 5 remote sensing images.

Result of the proposed algorithm.

ECognition result.

JSEG result.
Similarly, we marked typical features in the picture with letters, as shown in Fig. 8, where in the area B, C, D and E for the building, area A for the road. Therefore, by comparing the three visual comparison charts of segmentation results, we can see that the three algorithms were able to split each area of remote sensing image basically, but for some edge details in the image, the eCognition software and JSEG algorithm were not dividing them out precisely. Such as regional D, the JSEG segmentation algorithm for locating the edges is not accurate, that exits a problem of less segmentation. By using FCM clustering algorithm, the proposed algorithm is more accurate to locate the edge of objects compared to the segmentation results of eCognition software. For area B, C and E, the JSEG algorithm exits obvious over-segmentation problem, but due to the improved merge strategy, the proposed algorithm solved the problem well, and is more accurate than the segmentation results of eCognition software. Meanwhile, for the road area A, due to the features of the area is single, so the three methods can all accurately segment the road area.
To further analyze the feasibility of the proposed method, we use the evaluation criteria proposed by Y. Deng et al to compare the segmentation accuracy of three algorithms. Define
where, N is the total number of pixels in the image, M t is the total number of pixels for the region t (t = 1, 2 … N), J t is the J indicator of the region t. J index reflects the degree of color homogeneous distribution in the region of the segmentation results.
The
As shown in Table 1, the
The conventional JSEG method is not very accurate for the target edge localization in segmentation results. To solve this problem, this paper proposed an improved segmentation method of remotely sensed image based on JSEG algorithm and FCM with spatial constraints. Aiming at the problem of the low precision of traditional JSEG algorithm for the segmentation of high resolution remote sensing image, the proposed algorithm used the appropriate improvement strategies and achieved good results. The method first used the FCM clustering method based on the combination of spatial neighborhood terms is used to replace the traditional HCM clustering method in the quantization step, then used the region growing method to segment the class diagram after FCM clustering, finally, using the improved regional merger approach to merger the over divided region after segmentation. Through the experiments it can be seen that the proposed algorithm can extract the edge of target more accurately, and improve the precision of the segmentation result.
Footnotes
Acknowledgments
This work is supported partly by National Natural Science Foundation of China (No. 61601229, No. 61603124), the Fundamental Research Funds for the Central Universities (No. 2018B16514).