
Abstract
Based on the precise logical analysis method, the paper constructs a comprehensive evaluation model of transportation superiority in terms of transportation network density, the influence of transportation arteries, and regional location-specific advantages, then select Southwest China as a case to evaluate the transportation superiority and analyze the correlations of transportation with regional economic development and population distribution. The results show that there is a positive correlation between regional transportation superiority and regional population density as well as GDP per capita in the spatial distribution. Finally, by using the fuzzy logic analysis method, we propose countermeasures and suggestions for the impact of transportation integration on regional economic development and population distribution.
Introduction
The relationship between transport and the economy and population has long been an important topic of academic interest, and the impact of transport on the economy and population has been at the forefront of economic and policy research for many years [15, 24]. Since the 1980 s, Aschauer has initiated a wave of quantitative empirical studies that have demonstrated the output elasticity and spatial benefits of transport infrastructure [2, 30]. As a special region with a relatively poor economic level and sparse population, transport plays a crucial role in economic growth and population distribution in poor areas [12, 28]. Empirical studies in poor areas of the world have shown that one of the reasons for their low economic level and the sparse population is the disadvantageous transportation conditions [7, 29]. Improved transport can contribute to economic growth and population growth in deprived areas [11]. The development of transport infrastructure is a necessary condition for economic growth. The expansion of roads leads to significant economic growth, and the changes in accessibility brought about by road construction indirectly change local productivity, market reach, transport services, and income levels, directly affecting population distribution [5, 26].
In recent years, much attention has been paid to the issue of sustainable development in disadvantaged areas [32]. Studies on the relationship between transport and the economy have gradually increased in China [17, 24]. Some scholars in China have used spatial analysis and econometric tools to explore the relationship between transport development and economic growth in poor regions [12, 31]. In the relatively poor southwest region of China, long-term transport infrastructure development has contributed to the growth of the local economy [1, 21]. Most studies have been conducted to reveal the coupling strength and coordination between transport and economic systems at the numerical level, but less have explored the influencing factors of this coordination relationship, so more accurate quantitative studies are needed on the deeper relationship between transport, economy and population [3, 22]. To this end, this study conducts a study on the spatial concurrency of transport with regional economy and population in southwest China based on both exact and fuzzy logic analysis methods, which is important for improving the regional influence and socio-economic level.
Data sources
Transport artery data in the study area: sourced from the results of the first national geographical survey. It includes geographic unit data, structure element data, transport data, waterway data, metadata, and land surface coverage data, which is used to collect extracts from some airports and transport arteries in the study area. Airport route data: sourced from the website of the Civil Aviation Administration of China. Used for the extraction of airport routes. Road attribute data: sourced from the Ministry of Communications. Used as auxiliary data for road statistical analysis. Waterway data: sourced from the First National Water Census. Used as a reference basis for waterway extraction. Demographic and economic data: sourced from the Statistical Yearbook. Used for the extraction of data on demographic and economic topics.
Methods
Precise logical analysis
A precise mathematical and quantitative logical analysis method is used to first study the level of transport dominance, and then to quantify and measure the comprehensive transport capacity of the region, followed by the analysis of the transport data set of the study area using transport network density, transport arterial influence and location-specific advantages as indicators, and to evaluate the level of advantages and disadvantages of the comprehensive transport network in the counties set as administrative units. transport network density is used to measure the length of transport arteries per unit area of land in the region, and a high value indicates sustainable development of the regional transport infrastructure. The greater the value is, the better the construction of regional transport infrastructure is. The transport arterial influence is used to represent the comprehensive situation of public transportation facilities such as expressway entrances and exits, national roads, provincial roads, railway stations, airports, ports and so on within the region. The larger the value is, the stronger the comprehensive transportation capacity of the region is [4, 10]. location-specific advantages are used to measure the advantage of a region in geographical position. If the transport distance between a region and the central city is used to measure it, the greater the value will indicate the better geographical position of the region. The flow chart is as follows Fig. 1.
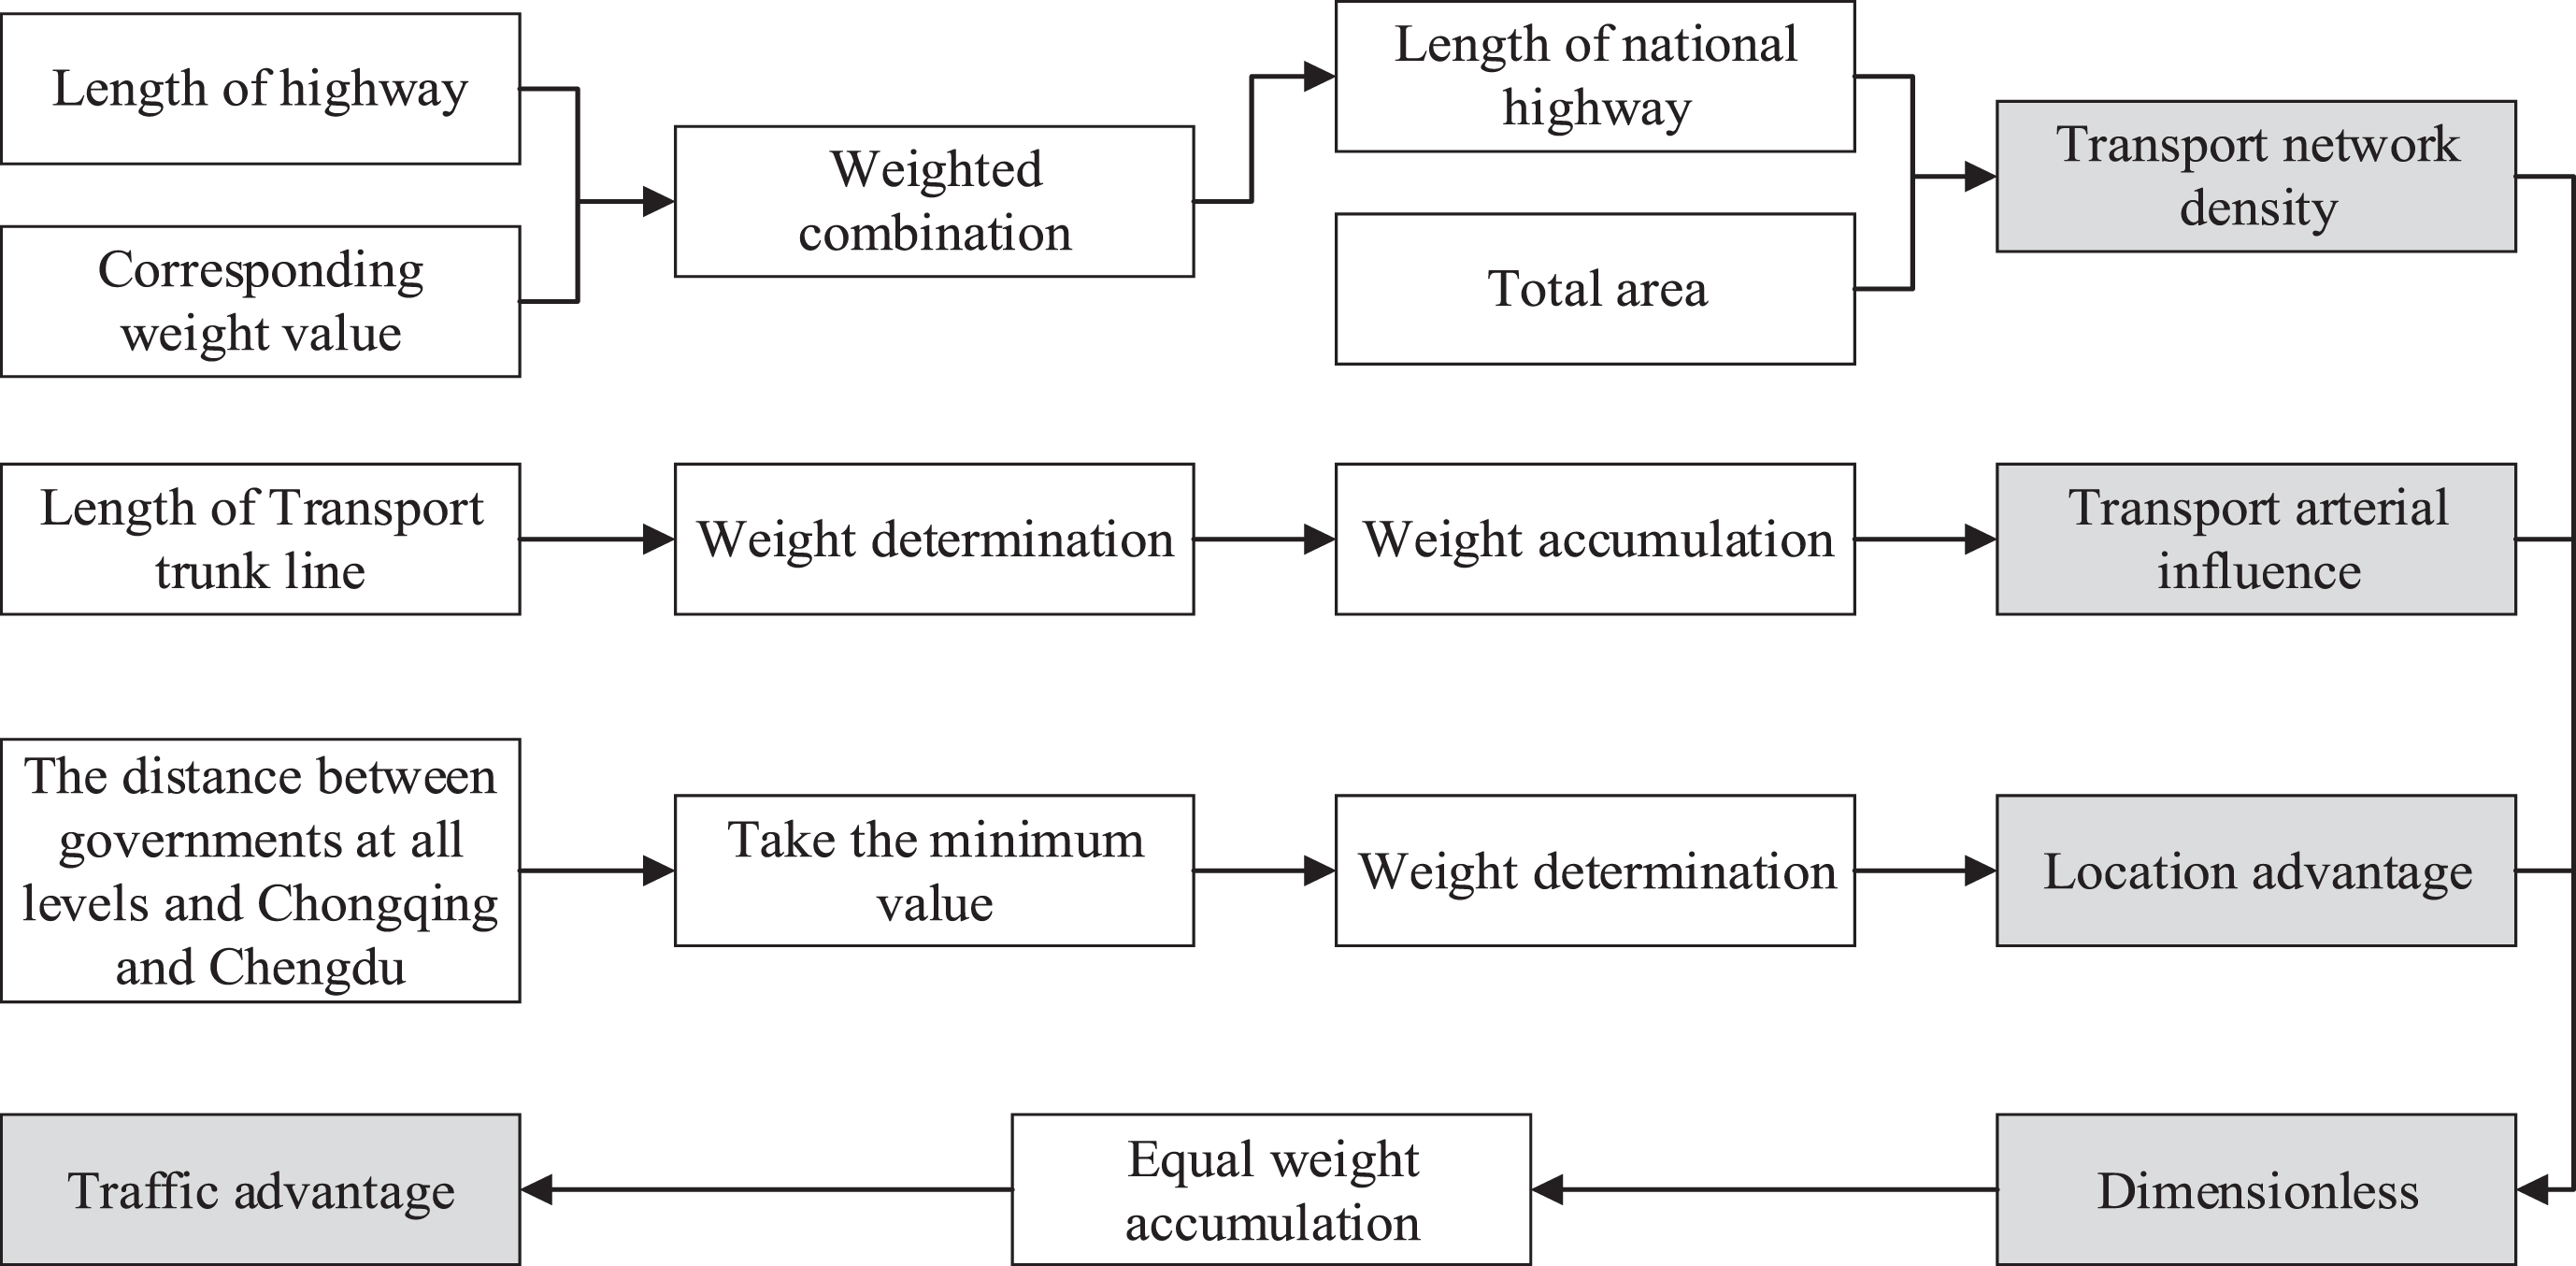
Flowchart of transport Advantage Evaluation.
If taking the highway network as the evaluation subject, the main indexes that represent the density of the road network are road density, grade road density, etc [13, 16]. According to the technical regulations for the delineation of provincial main function areas, the transport capacity of different grade roads is different, so the equivalent expressway is introduced to calculate the density of the road network. Regarding the level of the road technology (highway, first-class roads, second-class roads, third-class roads and fourth-class roads), thereof set the weights of different grade roads [19]. Set the weight of an 8-lane expressway (after converting all kinds of cars into small passenger cars, the maximum daily traveling vehicle is 100000) as 1, then the weight value of each grade of a road is shown in Table 1 [20].
Weighting values of different classes of roads
Weighting values of different classes of roads
The transport network density is calculated as the ratio of regional road mileage to regional land area, i.e., the number of road mileage per unit area. Where L
i
the equivalent length of a national highway in a region, which is calculated as the length of a L
j
highway of the j same class as a regional i highway [27].
Road, rail, waterway and air data is used to calculate the impact of transport arteries. Expert Scoring Method has been applied in this paper, for a county, county-level city and district, a value of 1.5 is assigned for having a highway, 1.0 for a national road and 0.5 for a provincial road; 1.5 for a railway station; 1.0 for a mainline airport and 0.5 for a regional airport; 1.5 for a main hub port and 0.5 for a general port. The weight values for each county corresponding to the transport artery impact are shown in Table 2. The weighted values are added up to determine the influence of each county, county-level city and district on the transport arteries.
Transport trunk line technical rating evaluation and weight assignment
Transport trunk line technical rating evaluation and weight assignment
Location-specific advantages refer to the location conditions and the degree of advantages and disadvantages reflected by the transportation distance between each county and the central city. In the calculation of the location-specific advantages, a prefecture-level or above the city with significant influence on the population and economy of the region within or outside the province is selected as the central city, and then the distance from the seat of the people’s government of each county, county-level city and district to the people’s government of the city with significant influence is calculated, and the minimum value of the distance is taken as the distance from the county to the central city, and then a value is assigned according to the distance. The calculation assignment is shown in Table 3.
Classification and evaluation of distance from the central city of each place
Classification and evaluation of distance from the central city of each place
After the above calculations, the data of transport network density, transport arterial influence and location-specific advantages are obtained for each county, county-level city and district, and the three data of each county, county-level city and district are processed without dimension, and the results are between 0 and 1. The specific calculation formula is as follows.
Where Z is the standard score of the indicator, X is the value of the indicator for a county, county-level city and district (transport network density, transport artery influence, location-specific advantages);
X min and X max is the minimum and maximum values corresponding to the indicator respectively. The values calculated for the three indicators are added together to obtain the degree of transportation advantage for each county (city or region).
Fuzzy logic analysis methods
Based on the Statistical Yearbook, and taking county-level administrative divisions as the object of the study, we collected GDP per capita as the economic index, population density as the demographic index, and transportation superiority as the transportation index. Based on the three indexes, the normalization method is used to obtain the economic index G, the population index P and the transport superiority index MN. The three indexes are graded separately, and then the transport superiority is subtracted from the economic index and the population index to obtain the data MN - G and MN - P. According to the situation of the study area, the relationship between transport and economy was classified into three types, transport-economic coordination type, transport-economic adaptation type and transport-lagging economy type, and the relationship between transport and population is classified into transport comfort type, transport saturation type and transport congestion type. And based on the logical analysis method of fuzzy uncertainty, it proposes countermeasures and suggestions on the influence of transportation integration on regional economic development and population spatial distribution.
Transportation superiority results and analysis
In order to unify the units, transportation network density, arterial influence, and location-specific advantages are all normalized.
Transport network density
It can be seen from Fig. 2 that the transport network density in the western part of the study area is much smaller than that in the eastern part. Compared to others, the transport network density is larger in Chengdu city, Sichuan province, as well as Wanzhou and Jiangjin districts of Chongqing city, mainly due to the better transportation infrastructure constructions, dense transport network, and higher road grades in these regions.
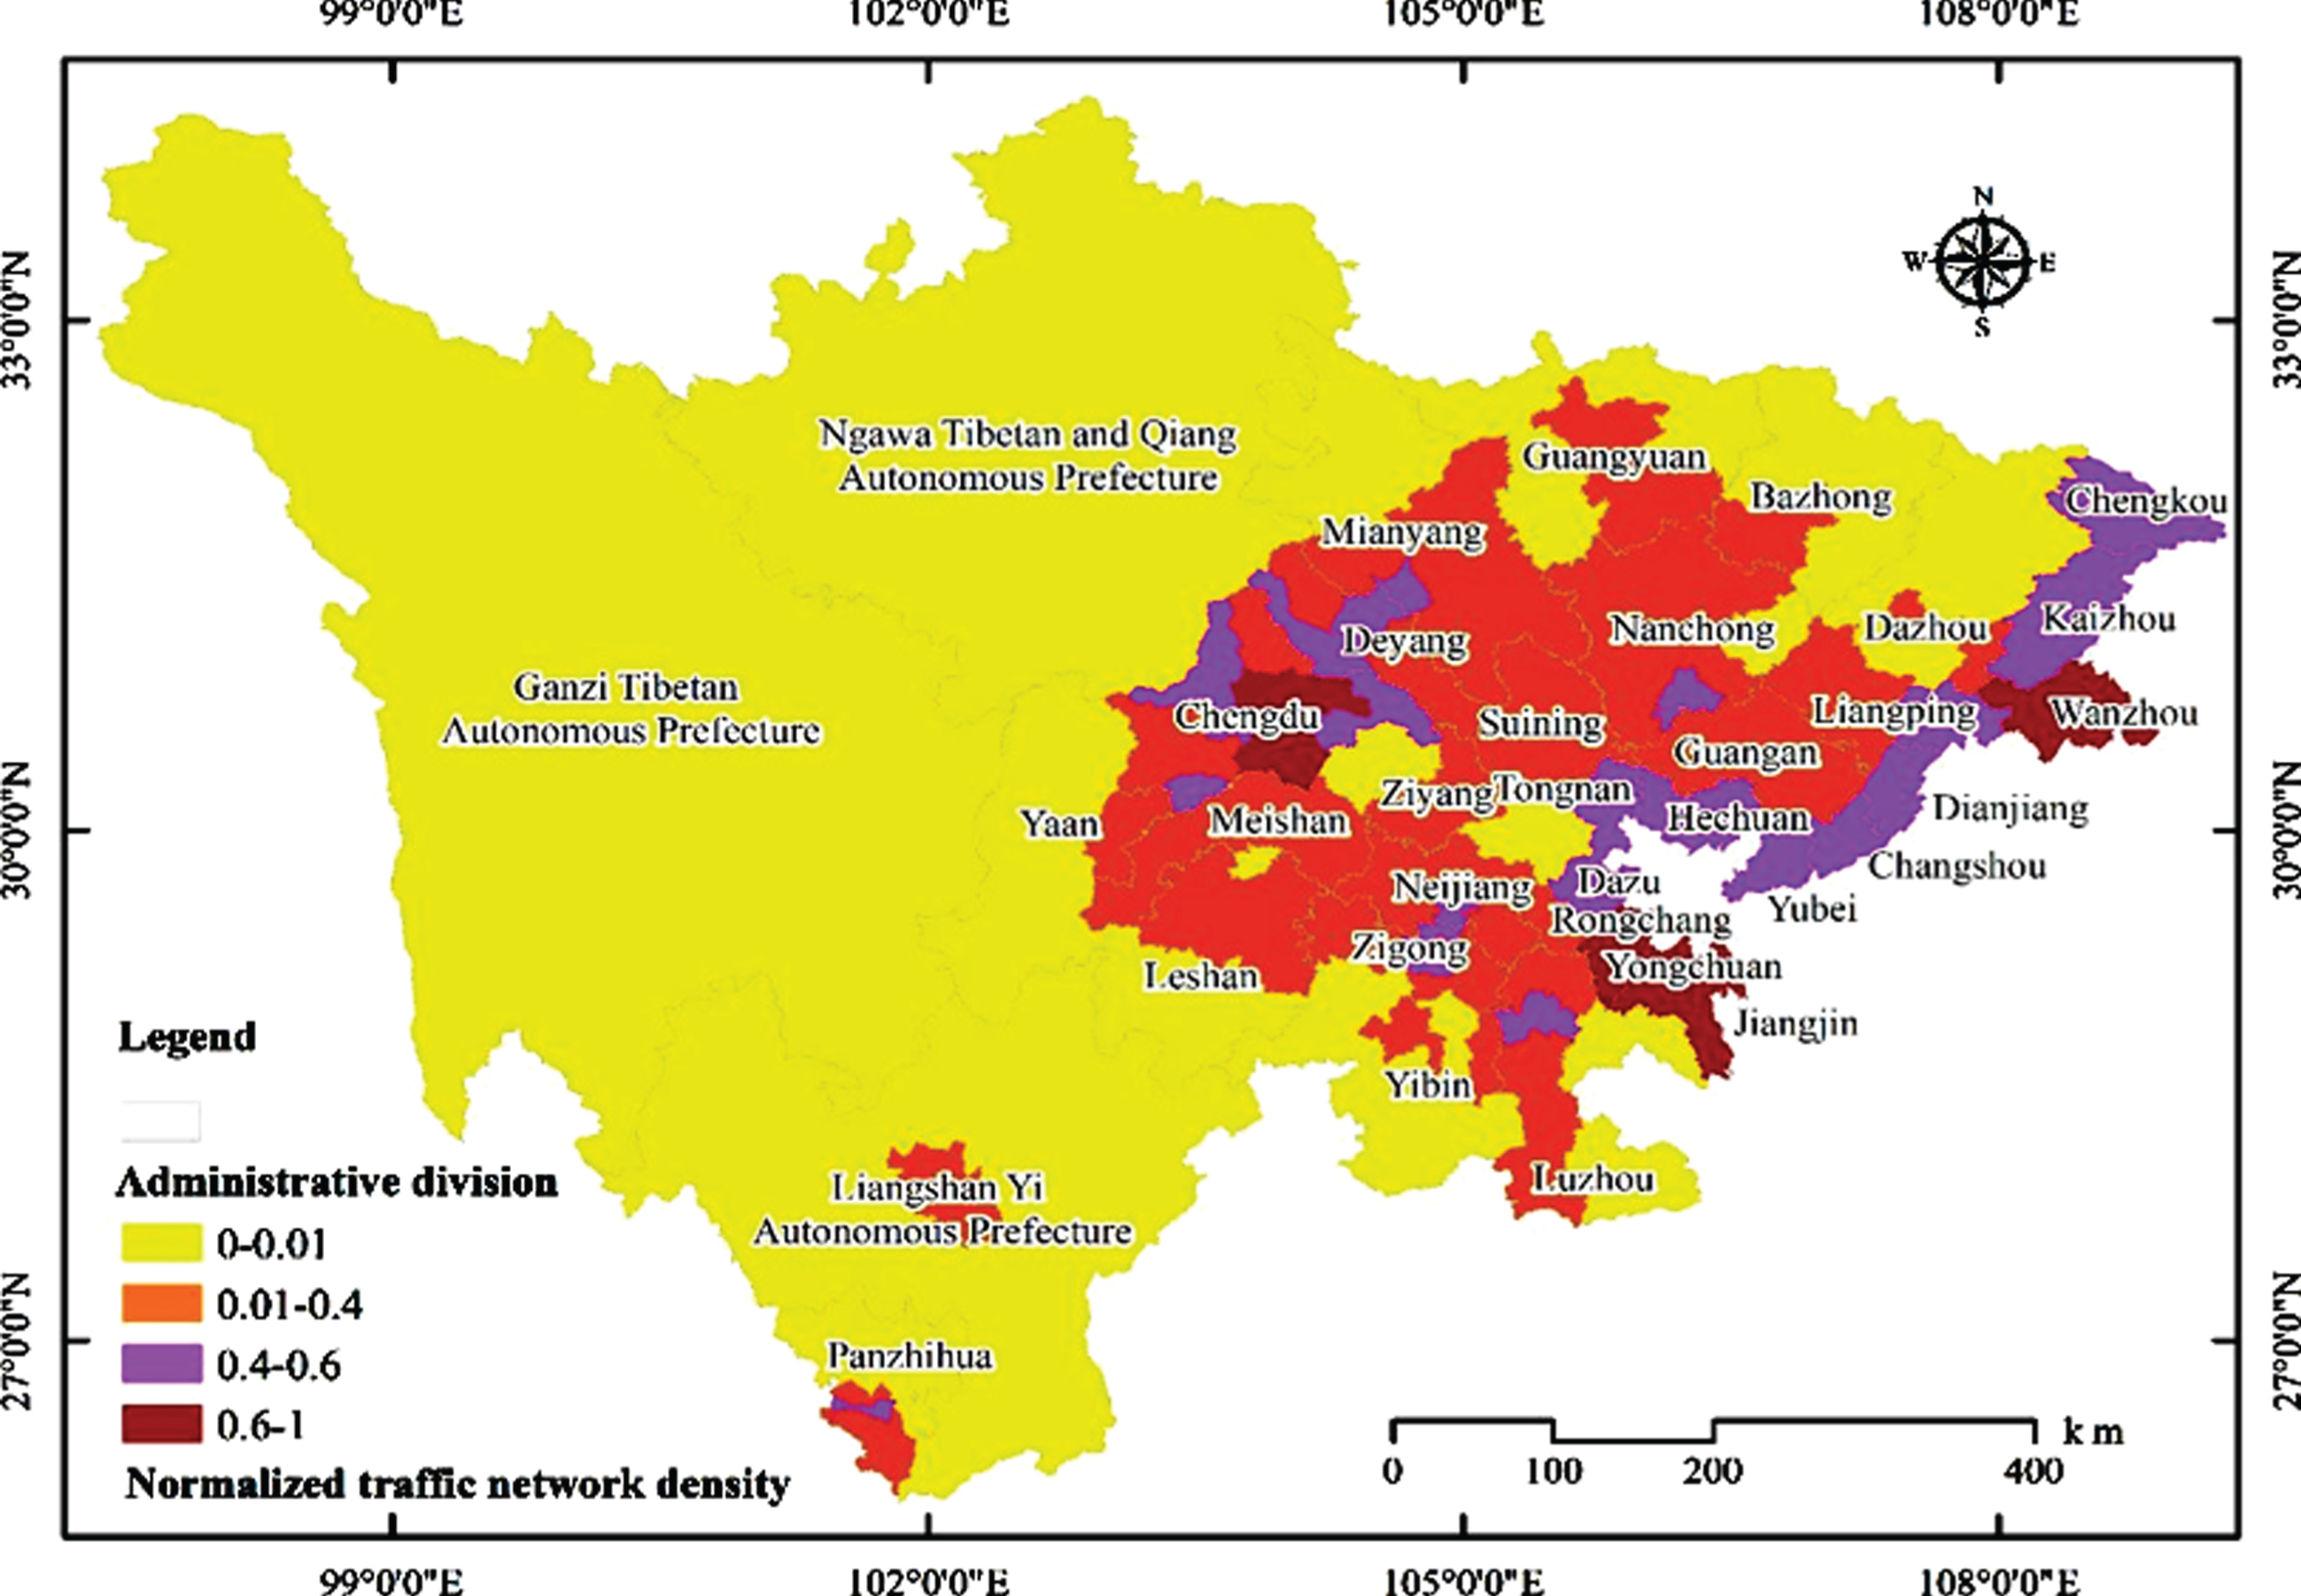
Normalized transport Network Density Map.
It can be seen from Fig. 3 that the major transport arteries are concentrated in Chengdu city, Meishan city, Ziyang city and the area along the Chengdu-Kunming Railway in Sichuan province, as well as Wanzhou district, Changshou district and Hechuan district in Chongqing city, which are bordering with Sichuan, mainly due to the well-developed highway and railroad networks and the advantage of the Yangtze River waterway in some areas. Although there are only a few highways in the western part of the study area, national roads and provincial roads are relatively well developed, and highland airports are also equipped, so the influence of transport arteries is greater in some western areas.
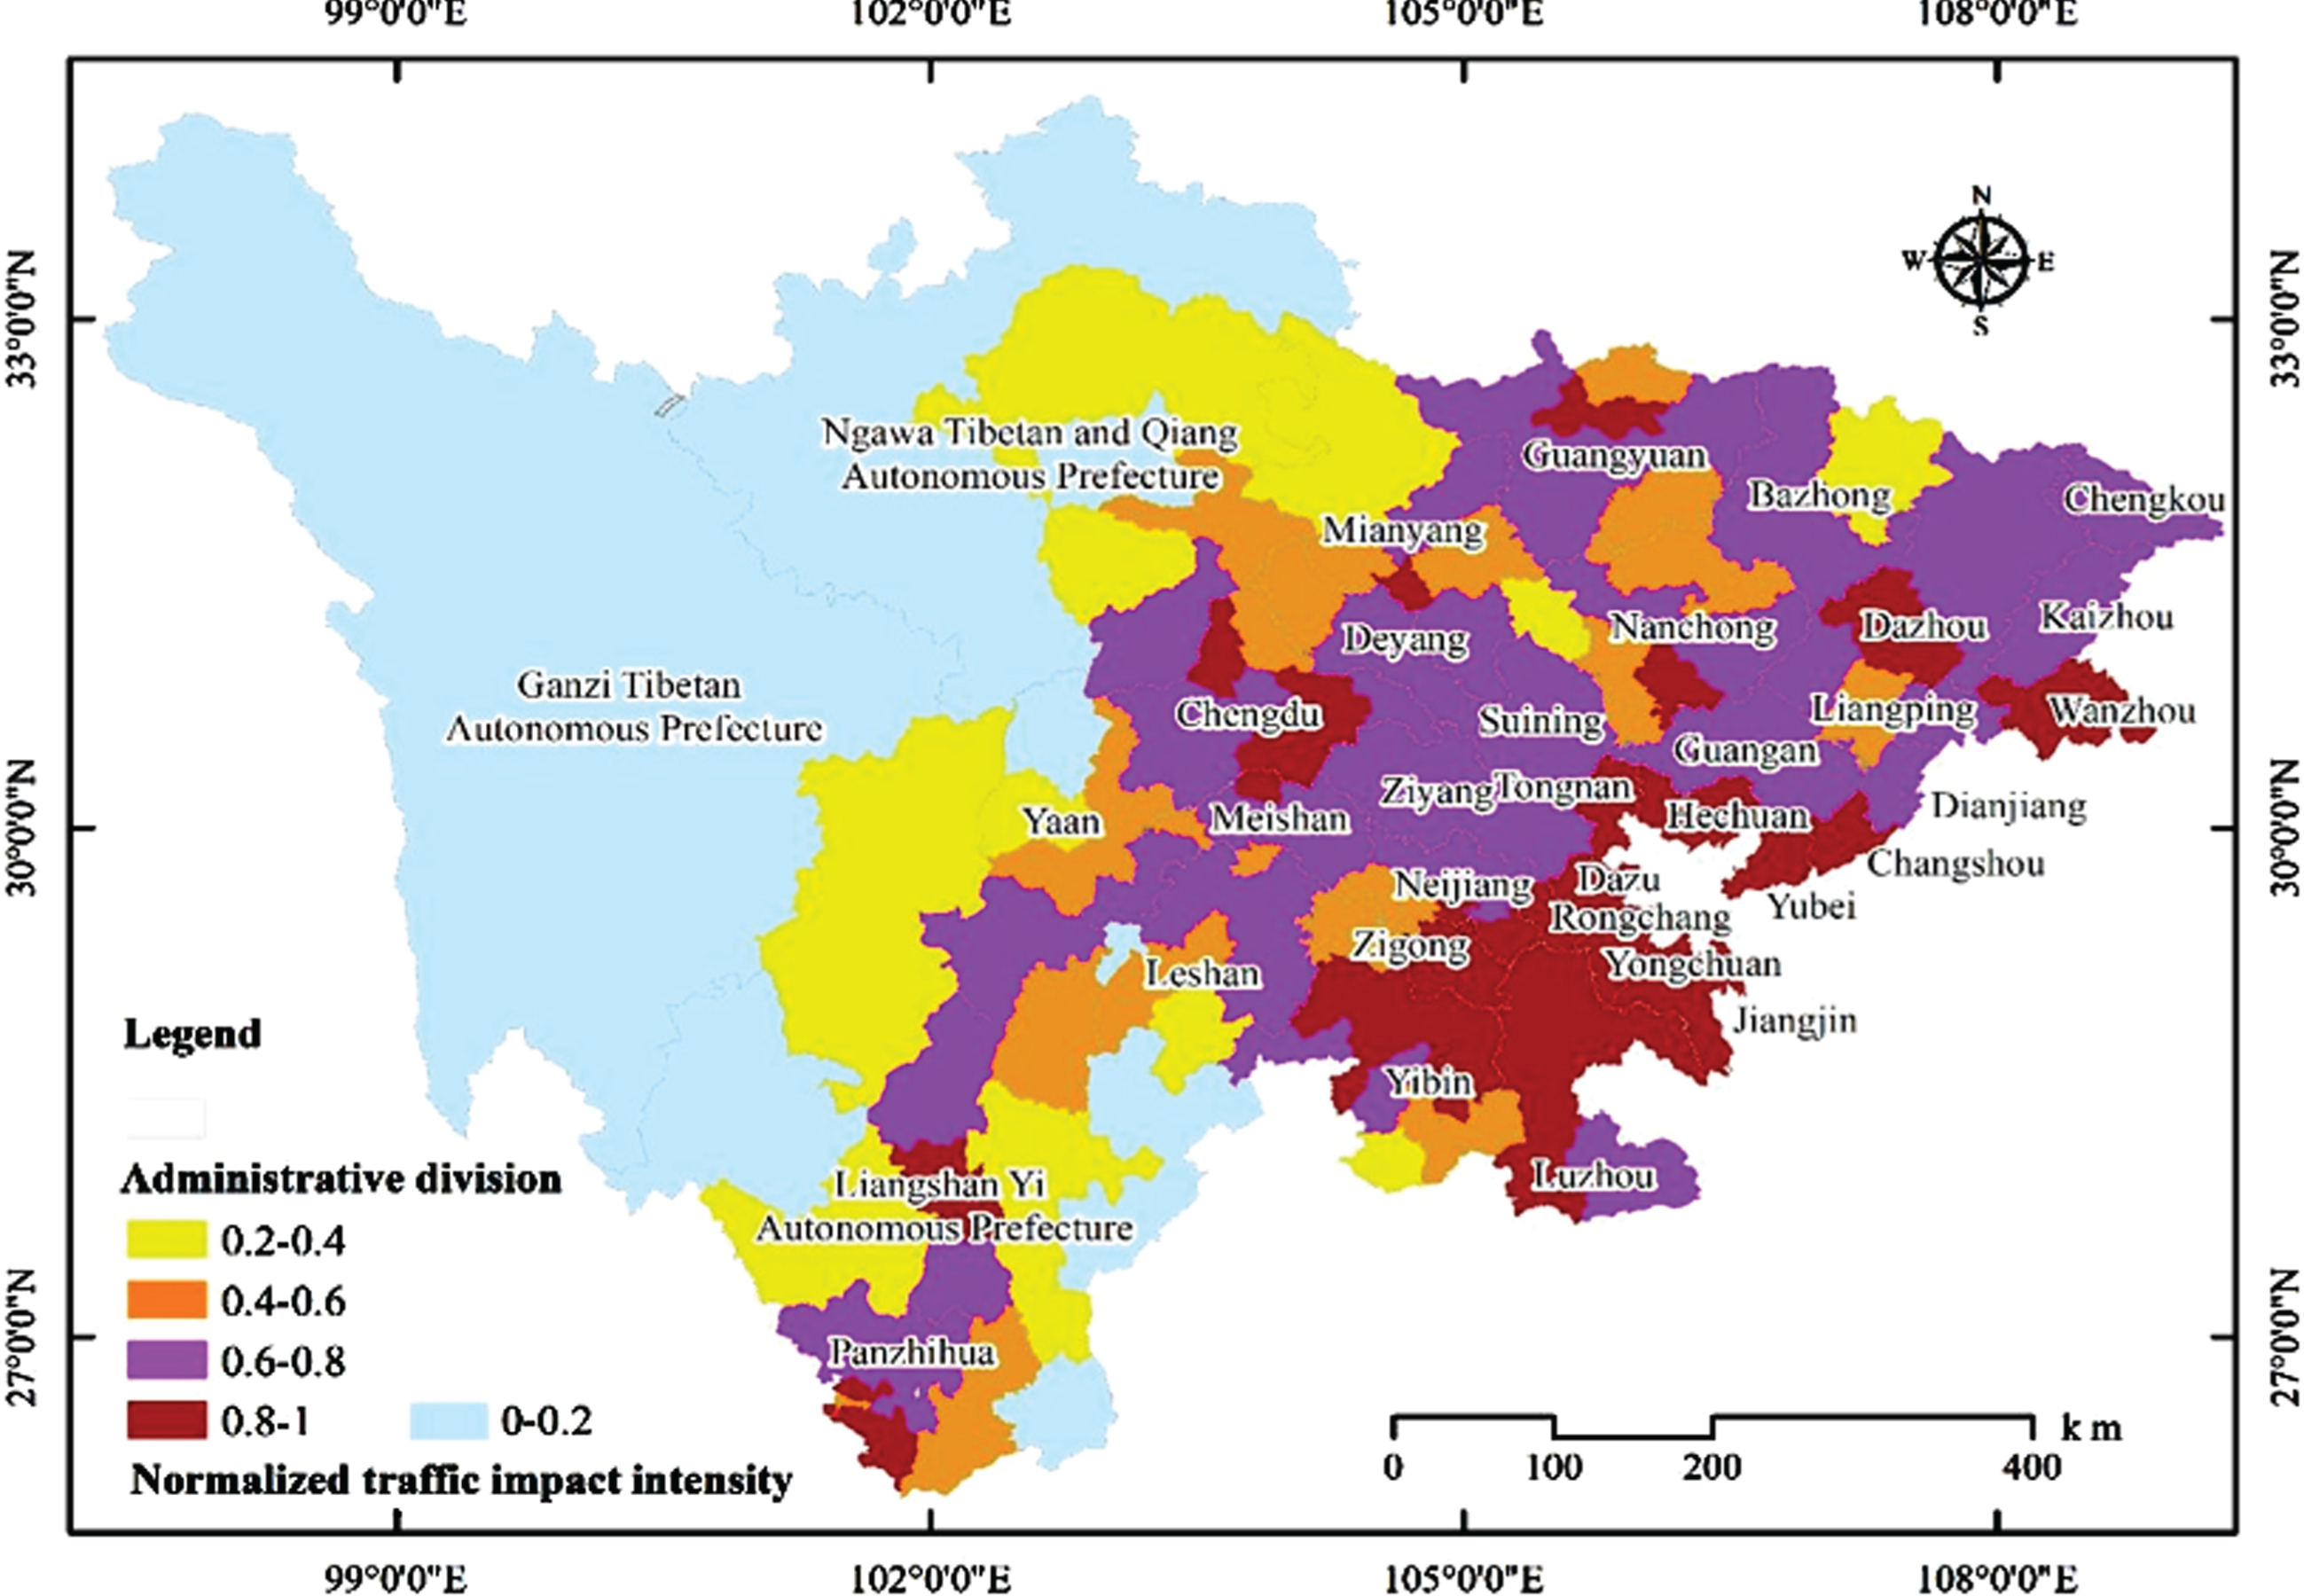
Normalized transport Arterial Impacts.
Figure 4 shows that the location-specific advantages are proportional to the distance from the region to Chengdu and Chongqing, i.e., the closer the region is to Chengdu and Chongqing, the larger the value of the corresponding location-specific advantages is, and vice versa.

Normalized location-specific advantages.
From Fig. 5, we can see that: the counties under Chengdu and Chongqing in Sichuan province have the largest transportation advantage. This is determined by the political and economic center status of Chengdu and Chongqing. The implementation of national strategies such as Chengdu-Chongqing economic zone, Chengdu-Chongqing city cluster, and Chengdu-Chongqing twin cities economic circle have given the region significant advantages over other regions in terms of highways, railroads, and airports. However, the traffic construction in the peripheral cities and counties still faces greater pressure, and the level of traffic construction still needs to be further improved.

Transportation Superiority.
There are 196 counties county-level cities and districts in the study area, and Fig. 6 shows the relationship between normalized transportation advantage and normalized GDP per capita for each county, county-level cities and districts. It can be seen from the graph that the two trends are the same, i.e., the region with a larger value of normalized GDP per capita corresponds to a larger value of normalized transportation dominance and vice versa.
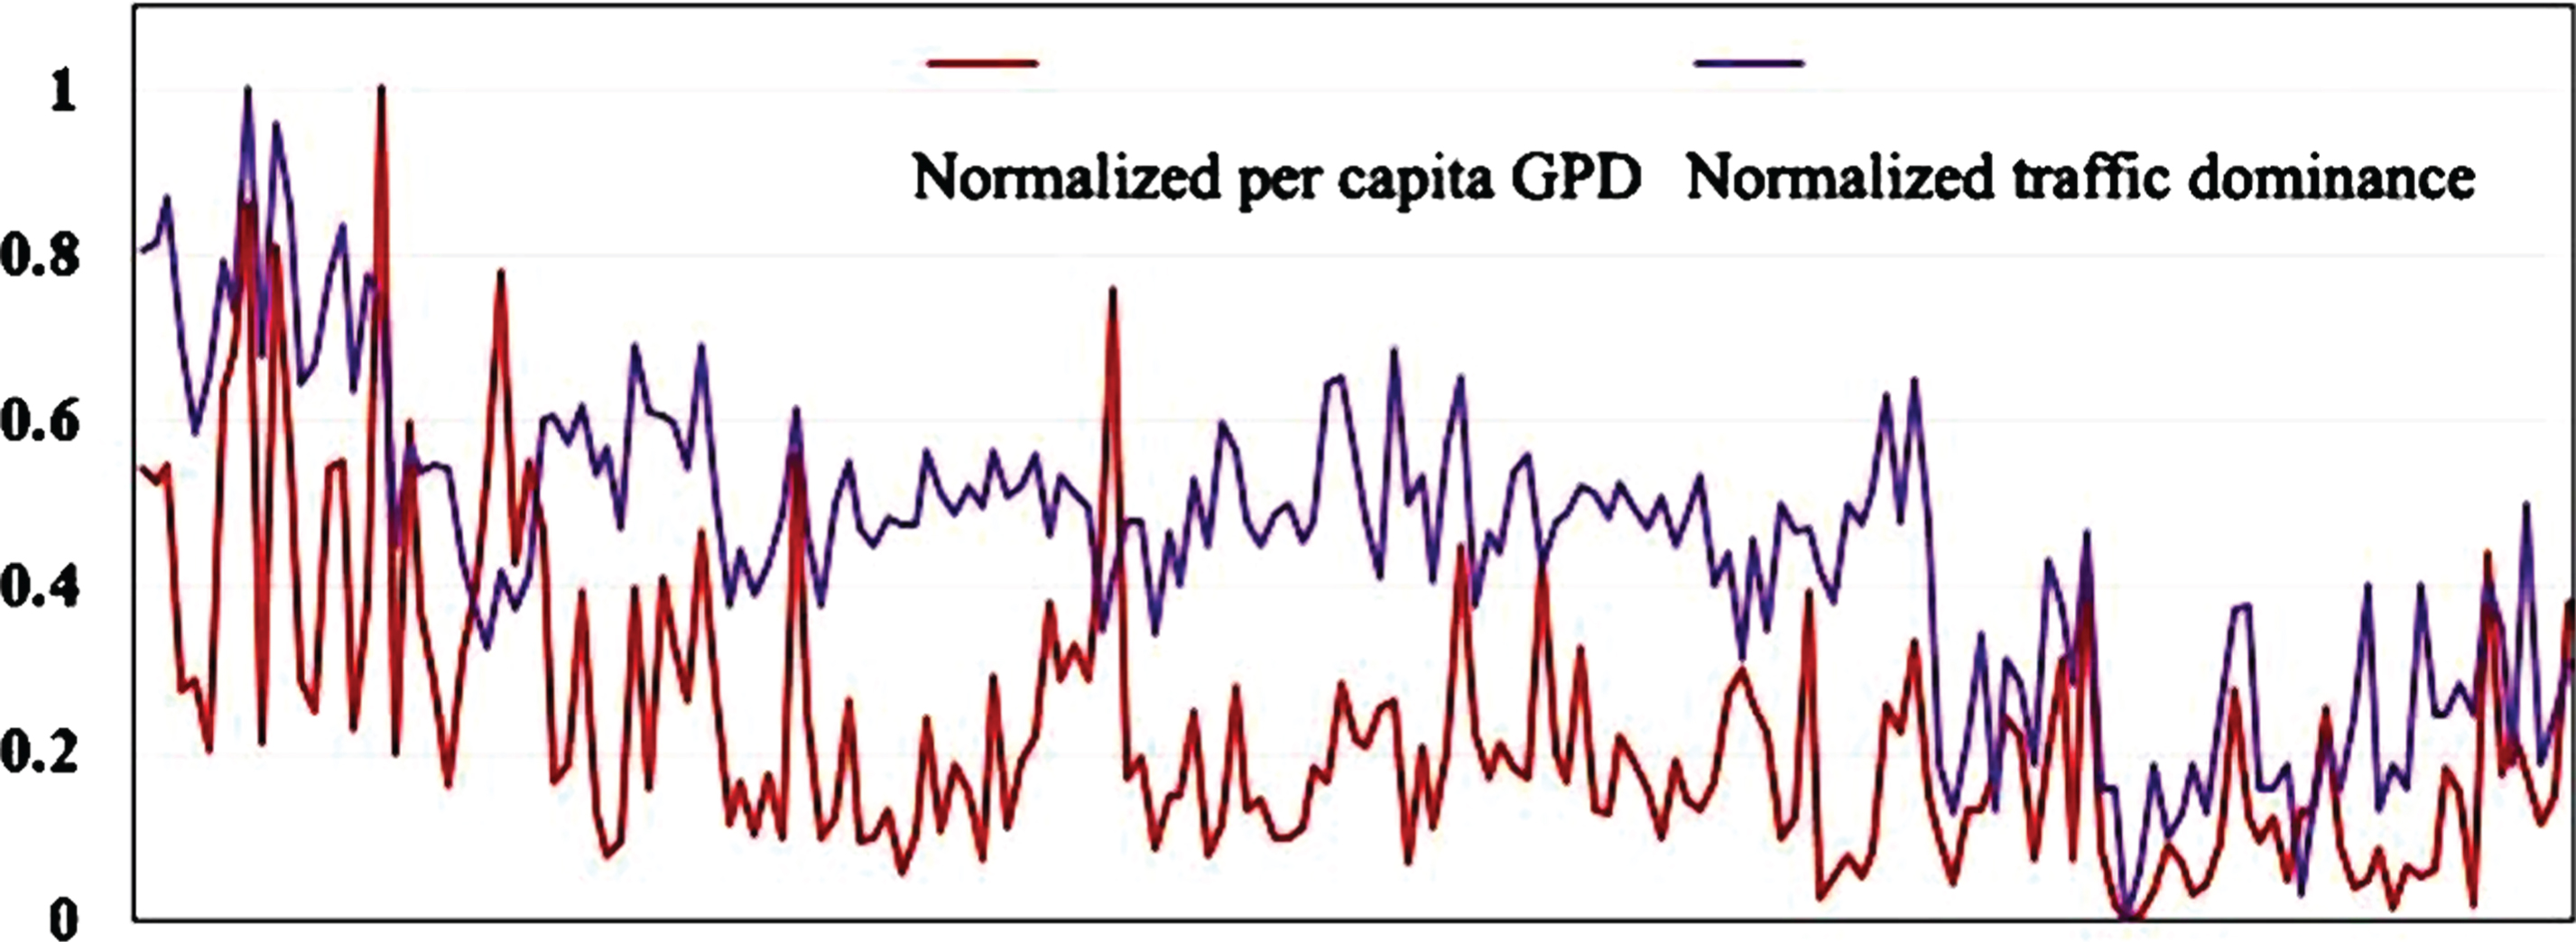
Relationship between Transportation Superiority and GDP per capita.
In order to quantitatively analyze the correlation between the two, a quadratic polynomial regression analysis is used to fit the normalized GDP per capita to the normalized transportation superiority using a quadratic function. Figure 7 shows the fit between the normalized GDP per capita and the normalized transportation advantage. The black dashed line in the figure shows the fitted fit curve.

The fit of Normalized GDP per capita to Normalized Transportation Superiority.
Figure 7 shows that the slope of the fitted line is initially large and then becomes progressively smaller. The square value of the coefficient of determination is 0.3657, and there is a correlation between the normalized GDP per capita and the normalized transportation superiority. When the normalized GDP per capita is less than 0.7, the normalized transportation advantage increases with the increase of normalized GDP per capita; when the normalized GDP per capita is greater than 0.7, the trend of normalized transportation advantage becomes larger with the increase of normalized GDP starting to slow down; when the normalized GDP per capita is greater than 0.85, the normalized advantage reaches stability. This indicates that there is an upper limit to a region’s transportation superiority, which will not increase infinitely with the improvement of regional economic level, and when the region’s transportation superiority reaches saturation, it will not increase with the improvement of the level of economic development in a region.
Figure 8 shows the relationship between normalized transportation Superiority and normalized population density for the 196 county-level cities and districts in the study area.

Normalized Transportation superiority in Relation to Normalized Population Density.
It can be seen from Fig. 8 that the study area’s population is concentrated in a few counties, resulting in a higher population density in those counties, while the population density in the remaining counties does not vary much; there are large fluctuations in the transportation dominance of the counties. Areas with higher population densities correspond to greater transportation dominance.
To quantitatively analyze the relationship between regional population density and transport dominance. The logarithmic function fitting method is used to analyze the functional relationship between the normalized transport superiority and the normalized population density, and a fit curve is drawn as shown in Fig. 9. The black dashed line in the figure shows the fit curve.
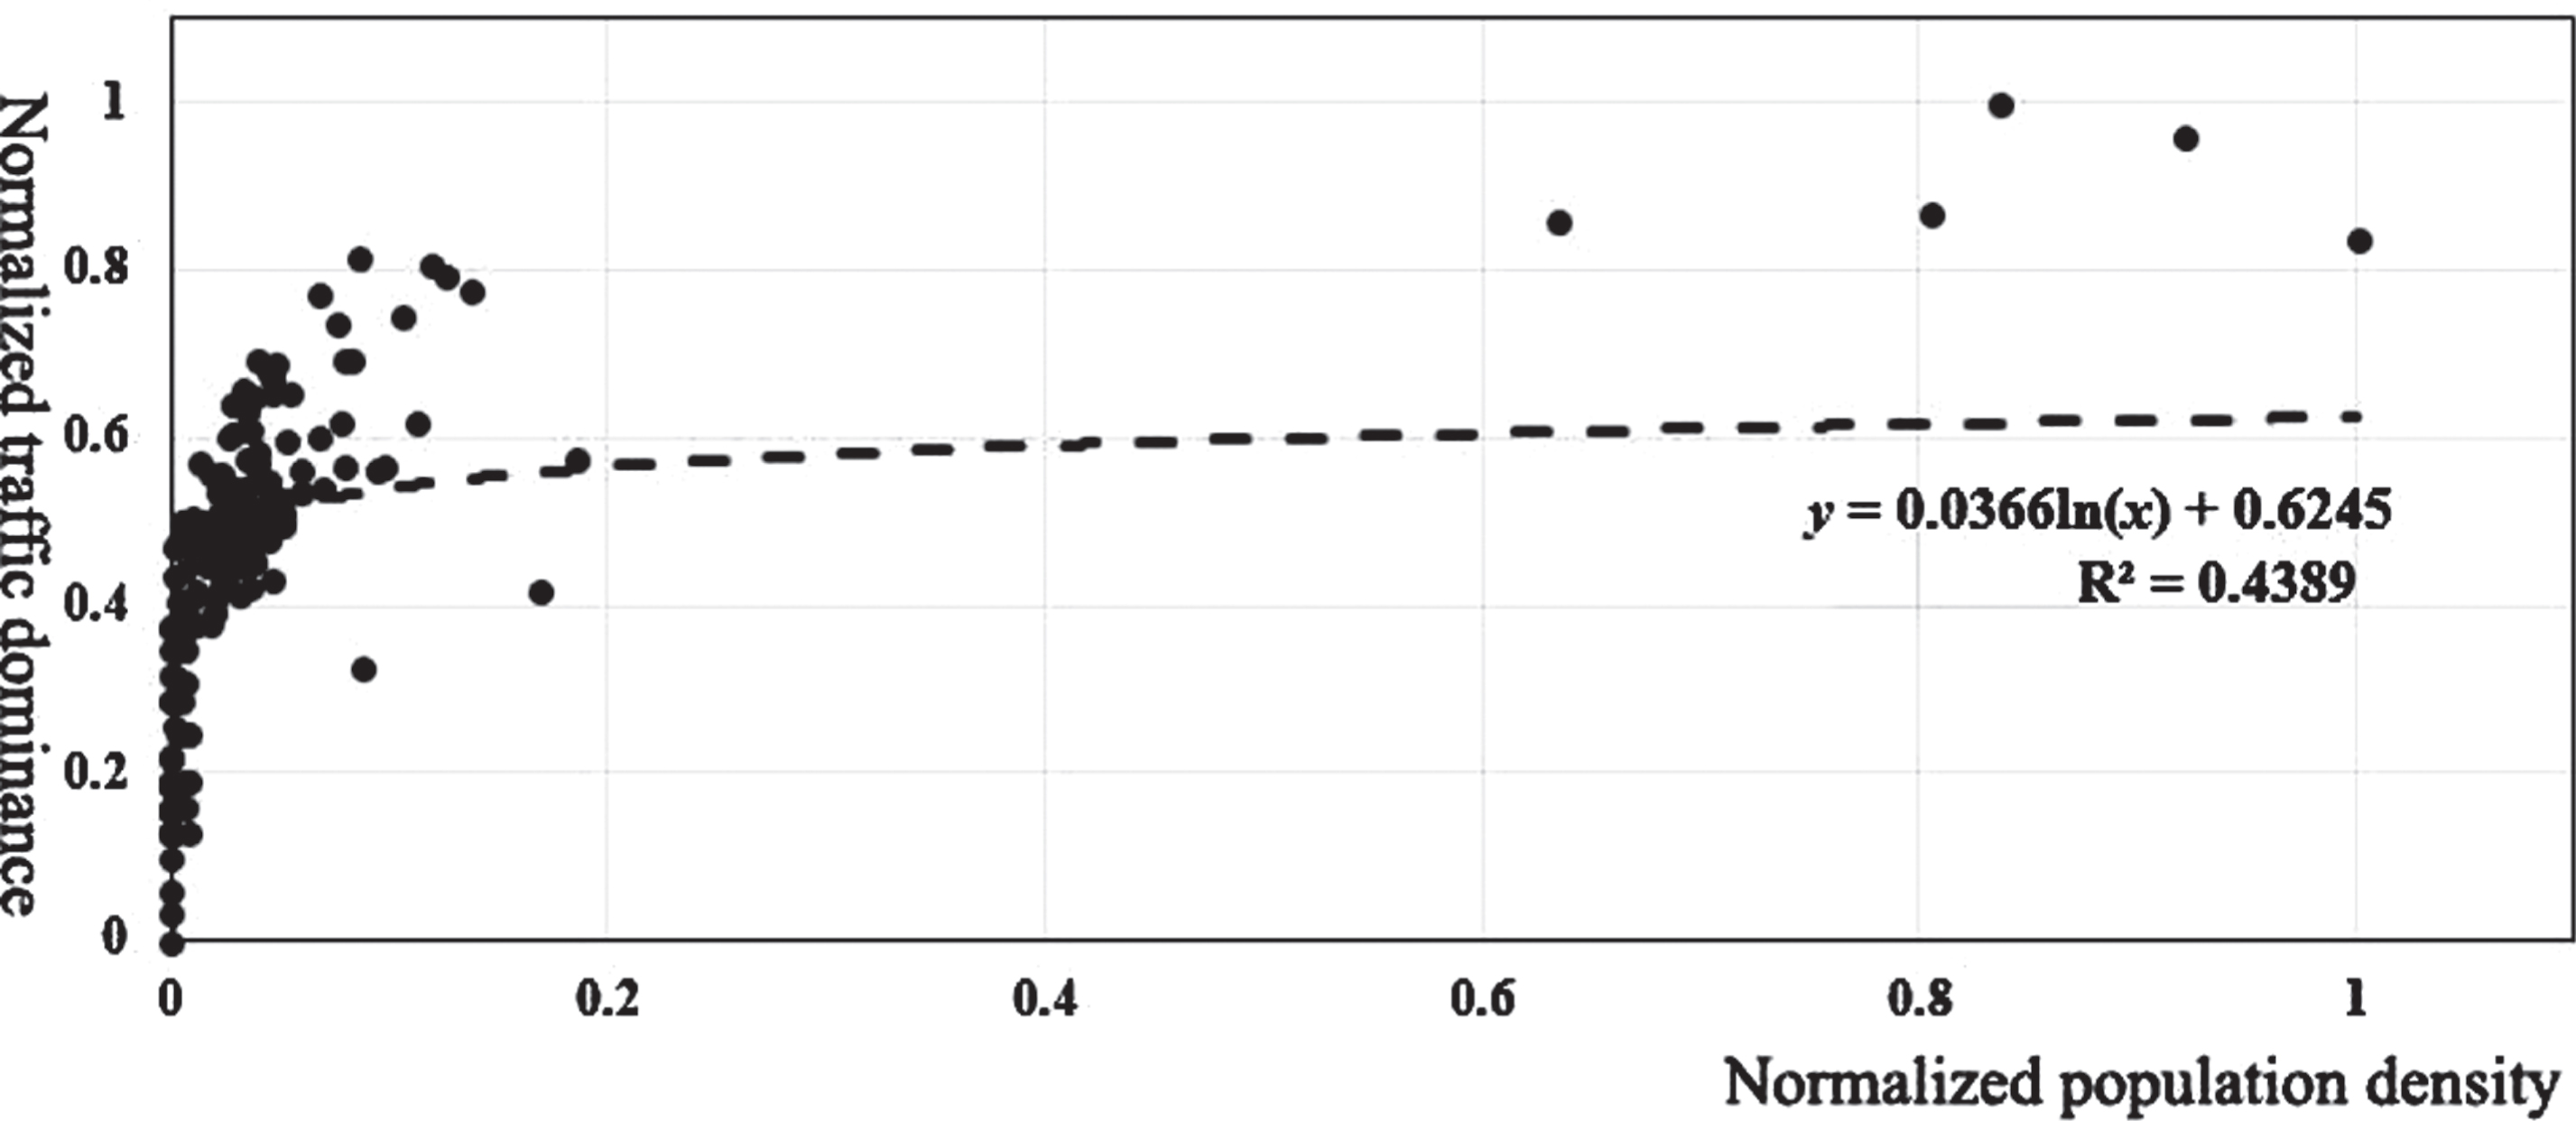
The fit of Transportation Superiority to Population Density.
It can be seen from Fig. 9: the normalized transport superiority is the logarithmic function of the logarithm of the normalized population density, and The square value of the correlation coefficient between them is 0.4389, showing a good correlation. The logarithmic function is characterized by a large initial curve slope, the curve rises faster; after reaching a certain critical value, the slope of the curve is close to zero, the curve maintains its level, and no longer rises. When the normalized population density is less than 0.1, with the increase in population density, the transportation superiority increases rapidly; when the normalized population density is greater than 0.1, the transportation superiority increases slightly with the increase in population density, but the rate of increase is significantly slower. When the normalized population density is greater than 0.8, the transportation superiority reaches stability and no longer changes. This indicates that when the population density increases, it will promote the construction of transportation infrastructure, thus enhancing the region’s transportation advantage; however, there is an upper limit to the capacity of transportation infrastructure construction, which will not be infinitely increased by the population density. For this reason, when the population density is less than a certain threshold value, the transport congestion caused by increasing population density can be improved through the construction of transportation infrastructure; however, when the population density is greater than a certain threshold value, the construction capacity of the transportation infrastructure is saturated, and the transport congestion caused by increasing population density cannot be solved by relying on the transportation construction alone, at this time, population mobility should be encouraged to reduce the rate of migration.
The spatial agglomeration effect of comprehensive transportation construction in the study area is significant, which is characterized by the following two major spatial agglomeration features: Firstly, comprehensive transportation construction is generally characterized by the spatial distribution of poorer in the west and better in the east, which is determined by the topographical features of plateau area in the west and basin area in the east. The western region is sparsely populated and has high transportation construction costs; the eastern region is densely populated and has relatively low transportation construction costs. Secondly, in the eastern region, there are two centers for integrated transportation construction. One is centered in Chengdu, the capital of Sichuan Province, where the transportation superiority of the surrounding area is proportional to its distance from Chengdu. The other is centered on the municipality of Chongqing, a municipality directly under the central government, which is closer to the region where integrated transportation construction is concentrated. Regional transportation construction can alleviate the transport pressure brought about by increasing regional population density and promote the growth of total regional GDP. When the region faces the pressure of population density, it will speed up the comprehensive transportation construction to relieve the transport pressure caused by the population growth, and the regional transportation advantage will be enhanced; when the regional per capita GDP increases, it will increase the investment in transportation construction to drive the regional GDP growth, and the regional transportation advantage will be enhanced. Therefore, there is a positive correlation between regional transportation superiority, regional population density and per capita GDP, i.e., when the population density and per capita GDP increase, the transportation superiority of the corresponding region will also become larger. However, there is a saturation value of regional transportation superiority. After reaching the saturation value, the regional transportation superiority will be stable and will no longer change with the changes in population density and GDP per capita. This is because there is an upper limit to the amount of transportation land in the region, and transportation construction will reach saturation. The distribution of transport arteries in the study area is irrational, with a large difference between east and west. Highways and railroads are densely distributed in the eastern part of the study area, which accounts for 52% of the land area of the study area, while there are no highways and railroads in the western part of the area, resulting in uneven development between the east and west of the study area and poor transportation connectivity between the east and west regions. The low density of transport arteries reduces the accessibility between cities, and the low grade of transport arteries limits the improvement of transportation capacity, thus limiting the national economic and socio-economic development of the study area. For this reason, it is necessary to continue to strengthen the construction of transport arteries in the study area, increase the density of transport arteries, per capita ownership, and form a transportation network with wider coverage and finer density.
Footnotes
Acknowledgments
We thank the Sichuan bureau of surveying, mapping and geo-information, the Sichuan engineering research center for geographic situation and resource and environment bearing capacity monitoring, and southwest university deeply for providing data for this study.