
Abstract
A novel green delivery method for express delivery based on the urban metro network, referred to as Green metro express delivery (GMED), is presented. A multi-objective mathematical programming model is first proposed to maximize the search for the best transportation costs and lowest carbon emissions. To solve the GMED model e-ciently, a two-layer coding method is used to encode the path and the non-dominated sorting genetic algorithm II (NSGA-II) is adopted. Finally, a numerical experiment was conducted with Ningbo Metro Network as a case to prove the effectiveness and stability of NSGA-II in solving the GMED model. The result shows that: (a) Compared with the vehicle express delivery method (VED), GMED has lower carbon emissions and vehicle mileage. (b) For the same quantity of express delivery, the transportation costs of GMED and VED have their own advantages over different transportation distances. (c) For delivery distances with the same transportation cost, the lager the quantity of express delivery, the lower the transportation cost of GMED compared to VED.
Introduction
With the continuous improvement of logistics by means of the internet, a single transportation system is no longer sufficient to meet market demands and changes. Therefore, optimizing the transportation structure, strengthening the cooperation of different transportation modes, promoting the organic connection between inter-city trunk transportation and city-end distribution [27], and encouraging the development of intensive distribution models are of great significance for creating a green and efficient logistics system. Since the transportation industry accounts for 25% of the carbon emissions that are affecting climate change [28], the Chinese government has tightened restrictions on carbon emissions from transportation companies [29]. On the other hand, the company’s contribution to the environment determines its position in the future market [19]. At the same time, according to data released by the National Bureau of Statistics of China [23], China’s express delivery business has ranked first in the world for five consecutive years since 2015. Therefore, express companies need to find a new way of green and sustainable transportation. According to the China Vehicle Environmental Management Annual Report (2018) issued by the [20], the energy consumption and CO2 emissions per kilometer of railway transportation in unit time are one-seventh and one-third of those from road transportation. The metro system is a closed railway system, so it is necessary to explore a sustainable express model based on the urban metro system. Under this circumstance, an express delivery method combining the urban metro service with traditional vehicle freight has been introduced in China, which is called metro express delivery (MED). For instance, in Shanghai, KSUDi Company and East Union Express Company and other small and medium-sized city express companies have used the metro for express delivery.
In addition, the data in the annual statistical analysis report of China’s urban rail transit has also proved the feasibility of MED. According to the statistical report of the China Urban Rail Transit Association [6], the average unit vehicle kilometer operating cost of 34 urban rail transit cities in China was 28.1 yuan and the average unit person kilometer operating cost was 0.95 yuan, while the average unit vehicle kilometer operating income was 13.2 yuan and the average unit person kilometer operating income was 0.33 yuan. Among these 34 cities, only Beijing, Guangzhou, Shenzhen, and Wuhan were profitable operations, and the rest were running at a loss. Combining actual conditions and data analysis results, insufficient passenger flow is found to be one of the main reasons for the loss-making operation of urban rail transit. From the above data, it is not difficult to find that there are many resources in the metro system that are wasted due to idleness, so it is worth further study to use these idle resources for express delivery distribution.
Accordingly, in order not to affect the normal operation of the metro to any great extent, the time period after the end of the normal metro operation is selected to transport express delivery, also known as off-hour delivery. Off-hour delivery [11] refers to the extended operating time used for express transportation when the metro finishes passenger transportation. This delivery method is feasible due to the fact that most metros operating in cities are relatively unused due to insufficient passenger traffic. In addition, according to China’s Ministry of Finance and Ministry of Environmental Protection’s proposal for charging related carbon tax rates, the carbon emissions generated during the transportation process are quantified and included in the distribution cost to find the optimal distribution method and route. Consequently, this paper is devoted to the study of express delivery using the metro system and the path selection problem considering carbon emissions. This is called green metro express delivery (GMED).
The remaining parts of the paper are presented as follows. Section 2 introduces relevant research and specific cases of the GMED and analyzes the lack of research on this topic. Section 3 establishes the GMED model. Section 4 adopts the non-dominated sorting genetic algorithm NSGA-II to solve it. Section 5 takes the metro network in Ningbo, China as a practical case, comparing and analyzing the vehicle express delivery (VED) method and the GMED method. Finally, conclusions and future research directions are provided in Section 6.
Literature review
The transportation of goods is accompanied by energy consumption and carbon dioxide emissions pollution. In order to solve the contradiction between freight transportation and environmental protection, an interesting possibility is to use the urban railway network and related infrastructure to transport goods and reduce their carbon footprint. Kashima, Nakamura [25] proposed an urban underground cargo distribution system based on the passenger railway network to alleviate urban environmental problems such as traffic congestion and pollution emissions in Tokyo. Robinson and Mortimer [22] envisage a method of transporting freight by underground railways, including plans for future underground freight transportation at night. Subsequent research analyzed and evaluated an underground logistics system exploration project and evaluated its implementation effects through interviews [4]. Analysis by Dinwoodie [9] shows that rail freight transport, as an environmentally friendly mode of transportation, has obvious economic benefits and development potential. Nuzzolo and Comi [3] studied the possibility of using passenger trains to deliver cargo between Naples and Sorrento, Italy. They proposed to remodel the existing infrastructure in railways and stations to store cargo and transport it during off-peak hours. In addition, Browne, Allen [17] pointed out, from a qualitative point of view, some of the difficulties for the railway becoming an environmentally friendly mode of urban freight transportation, without quantitative analysis and calculation. Gonzalez-Feliu [12] used a socio-economic cost–benefit analysis to assess the applicability of tram freight in the Paris region and prove the potential of the freight model. Motraghi and Marinov [2] and Dampier and Marinov [1] studied urban freight in the Newcastle metro system. The results show that the concept of using the urban railway network to transport goods is feasible, but further research is required before actual implementation.
Next, successful application cases of the metro to solve urban freight transportation are also discussed in this paper. In Dresden, Germany, there is a tram used to transport auto parts from a Volkswagen warehouse near the urban railway hub to a factory in the city center. The freight line can transport 300,000 tons of goods a year, 10 times a day, greatly reducing carbon dioxide emissions [10]. Paris’s commuter line D (RER D) transports household goods, leisure products and other goods from the MONOPRIX warehouse (Combs-la-Ville and Lieusaint) on the outskirts of Paris to the Bercy station in Paris [21]. These items are then transported to the store by trucks that use natural gas vehicle (NGV) fuel to meet the emission reduction principles along the logistics line [15]. In 2010, Kikuta and Tatsuhide [13] set up a special freight area for metro freight distribution services in metro cars. The practice location is Sapporo, Japan. Practical results show that the distribution method can be expected to improve the smoothness of goods circulation, reduce the number of roadsides unloading vehicles and protect the environment, and also confirm the public’s positive acceptance of this project. The Yamato Transport Company started a light rail freight service in mid-2011, and completed the last mile of package delivery with electric bicycles. The line only runs once before the daily morning peak of passenger flow, effectively replacing truck transportation [8]. In New York, converted metro cars are used for metro waste collection and transportation. The collection is done overnight. Since the New York metro is running 24 hours a day, 7 days a week, the metro waste transport (freight transport) is mixed between the passenger transport. The program collects 14,000 tons of garbage per year and has 11 metro trains covering 359 stations and 567 stops [18]. Brice, Marinov [7] completed a baggage transfer system to facilitate passengers transporting luggage from Newcastle city center to Newcastle International Airport via the metro (light rail system).
The above literature all show that the use of urban rail transit network for express transportation is the current development trend of the logistics industry, but the metro freight mode proposed in the existing literature is a mixed passenger and freight operation mode during non-passenger peak periods. In this case, the loading and unloading of goods may affect the operating time of trains and cause metro train delays. In addition, if the number of express deliveries is too small, the cost of metro distribution may be higher than other ground transportation distribution solutions. Therefore, this article chooses to carry out metro express delivery during the non-delivery period, so that a large number of express deliveries can be delivered without considering the problem of metro delays. In order to verify the effectiveness of this delivery method, the following article uses an accurate model to calculate
It should be pointed out that the multimodal transportation of goods is the general trend of the development of the logistics industry, and green development is the theme of all economic development at the moment. Although some literature studies have concluded that the combination of urban metro services and traditional vehicle freight can reduce carbon emissions and protect the environment, there are few real-time carbon emission data collection and transportation positioning methods, and carbon emissions costs need to be further quantified [16]. Therefore, this article comprehensively considers carbon emissions and metro freight, and proposes a new type of green logistics method, introduces the MED distribution method and establishes a green metro express delivery routing model.
Green metro express delivery routing model construction
Problem description
The GMED operation process is as follows: express delivery from the distribution center through a vehicle to metro entry stations, then transfer to the metro for distribution outside the passenger operation period; after transport out of the metro exit station, a vehicle will then complete the delivery for the final kilometer to the express delivery stations. This process is shown in Fig. 1.

GMED operation.
The GMED model can be described as follows: an express delivery distribution center provides distribution of goods for multiple express delivery stations. The number of courier stations is determined, but the spatial distribution is different. The express delivery company hopes to find the optimal distribution path to minimize the distribution cost and reduce the carbon footprint. The metro company hopes to maximize the use of metro resources and improve the distribution efficiency within an acceptable range. Therefore, this paper focuses on research in terms of the express delivery assembly, transshipment connection and route selection to meet the needs of both the express delivery companies and the metro companies. Because the demand of the express delivery station is known, the total quantity of express delivery is determined and the geographic location of each node is fixed, some assumptions made in this paper are presented below.
Different transportation modes have different carbon emission costs. The main idea of this paper is to build a path selection model with the transportation cost and carbon emission cost as the targets. The notation s used throughout the paper have been summarized (see Table 1).
Notations
The transportation cost is composed of the vehicle transportation cost, metro transportation cost and node transfer cost. The cost of each part is described below.
Vehicle transportation cost
The transportation cost of vehicles is mainly composed of the transportation distance, the number of vehicles, the number of express deliveries and the fixed operating cost of the vehicles. Therefore, the transportation cost in the route is as shown in Equation (1).
In Fig. 1, the entire distribution process is divided into three stages, of which the first and third stages are vehicle transportation. Therefore, in the same way, the vehicle transportation cost fvj′i′ in the route (j′, i′) can be obtained.
In summary, Equation (3) represents the vehicle transportation cost.
The metro transportation cost is mainly composed of the transportation distance and transfer cost. In this stage, every time an express delivery is transferred, it needs to go through two carrying processes. Therefore, the transportation cost fmjj′ required for the express delivery to complete a metro line (j, j′) is shown in Equation (4).
The metro transportation cost f
m
can be obtained from Equation (4), as shown in Equation (5).
The number of express deliveries and the frequency of transfer together constitutes the node transit cost. The number of transfers is mainly determined by the number of loading and unloading, and the completion of one loading and unloading of an express delivery is regarded as one transfer. Equation (6) shows the method of calculating the node transfer cost f
n
.
Generally, the fuel consumption or vehicle travel distance is used to estimate CO2 emissions. The vehicle is considered to be driving normally on the road at a prescribed speed, and the CO2 emissions are calculated based on the driving distance of the vehicle.
According to “General Principles of Comprehensive Energy Consumption” (GB/T2589-2008), the method for calculating the carbon emissions of the vehicle with a unit express delivery after the completed route (i, j) is shown in Equation (7).
Where the F (vs ij ) is the fuel consumption of the vehicle when the driving speed is vs ij on the route (i, j). The calculation method is shown in Equation (8).
co β is the low heating value of gasoline fuel (kJ/kg), which is 43070.
Similarly, according to Equations (7) and (8),
In addition, the metro is operated by electric traction, so assuming that the metro is running at rated power, the carbon emissions generated by a single train running one trip on this line can be obtained as shown in formula (9).
where:
E m represents the carbon emissions generated by each kilometer of metro operation.
C e is the carbon emission factor of electricity, which is 0.95 kg/kWh [5].
P is the rated power for metro operation.
T is the time required for the metro to run one trip at rated power.
L is the total distance of one metro run trip.
Therefore, Equation (10) indicates the carbon emission cost of completing one express delivery distribution as shown in Fig. 1.
Due to the difference in carbon emissions from different transportation costs and different transportation methods, a multi-objective path selection model (i.e., the GMED model) was established with the goal of finding the minimum transportation cost and minimum carbon emissions. The specific mathematical formula is as follows.
The transportation cost f
C
is the sum of the vehicle transportation cost f
v
, the metro transportation cost f
m
and the node transit cost f
n
, that is, f
C
= f
v
+ f
m
+ f
n
. Hence, the mathematical formulation of the GMED model is built as follows.
Subject to:
Equation (11) denotes the smallest transportation cost and the calculation process is respectively made up of Equations (3), (5) and (6). Equation (12) represents the minimum carbon emission and the specific calculation process can be obtained according to Equations (7)–(10).
The vehicle path and capacity limits are as follows: Equation (13) assigns a unique route for each vehicle from the express delivery center to the metro entry station. Equation (14) constrains the capacity on the route. Equations (13) and (14) determine different transportation routes for different metro entrance stations. Similarly, in the third stage, the path and capacity constraints of the vehicle are as follows: Equation (15) imposes that each vehicle can only have one unique route from one metro exit station to one express delivery station at the end delivery. Equation (16) ensures the number of vehicles in the third stage. Since the vehicles for transportation in the first and third stages are independent of each other and do not interfere with each other, Equation (17) is proposed. The total number of vehicles in the entire distribution process also needs to be restrained, as in Equation (18). Equation (19) considers the conservation of the quantity of the express delivery. Equation (20) stipulates the number of transfers in the metro network. Equation (21) expresses the capacity limit of the metro.
The GMED model is a multi-objective planning model for transportation costs and carbon emissions. In order to obtain the Pareto optimal solution set, the non-dominated sorting genetic algorithm (NSGA-II) is used for solving the model. NSGA-II was proposed by Deb, Pratap [14] based on NSGA. Compared with ordinary genetic algorithm and NSGA, this algorithm has the following advantages: The fast non-dominated sorting method in NSGA-II can effectively reduce the computational complexity of the algorithm. NSGA-II proposes a congestion degree and a congestion degree comparison operator, instead of a fitness sharing strategy that requires a specified sharing radius, it is beneficial to maintain the diversity of the population. NSGA-II introduces an elite strategy and expands the sampling space Compared with the ordinary genetic algorithm; the NSGA-II is hierarchized according to the dominance relationship between individuals before the selection operator is executed.
The specific process of NSGA-II is shown in Fig. 2.
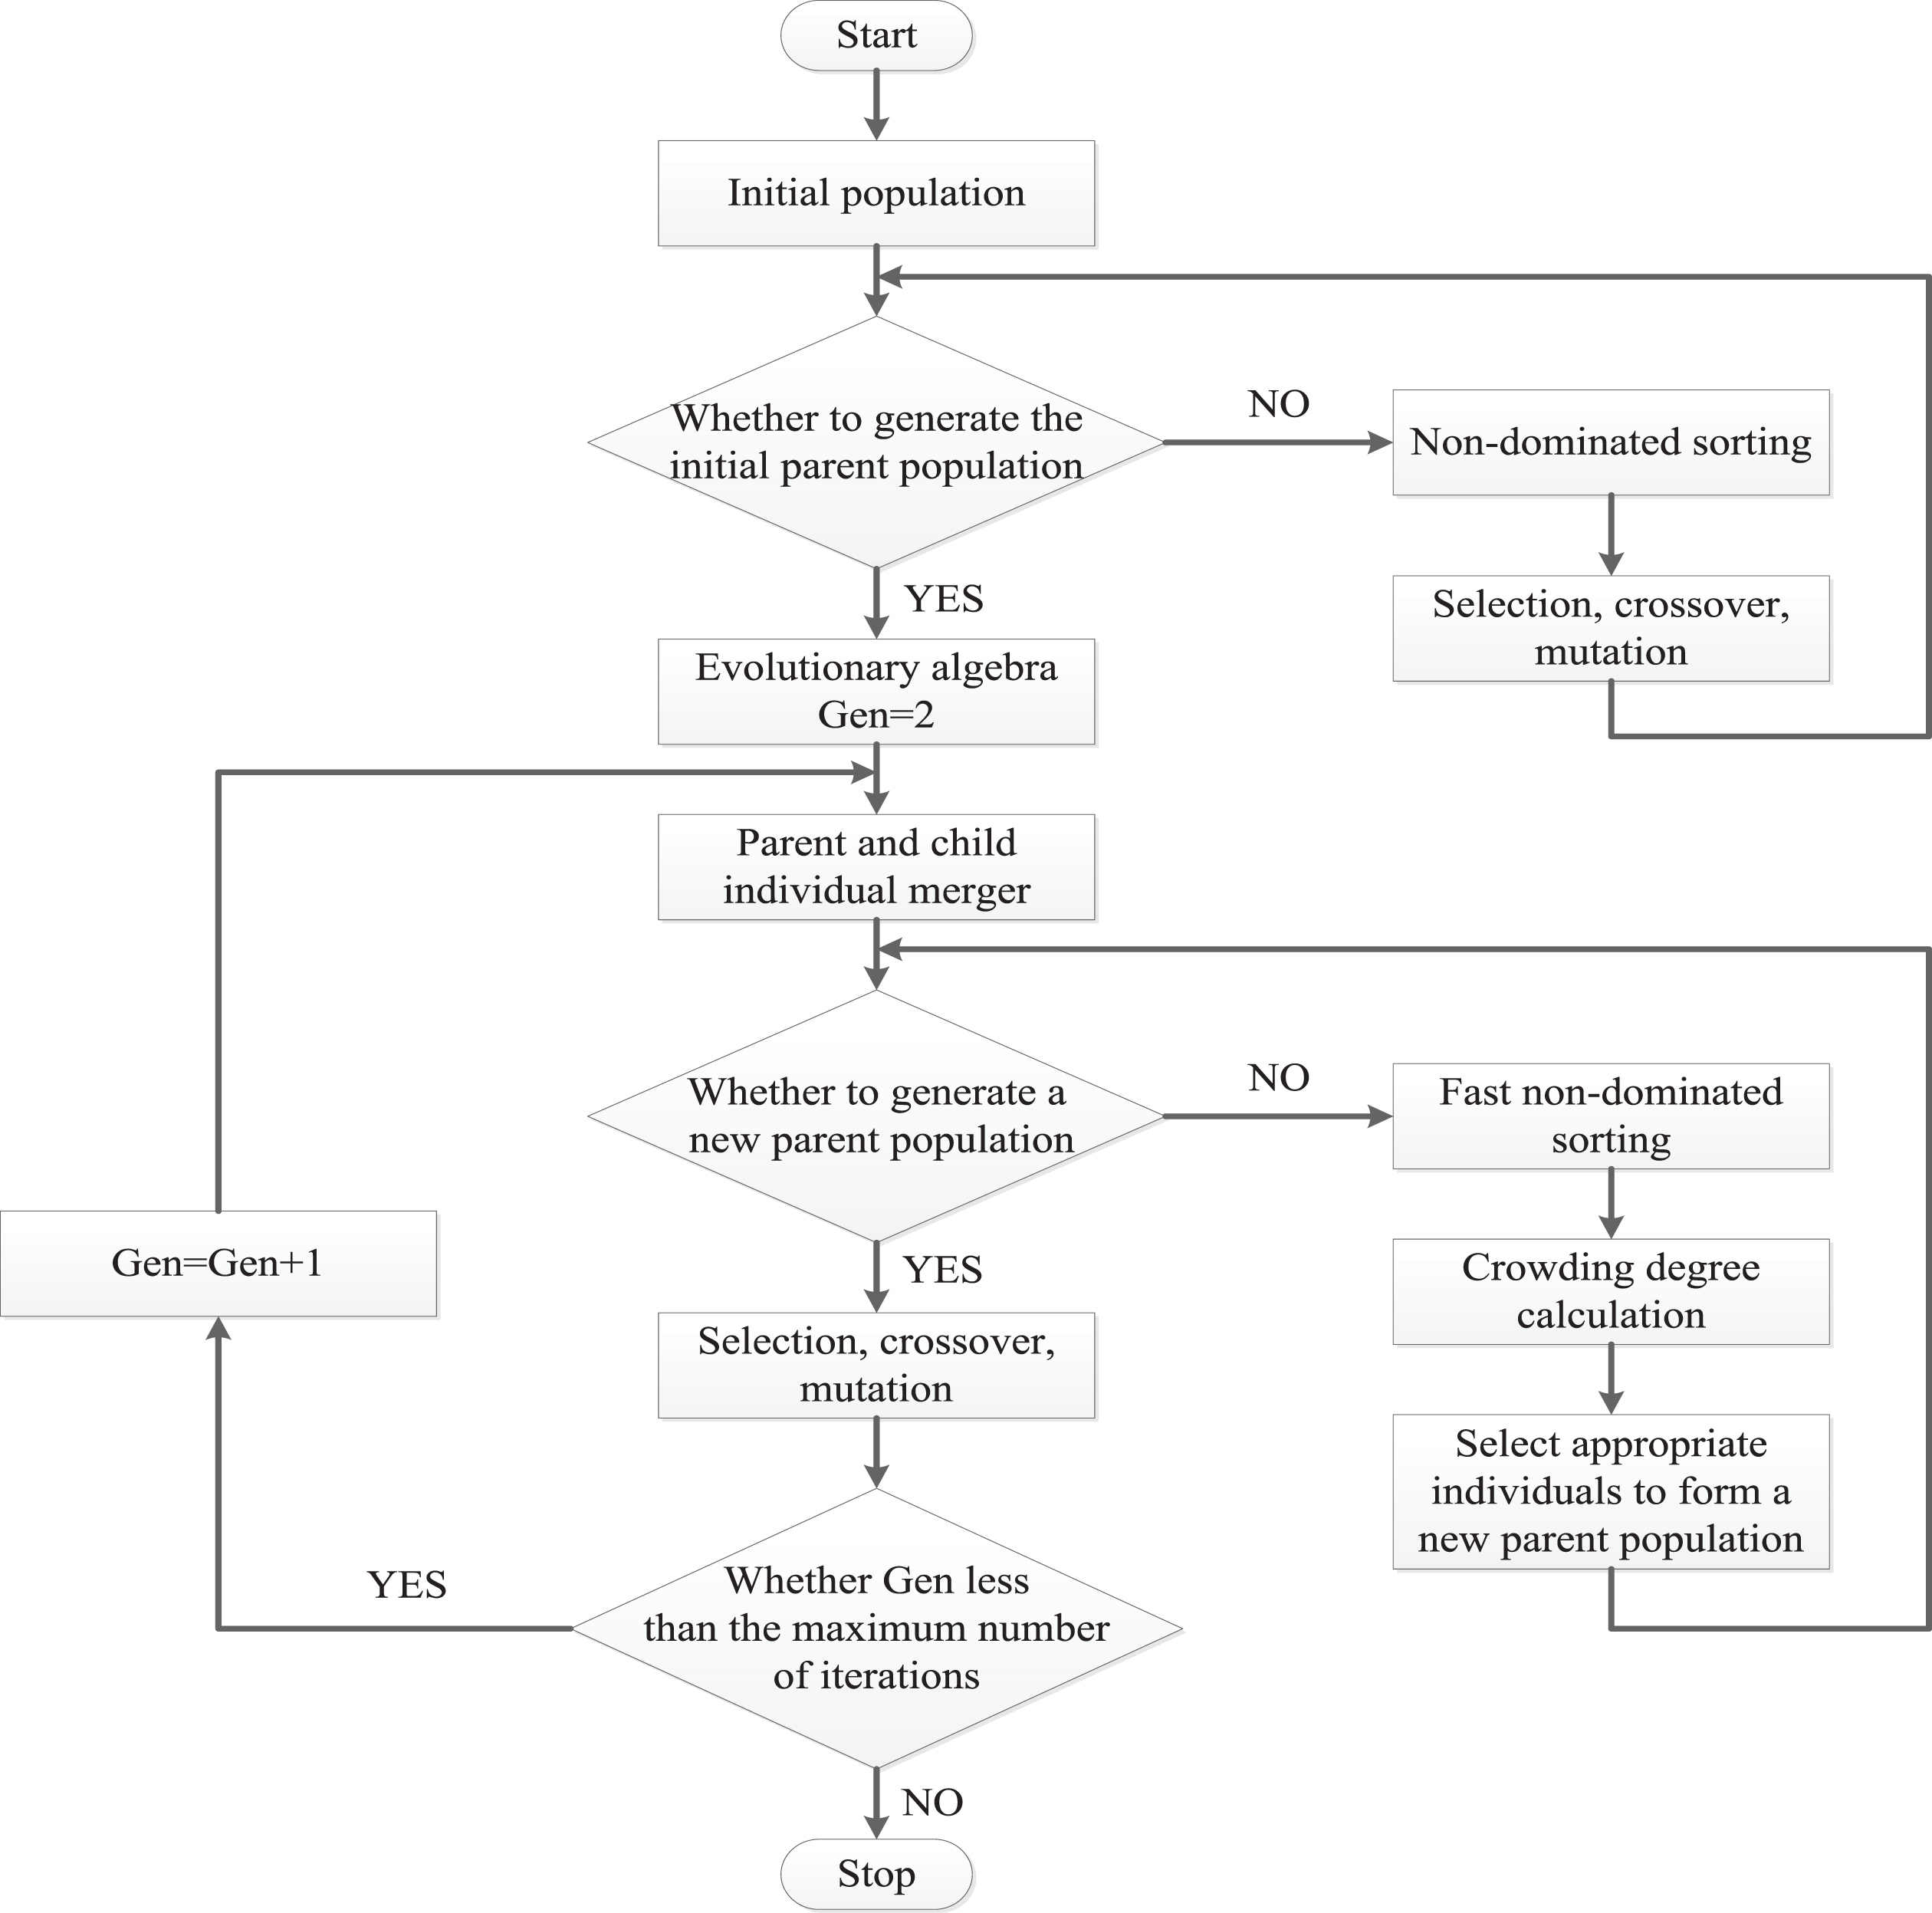
NSGA-II basic flow chart.
According to the characteristics of the GMED model, two substrings are coded for decision variables to form a chromosome. Among them, substring 1 is the real code, which indicates the start and end points sent by the express delivery. Because there is only one start to be the same as the end segment, and this chromosome segment is not involved in genetic operations.
Substring 2 is a real number code and represents the express delivery’s entry and exit stations in the metro. Substring 1 and substring 2 correspond to each other. For example, the express delivery from the distribution center needs to be distributed to 4 express stations, and needs to pass through 4 metro entry and exit stations, respectively (see Fig. 3).
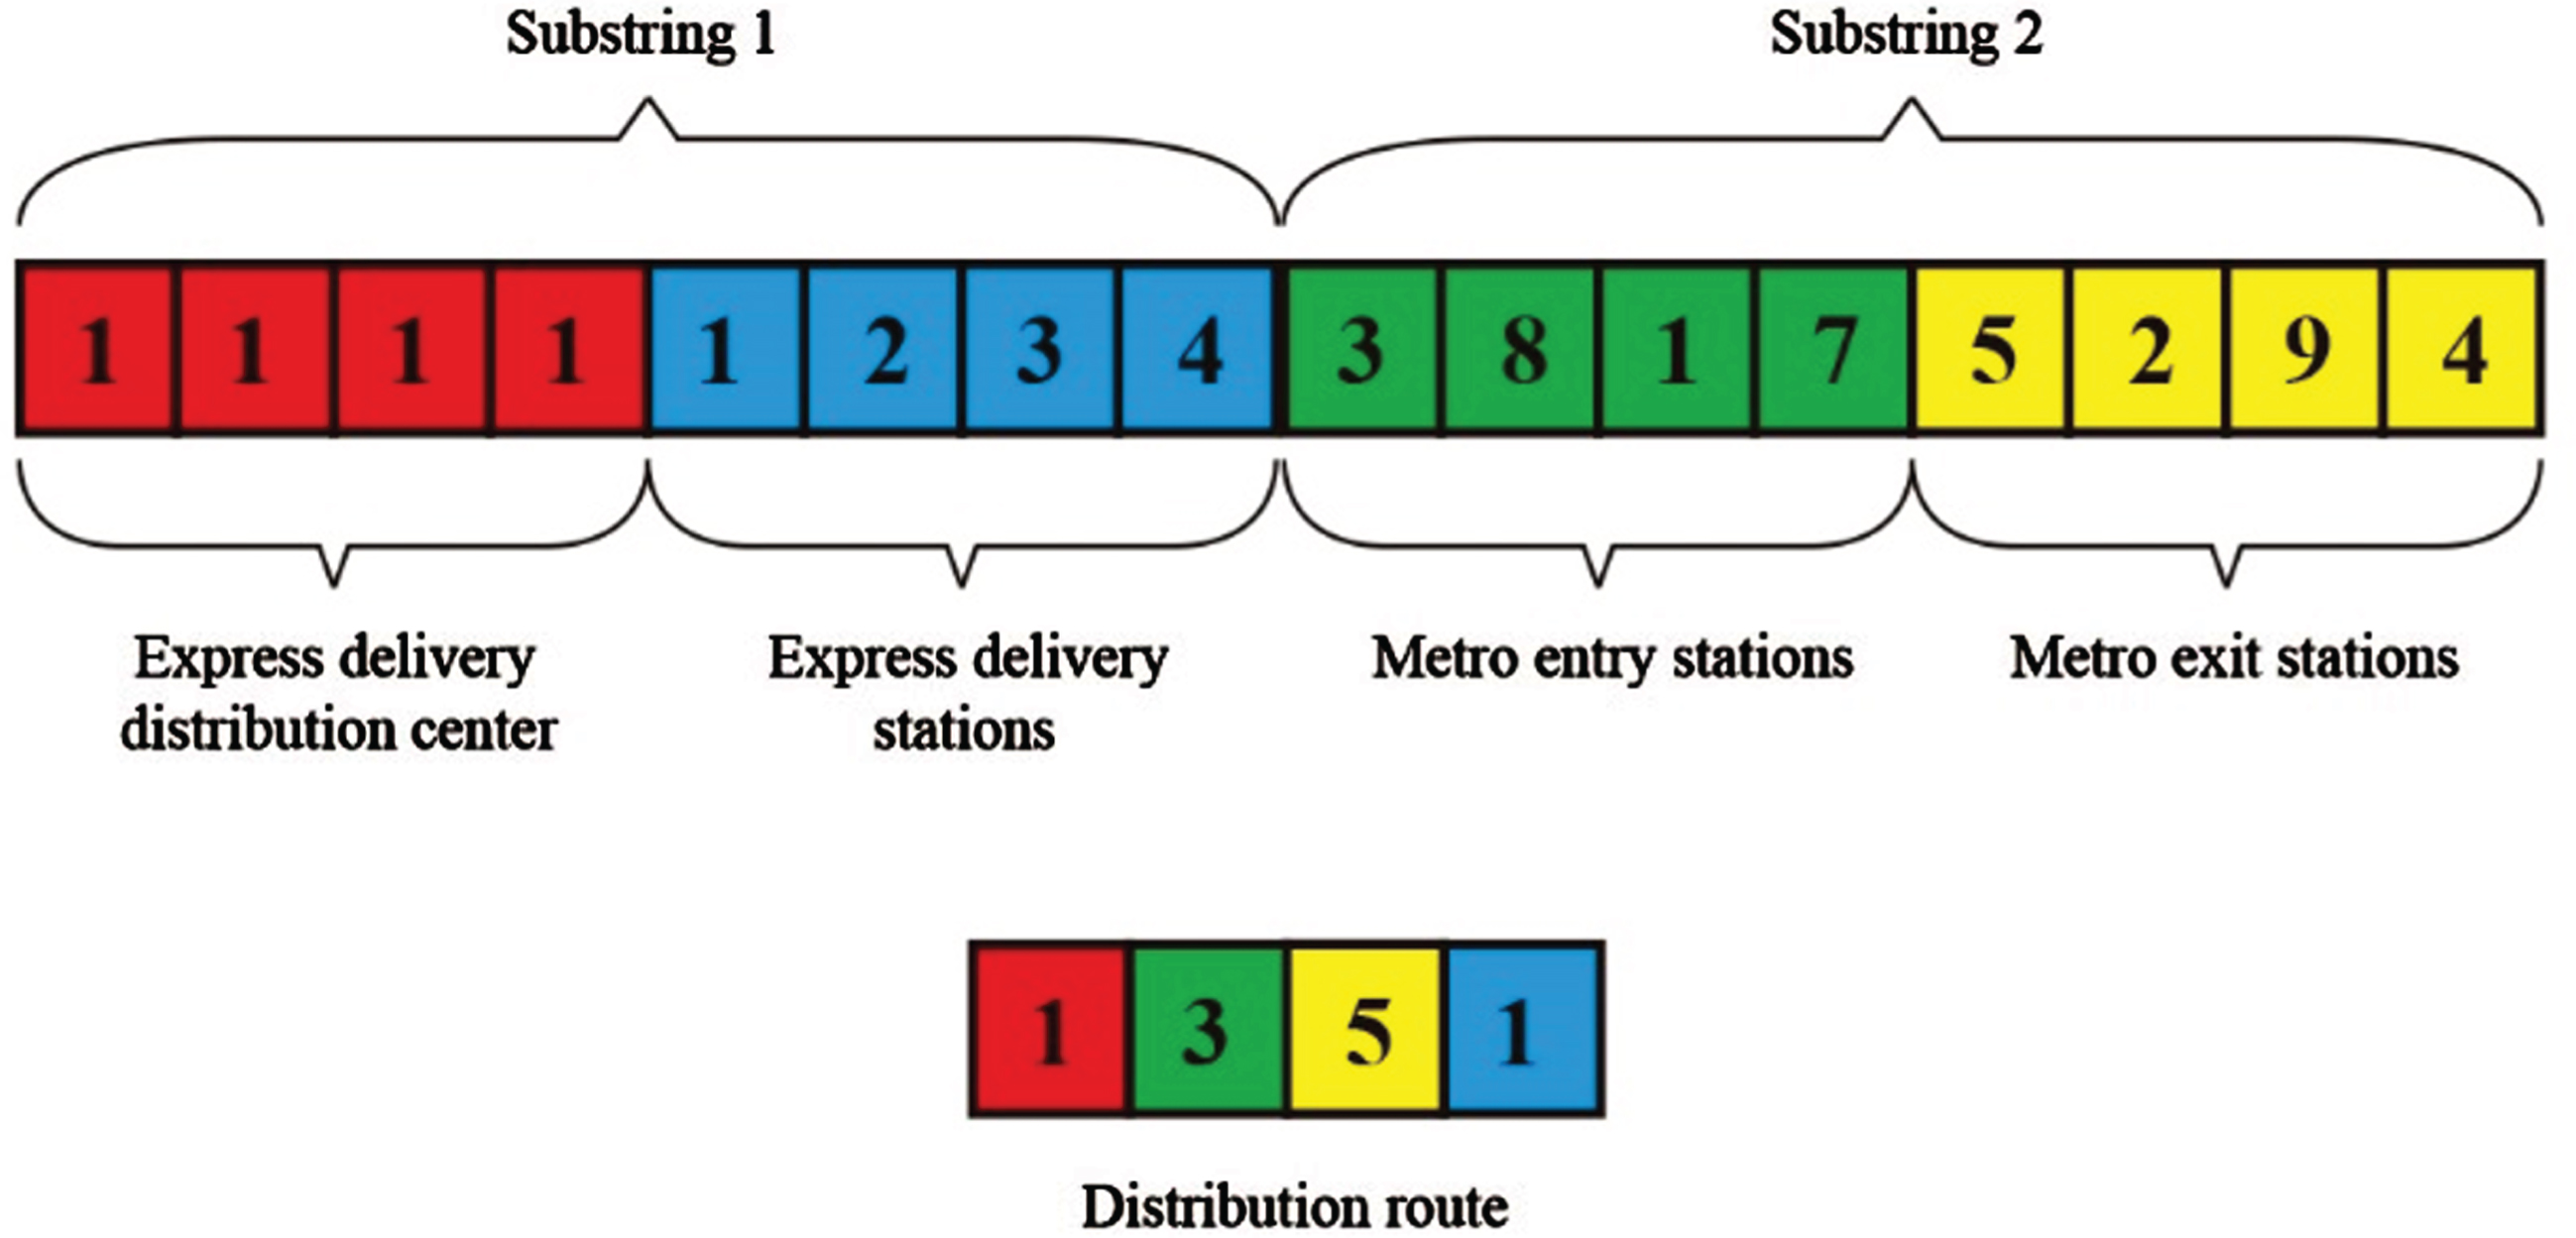
Chromosome coding diagram.
In Fig. 3, the chromosomal gene fragments are all in one-to-one correspondence. The string 1351 indicates that the express delivery departs by vehicles from the distribution center to the metro entry station coded as 3 and exits from the metro station coded as 5, and is then delivered to the express delivery station coded as 1 by vehicles. The entire route scheduling operator is: 1351, 1822, 1193, 1744.
There is a population P of size N and we classify the population P into m subsets P1, P2, P3, ⋯ , P
m
. Suppose there are two vectors n
p
and s
p
, where p ∈ P: n
p
records the number of individuals that dominate the individual p, and s
p
records the set of individuals that are dominated by the individual p. Firstly, we calculate the n
p
and s
p
of each individual through the double loop, then P1 ={ q|n
q
= 0, q ∈ P }, then, in turn, according to the method P
k
={ allindividuals q|n
q
- k + 1 =0 } to find P1, P2, P3, ⋯ , P
m
. The specific process of constructing the classification subset is shown in
Crowding degree calculation
Each sub-goal of population P is sorted to calculate the crowding distance between each individual. The crowding distance of an individual is the sum of the distance difference between two neighboring individuals on each sub-target. In
NSGA-II
In NSGA-II, an initial population P0 with a population size of N is randomly generated, and a new population Q0 is generated through selection, crossover, and mutation operations. We combine P0 and Q0 to form R
t
(t = 0 at the beginning), classify and sort R
t
to form a non-dominated set, and then calculate the crowding distance of each sorted subset to establish a partial order set. We select individuals from the partial order set to enter P
t
+1 at a time until the scale of P
t
+1 is N. The specific process is shown in
Empirical case study
Data selection
We take the metro network of Ningbo Urban Rapid Rail Transit Construction Plan (2013–2020) [24] as an example, as shown in Fig. 4.

Ningbo metro network schematic diagram.
In Fig. 4, the metro network has 5 lines and 11 transfer stations. We select the airport logistics park near the metro line as the express delivery distribution center, L1–L5 indicate each metro line, and A–F are the express delivery stations including Jinxing Logistics, Fuyang Logistics, Yinzhou Express Branch, Wanda Logistics Park, Lingfeng Interchange, and Xiapu International Logistics Park. Taking into account the actual situation and the model solution, each metro line station is uniformly numbered according to positive integers from left to right, with the letter “I” representing the metro entry station and “O” representing the metro exit station.
According to the China Vehicle Environmental Management Annual Report (2018) issued by the [6], the energy consumption and CO2 emissions per kilometer of railway transportation in unit time are one-seventh and one-third of those for road transportation. Therefore, assuming that the vehicle transportation cost per unit express delivery unit distance is 2 yuan, the unit express delivery transport cost per unit distance is 0.3 yuan. In addition, the transfer cost per unit express delivery is 0.6 yuan, and the vehicle’s fixed operating cost is 30 yuan. Ningbo rail transit trains were grouped into 6 carriages containing a maximum capacity of 2,062 passengers, which corresponded to 1980 express delivery packages, consisting of 330 packages in each metro carriage. The capacity of the delivery vehicle was 60 packages.
Based on the Baidu Map API to obtain the mutual distance between nodes, NSGA-II is used to solve this situation, and the optimal solution set of transportation costs and carbon emissions is obtained. The Pareto optimal front obtained according to the calculation results (see Fig. 5). The abscissa represents the transportation costs, and the ordinate represents carbon emissions.
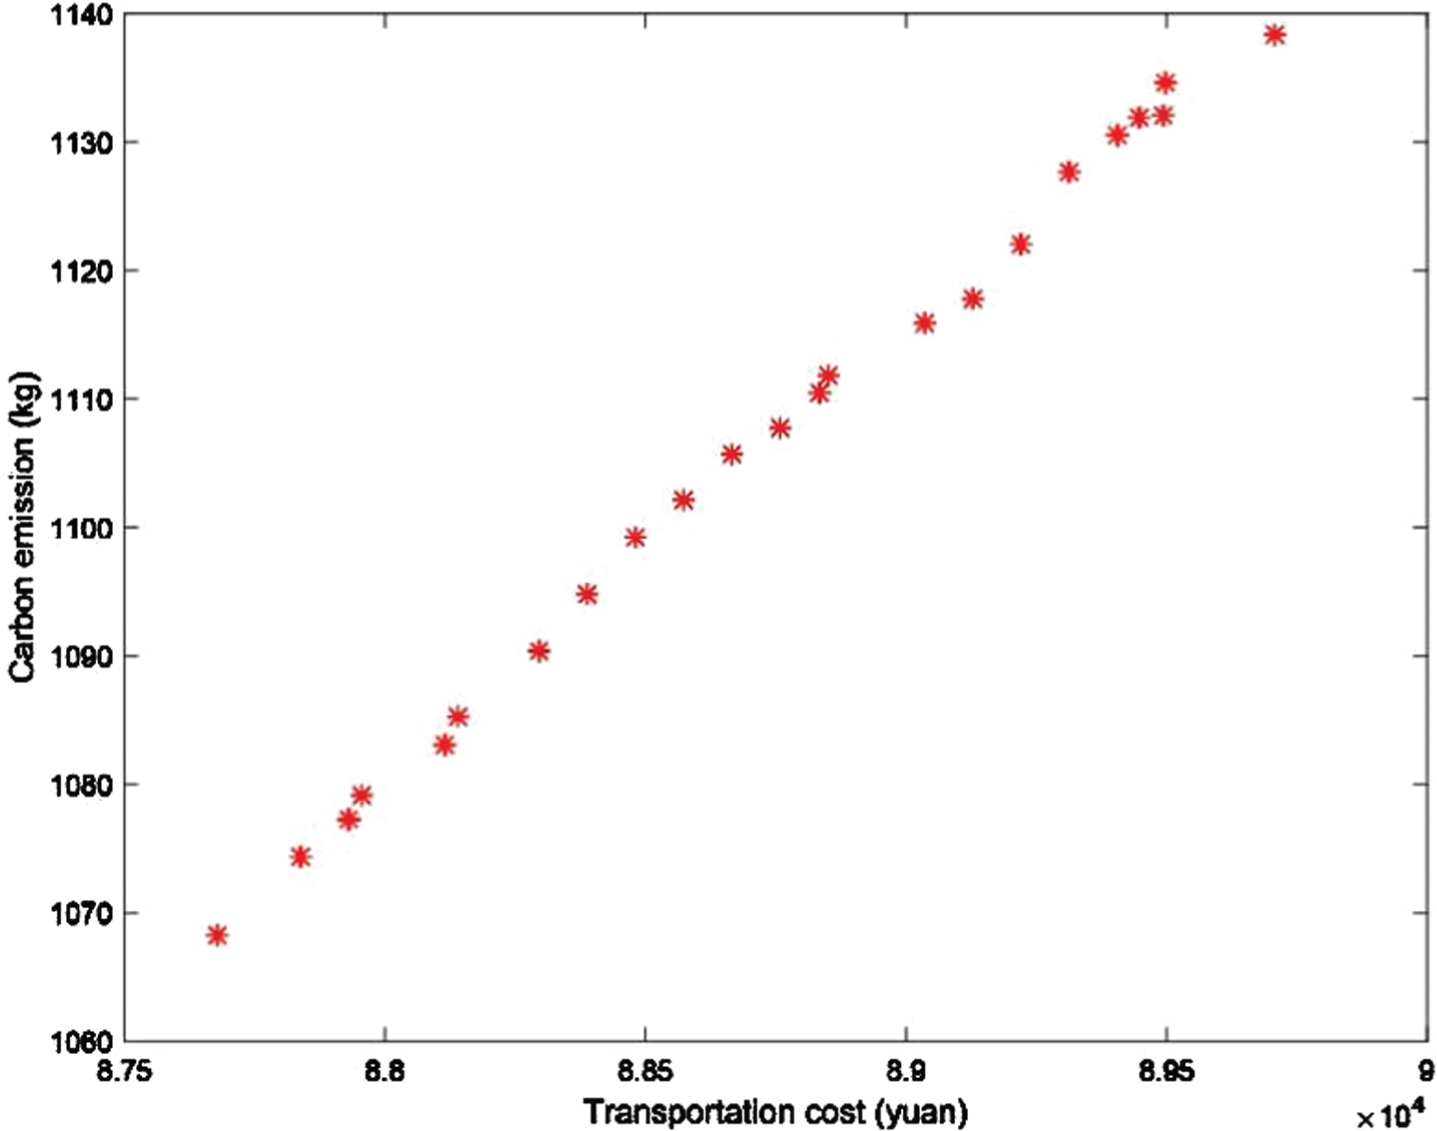
Pareto optimal front.
In Fig. 5, the transportation cost and carbon emissions are taken to the maximum and minimum values at the same time. After iterative optimization, both transportation costs and carbon emissions are improved to a certain extent. In the Pareto optimal front, the lowest transportation cost is 87,677 yuan, and the carbon emission is 1068.3 kg.
The GMED and VED calculation results are shown in Table 2, where the delivery method using vehicles throughout the total process for express delivery is called VED, which cost calculation method is the same as section 3.2.1, and the carbon emission calculation formula is as shown in Equation (8). Obviously, GMED delivery has lower transportation costs and less carbon dioxide emission. This conclusion is consistent with the actual situation, and at the same time it also verifies the previous literature from another perspective.
Calculation results
NSGA-II was run 100 times and the results were recorded in Table 3 to verify the stability and effectiveness of the algorithm in solving the GMED model. It can be seen from Table 3 that NSGA-II has good stability for solving the GMED model.
Analysis of NSGA-II running results
In order to further explore the difference between the GMED and VED methods, the distribution route and vehicle distribution distance are listed in Table 4 in correspondence with each terminal express station.
Distribution route comparison
Distribution route comparison
Compared with VED, GMED can reduce the transportation distance of vehicles on the road to a certain extent. This difference is even more significant when it comes to long-distance transportation. Those results can be clearly seen in Table 4. This also shows from another perspective that GMED can reduce the utilization rate of vehicles and ease the pressure on urban road traffic.
In order to further distinguish between the two methods of GMED and VED, the transportation costs and carbon emissions of each express station are calculated on the basis of Table 4 and are listed in Table 5.
Distribution solution comparison
In Table 5, when the two delivery methods are used for transport to express station D, the transportation cost of the two methods is almost the same, while the carbon emissions of the vehicle delivery method are more than GMED. Since the fixed operating cost of the metro is much greater than the fixed operating cost of the vehicle, the transportation cost of GMED is much higher than that of VED in the case of short-distance transportation. However, as the transportation distance increases, the advantages of GMED transportation will become apparent. Combining Tables 4 and 5, when transporting the same number of express deliveries, the transportation costs of GMED and VED are closely related to the transportation distance. Furthermore, the two delivery methods each have their own transportation cost advantages for different transportation distances. Considering that the carbon cap policy and the actual metro carbon emissions are lower than for vehicle transportation, further analysis of transportation costs is needed.
The difference in transportation costs between GMED and VED is mainly due to the metro transportation. In order to further clarify the delivery process of the two methods (see in Fig. 6). In Fig. 6, the yellow line indicates the GMED method, and the black line indicates the VED method, and the process of the two delivery methods is uniformly divided into three stages. Among them, the first and third stages are both vehicle transportation and the transportation distance is equal. Therefore, the most important thing is to analyze the cost difference caused by the distance disparity between the two methods of delivery in the second stage.

Comparative analysis chart.
In view of this fact, relevant assumptions are put forward to determine the delivery method of the express quantity when the two delivery methods deliver the same amount of express delivery to the same terminal express station, and the GMED method does not involve the transshipment process. In addition, both delivery methods only make one complete delivery. The transportation distance in the first and third stages is
where: C V is the vehicle transportation cost per unit express delivery unit distance, C M is the metro transportation cost per unit express delivery unit distance.
In this case, in order to distinguish the relationship between
Therefore, based on the above assumptions and derivation results, the metro transportation distance of GMED and the vehicle transportation distance of VED in the second stage satisfy Equation (23); VED is selected for express delivery, and GMED is selected otherwise.
On this basis, it is also necessary to compare the transportation costs of the two delivery methods for determining the transportation distance.
Based on the transportation distance for equivalent costs, Fig. 7 shows the transportation cost changes of the two delivery methods with different express quantities. The red and blue solid lines represent the transportation cost function images of VED and GMED, respectively. According to the change trend of the function images, the transportation cost of VED increases with the increase in the quantity of express delivery, while the transportation cost of GMED increases in stages with the maximum capacity of a single train. In Fig. 7, when the express quantity is less than or equal to 1980, the transportation cost of VED is always lower than GMED. When the express quantity is greater than or equal to 15900, the transportation cost of GMED is always lower than VED. When the quantity of express delivery is in the range of 1980–15900, the transportation costs of the two delivery methods each have their own advantages, but the greater the quantity of express delivery, the more obvious the advantage of GMED becomes.

The transportation cost for different express delivery quantities.
In order to broaden the channels of multimodal transportation, exploring the environmentally friendly and fast transportation methods, this article proposes a green metro express delivery (GMED) method. This new metro express delivery methods can not only avoid the loss caused by metro train delays, but also reduce the carbon emission generated by vehicle distribution. For the purpose of prove the effectiveness of the method, we have proposed a multi-objective metro distribution model with the goal of minimizing metro operating costs and carbon emissions. In addition, considering the complexity of the model, we use the S1 algorithm to solve this multi-objective GMED model. According to the characteristics of GMED, a two-layer coding method was constructed and substituted into NSGA-II for solution. In view of this, a numerical experiment was conducted with Ningbo as a case to prove the stability and effectiveness of the GMED model. The results of the case analysis show that GMED reduces carbon emissions and the mileage of vehicles compared to the vehicle express delivery (VED) method.
As the result of numerical experiment shows that, for short-distance transportation, the transportation cost of GMED is much higher than that of VED, but as the transportation distance increases, the transportation cost of GMED will gradually become lower than VED. In addition, when the transportation distance of the two delivery methods is equal to the transportation cost, the transportation cost of GMED will always be lower than that of VED when the express volume is sufficient. On the contrary, due to the fixed operating cost of the metro and the impact of the carriage loading rate, the transportation cost of GMED will be higher than that of VED. As mentioned above, whether the green metro express model proposed in this paper can make the metro system profitable, it is inseparable from the delivery distance and the number of express, and the model can be used to test instance data and obtain accurate analysis results. In general, this new type of metro express delivery strategy promotes the development of Green Logistics.
Further research can focus on the following several aspects. (1) The GMED distribution method proposed in this paper is based on the non-operating time of the metro. The model is simplified as an ideal situation, so considering the delay of the metro and the cost of related fixed equipment is an important topic for further research. (2) At present, the relevant carbon limit policy has been put on the agenda, so it may be another interesting research direction to consider different carbon limits to constrain the GMED’s distribution path selection. (3) The thesis uses NSGA-II to solve the problem. In future research, we can also study more effective heuristic methods for solving the GMED model.
Data availability
The data will be accessible upon request.
Conflicts of interest
The authors declare that they have no conflicts of interest.
Footnotes
Acknowledgments
This work was financially supported by the National Natural Science Foundation of China (71662011, 71940009). This study is also supported by Natural Science Foundation of Jiangxi Province under Grant 20202BABL212009. This study sponsored by the Special Fund for the Innovation Fund Designated for Graduate Students of Jiangxi Province YC2019-S244.